| Param | Original file | Final file |
|---|---|---|
| Filename | modeM0/AS1T02_072T01_9000002250_15240cztM0_level2.evt | modeM0/AS1T02_072T01_9000002250_15240cztM0_level2_quad_clean.evt |
| Size (bytes) | 516,159,360 | 129,971,520 |
| Size | 492.2 MB | 124.0 MB |
| Events in quadrant A | 3,207,348 | 901,954 |
| Events in quadrant B | 3,830,475 | 894,472 |
| Events in quadrant C | 3,815,378 | 873,193 |
| Events in quadrant D | 4,361,304 | 836,862 |
| Mode M9 | |||
|---|---|---|---|
| Quadrant | BADHDUFLAG | Total packets | Discarded packets |
| A | 0 | 16 | 0 |
| B | 0 | 16 | 0 |
| C | 0 | 16 | 0 |
| D | 0 | 17 | 0 |
| Mode SS | |||
|---|---|---|---|
| Quadrant | BADHDUFLAG | Total packets | Discarded packets |
| A | 0 | 126 | 0 |
| B | 0 | 126 | 0 |
| C | 0 | 126 | 0 |
| D | 0 | 126 | 0 |
| Mode M0 | |||
|---|---|---|---|
| Quadrant | BADHDUFLAG | Total packets | Discarded packets |
| A | 0 | 13599 | 3 |
| B | 0 | 15490 | 2 |
| C | 0 | 15421 | 2 |
| D | 0 | 17164 | 2 |
| Quadrant | Total seconds | Saturated seconds | Saturation percentage |
|---|---|---|---|
| A | 6158 | 30 | 0.487171% |
| B | 6158 | 275 | 4.465736% |
| C | 6158 | 130 | 2.111075% |
| D | 6158 | 112 | 1.818772% |
Noise dominated data is calculated using 1-second bins in cleaned event files. If a bin has >2000 counts, and if more than 50% of those come from <1% of pixels, then it is considered to be noise-dominated and hence unusable.
| Quadrant | # 1 sec bins | Bins with >0 counts | Bins with >2000 counts | High rate bins dominated by noise | Noise dominated (total time) | Noise dominated (detector-on time) | Marked lightcurve |
|---|---|---|---|---|---|---|---|
| A | 7479 | 6160 | 5 | 5 | 0.07% | 0.08% | 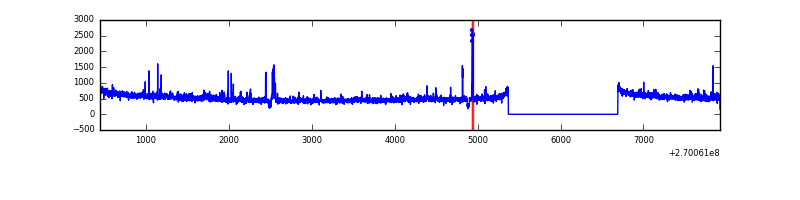 |
| B | 7479 | 6160 | 181 | 181 | 2.42% | 2.94% | 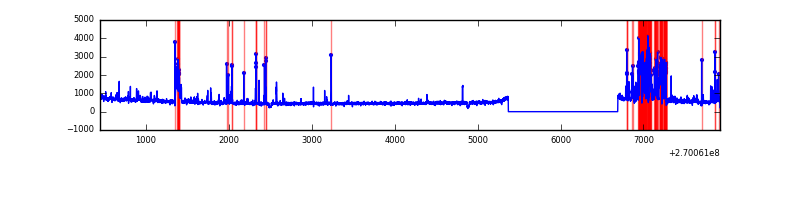 |
| C | 7479 | 6159 | 73 | 73 | 0.98% | 1.19% | 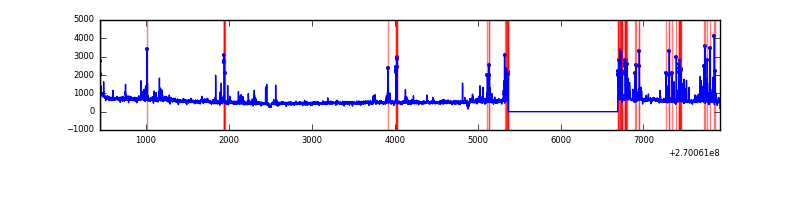 |
| D | 7479 | 6160 | 59 | 59 | 0.79% | 0.96% | 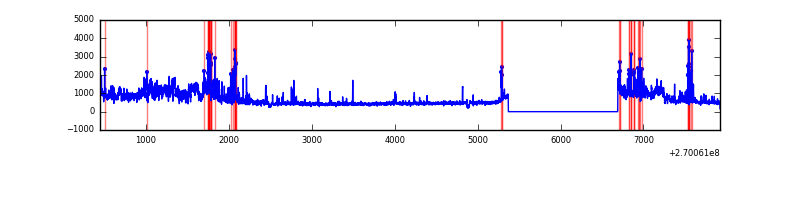 |
Top three noisy pixels from each quadrant. If the there are fewer than three noisy pixels in the level2.evt file, extra rows are filled as -1
| Pixel properties | Quadrant properties | ||||||
|---|---|---|---|---|---|---|---|
| Quadrant | DetID | PixID | Counts | Sigma | Mean | Median | Sigma |
| A | 12 | 189 | 98737 | 619.95 | 790 | 776 | 158.0 |
| A | 9 | 143 | 29894 | 184.27 | 790 | 776 | 158.0 |
| A | 13 | 248 | 25479 | 156.33 | 790 | 776 | 158.0 |
| B | 10 | 16 | 388041 | 2728.32 | 778 | 762 | 141.9 |
| B | 3 | 64 | 222353 | 1561.07 | 778 | 762 | 141.9 |
| B | 0 | 229 | 90510 | 632.26 | 778 | 762 | 141.9 |
| C | 4 | 254 | 460440 | 2739.63 | 746 | 753 | 167.8 |
| C | 3 | 233 | 399880 | 2378.71 | 746 | 753 | 167.8 |
| C | 7 | 247 | 29005 | 168.38 | 746 | 753 | 167.8 |
| D | 2 | 16 | 1179991 | 6583.54 | 749 | 730 | 179.1 |
| D | 7 | 38 | 168956 | 939.17 | 749 | 730 | 179.1 |
| D | 1 | 255 | 53354 | 293.79 | 749 | 730 | 179.1 |
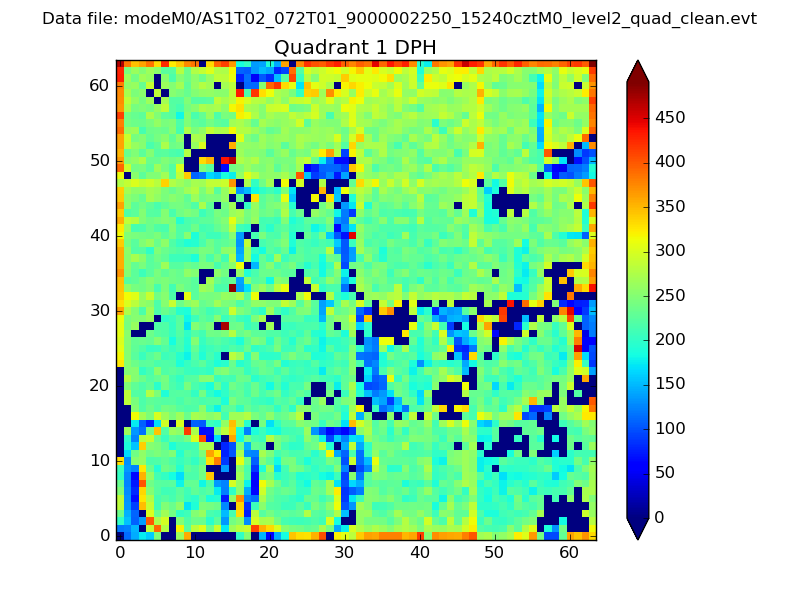
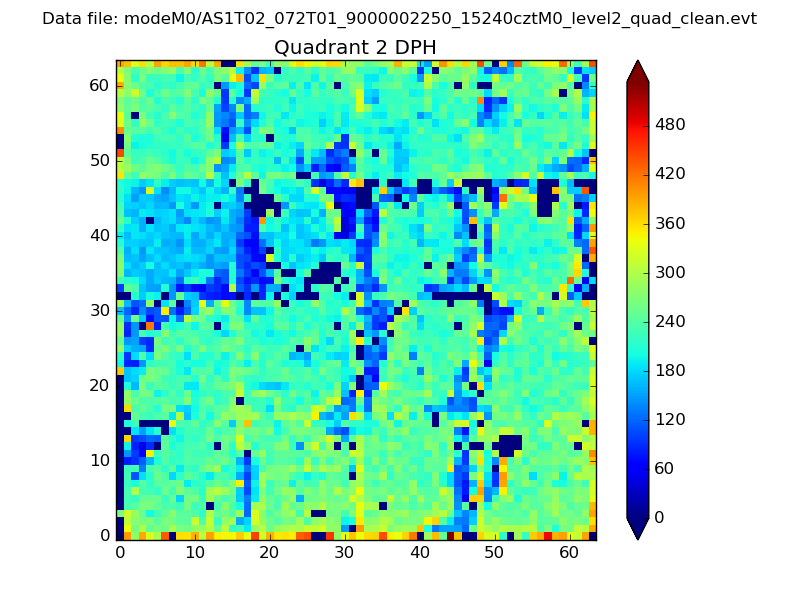
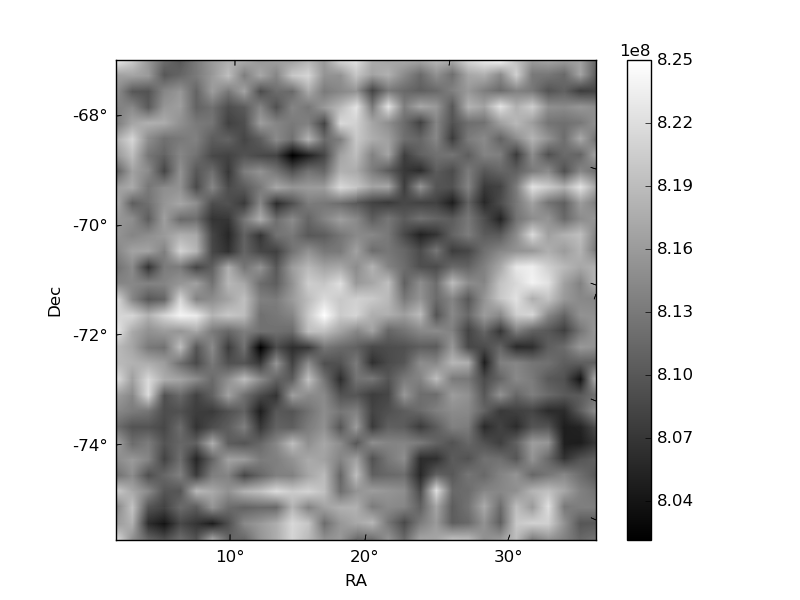
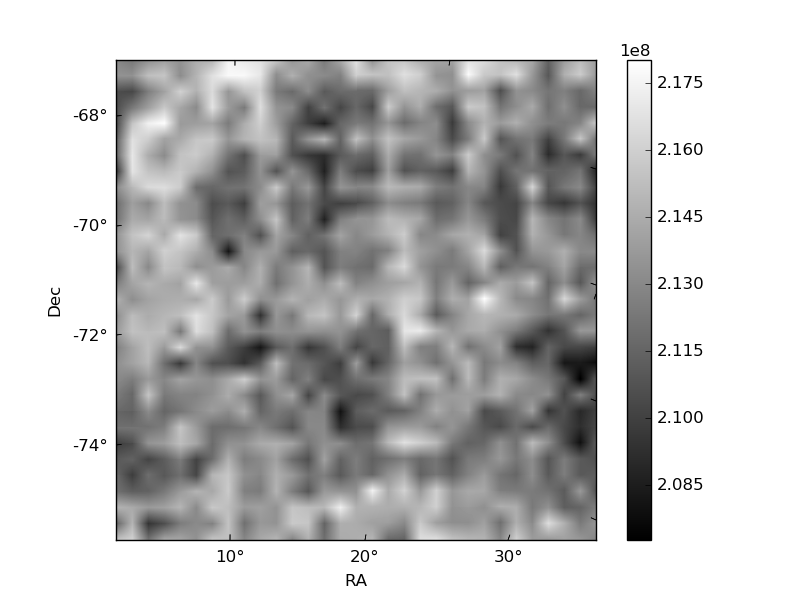
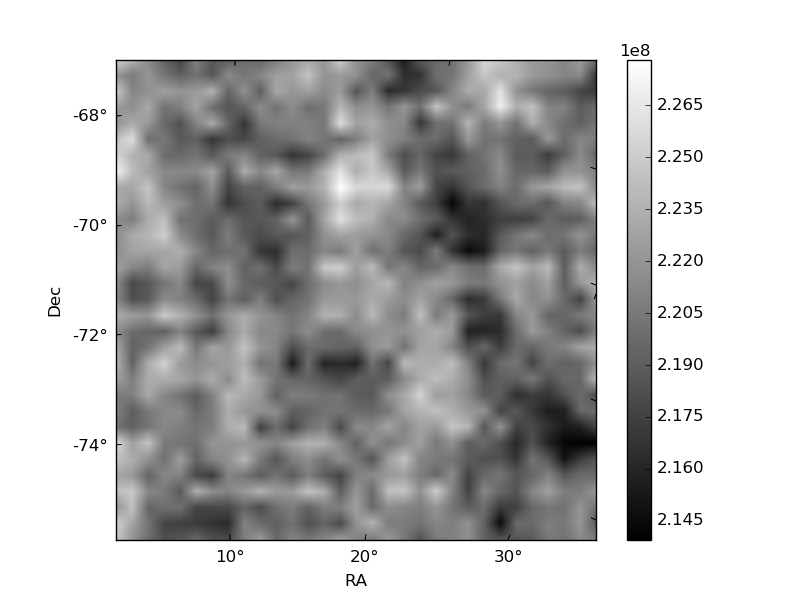
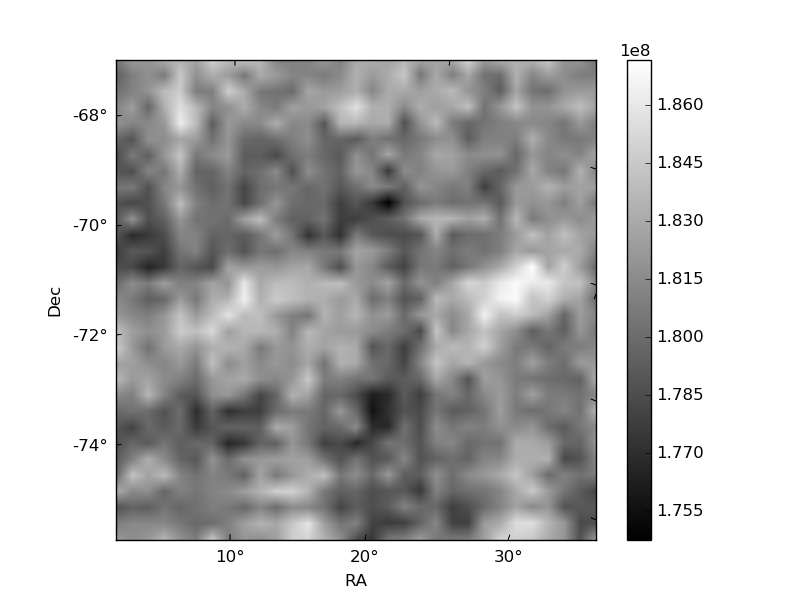
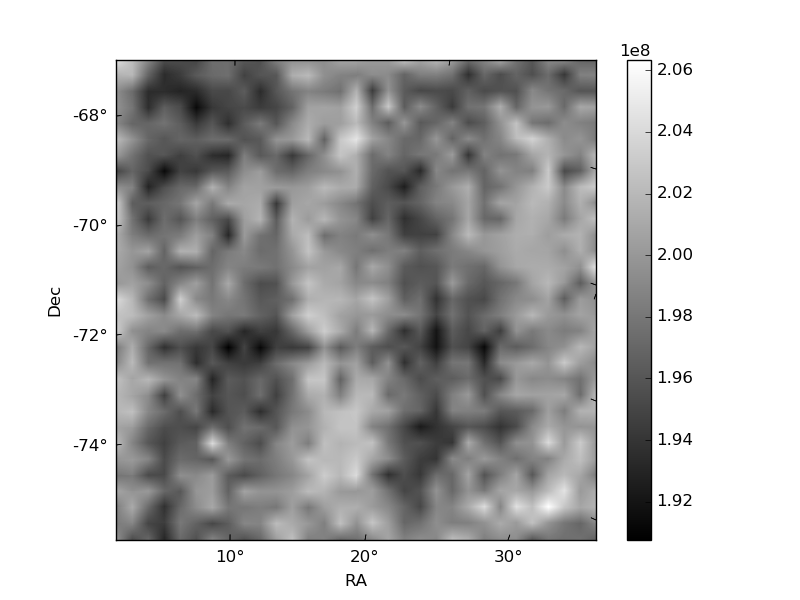
Histogram calculated using DETX and DETY for each event in the final _common_clean file
| Quadrant A |  |
 |
Quadrant B |
|---|---|---|---|
| Quadrant D | 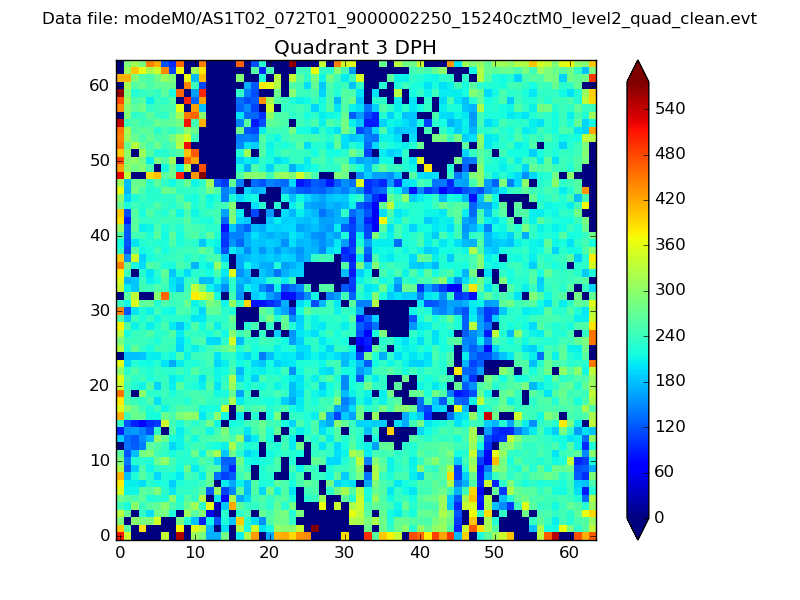 |
 |
Quadrant C |
| Plot type | Count rate plots | Images |
|---|---|---|
| Comparison with Poisson distribution Blue bars denote a histogram of data divided into 1 sec bins. Red curve is a Poisson curve with rate = median count rate of data. |
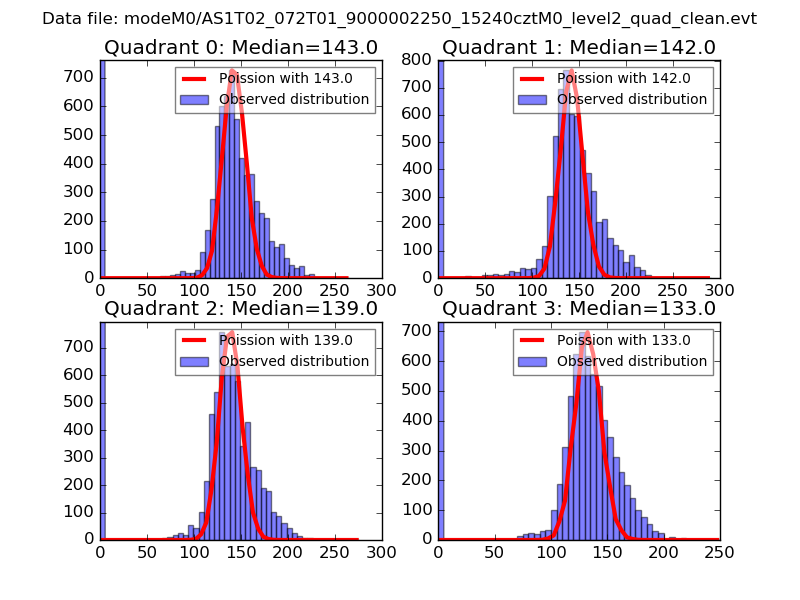 |
 |
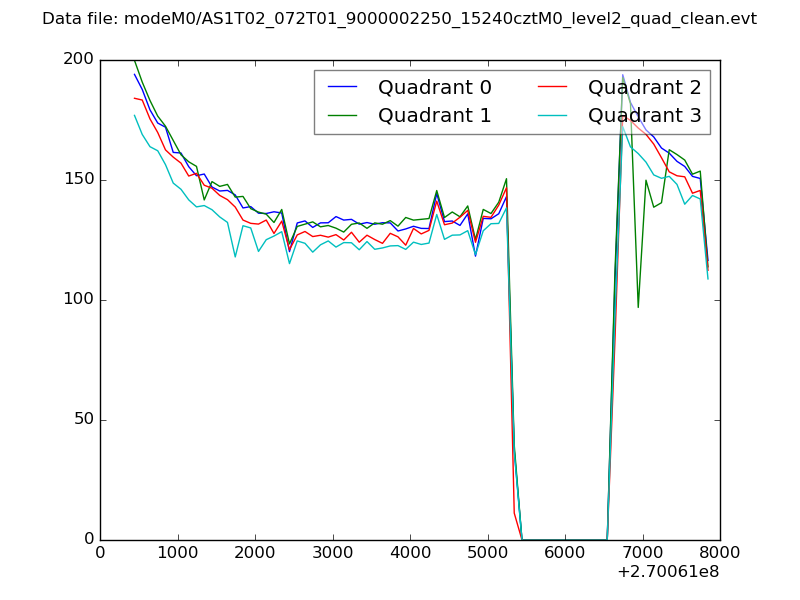
| Quadrant-wise count rates Data is divided into 100 sec bins |
 |
|
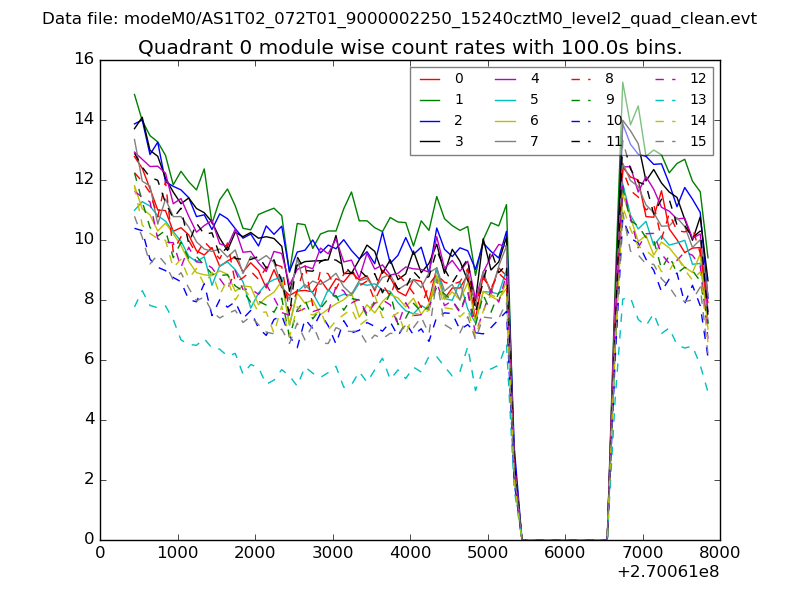
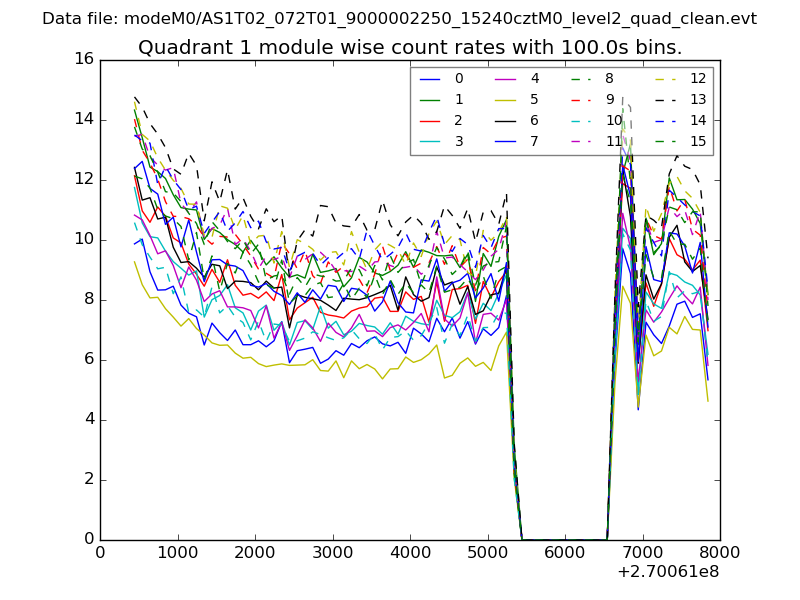
| Module-wise count rates for Quadrant A Data is divided into 100 sec bins |
 |
 |
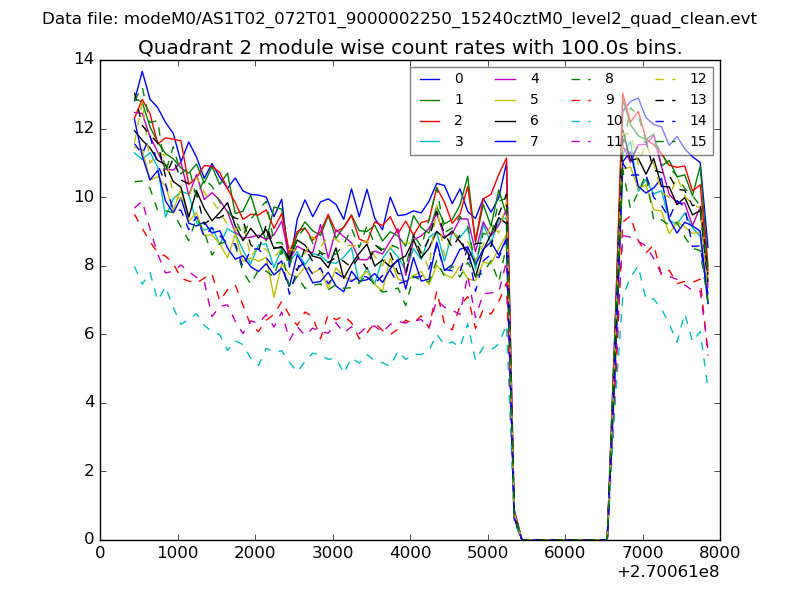
| Module-wise count rates for Quadrant B Data is divided into 100 sec bins |
 |
 |
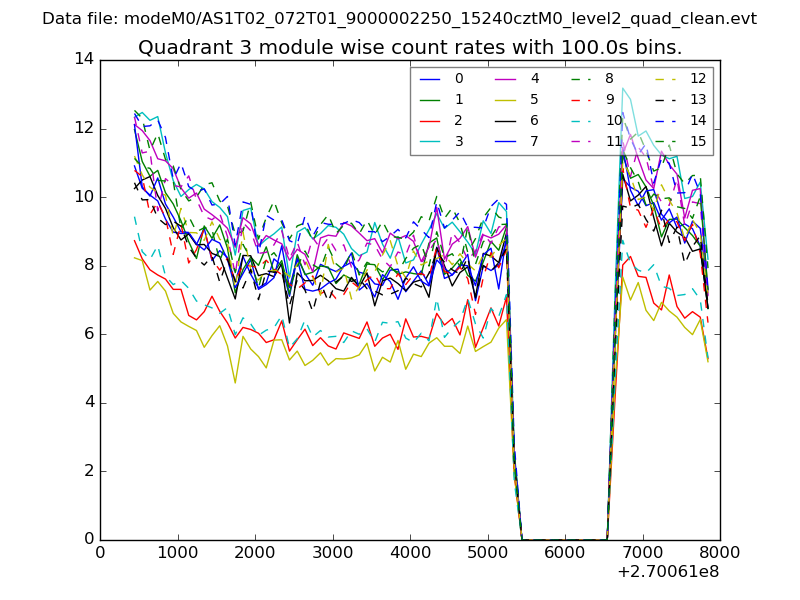
| Module-wise count rates for Quadrant C Data is divided into 100 sec bins |
 |
 |
| Module-wise count rates for Quadrant D Data is divided into 100 sec bins |
 |
 |
| Parameter | Plot |
|---|---|
| CZT HV Monitor | 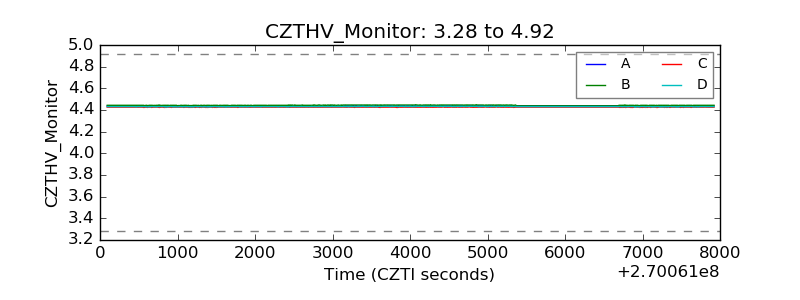 |
| D_VDD | 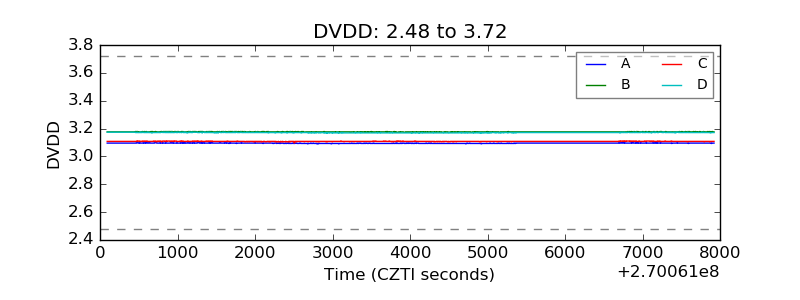 |
| Temperature 1 | 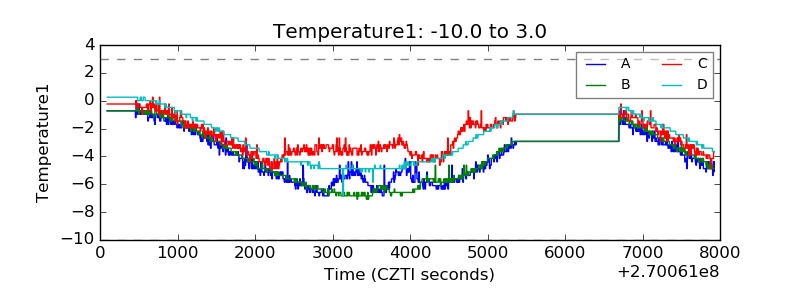 |
| Veto HV Monitor | 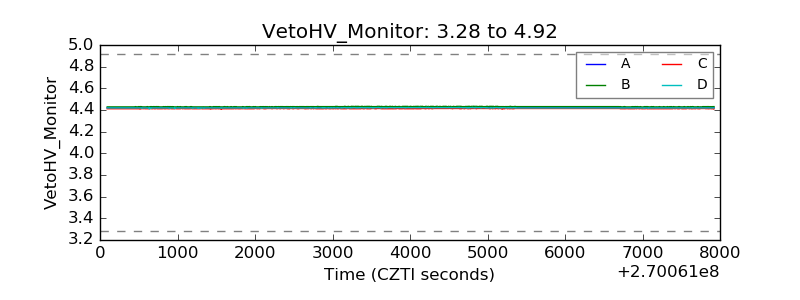 |
| Veto LLD | 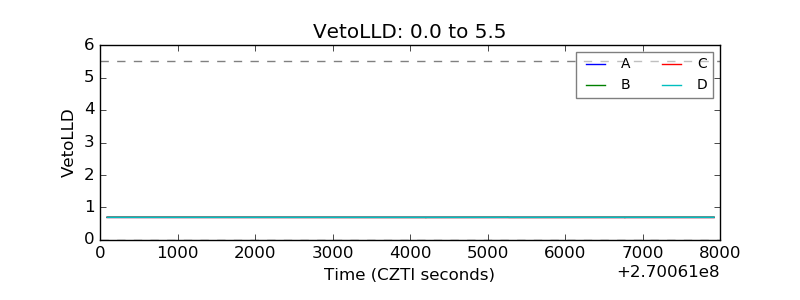 |
| Alpha Counter | 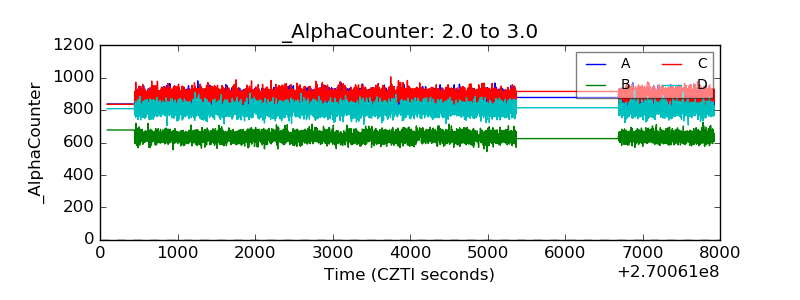 |
| _CPM_Rate |  |
| CZT Counter | 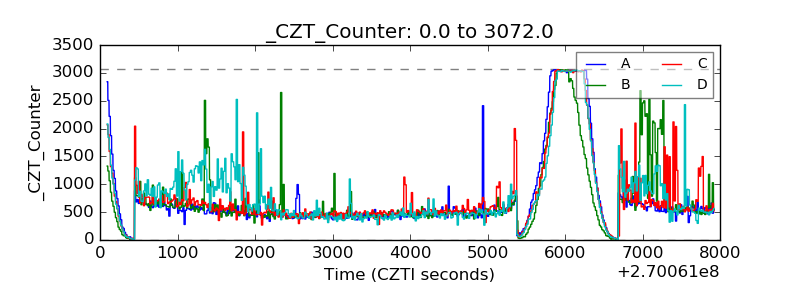 |
| +2.5 Volts monitor |  |
| +5 Volts monitor |  |
| _ROLL_ROT | 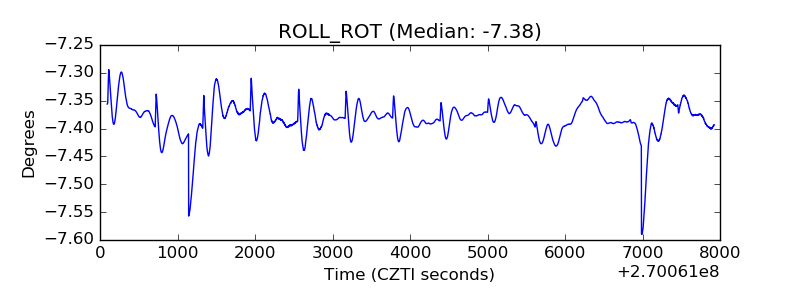 |
| _Roll_DEC |  |
| _Roll_RA | 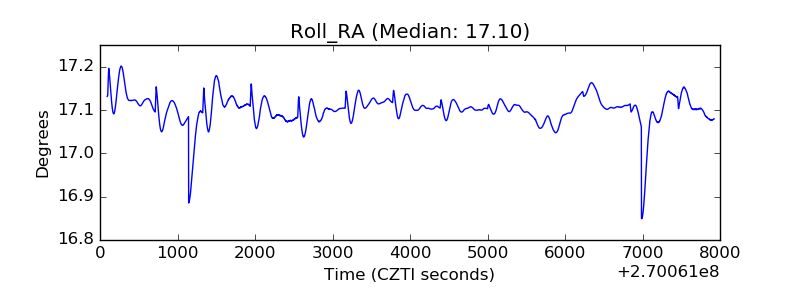 |
| Veto Counter | 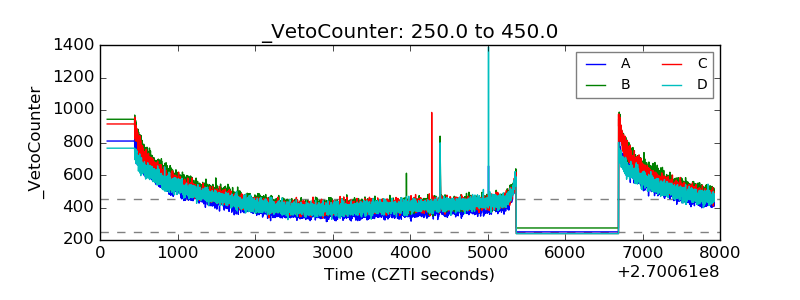 |