| Param | Original file | Final file |
|---|---|---|
| Filename | modeM0/AS1T02_072T01_9000002250_15243cztM0_level2.evt | modeM0/AS1T02_072T01_9000002250_15243cztM0_level2_quad_clean.evt |
| Size (bytes) | 449,939,520 | 126,348,480 |
| Size | 429.1 MB | 120.5 MB |
| Events in quadrant A | 3,141,818 | 851,031 |
| Events in quadrant B | 3,278,916 | 864,475 |
| Events in quadrant C | 3,603,150 | 853,014 |
| Events in quadrant D | 3,170,409 | 814,597 |
| Mode M9 | |||
|---|---|---|---|
| Quadrant | BADHDUFLAG | Total packets | Discarded packets |
| A | 0 | 16 | 0 |
| B | 0 | 16 | 0 |
| C | 0 | 16 | 0 |
| D | 0 | 17 | 0 |
| Mode SS | |||
|---|---|---|---|
| Quadrant | BADHDUFLAG | Total packets | Discarded packets |
| A | 0 | 128 | 0 |
| B | 0 | 128 | 0 |
| C | 0 | 128 | 0 |
| D | 0 | 128 | 0 |
| Mode M0 | |||
|---|---|---|---|
| Quadrant | BADHDUFLAG | Total packets | Discarded packets |
| A | 0 | 13569 | 3 |
| B | 0 | 13878 | 2 |
| C | 0 | 14425 | 2 |
| D | 0 | 13871 | 2 |
| Quadrant | Total seconds | Saturated seconds | Saturation percentage |
|---|---|---|---|
| A | 6365 | 21 | 0.329929% |
| B | 6365 | 82 | 1.288295% |
| C | 6365 | 39 | 0.612726% |
| D | 6365 | 30 | 0.471328% |
Noise dominated data is calculated using 1-second bins in cleaned event files. If a bin has >2000 counts, and if more than 50% of those come from <1% of pixels, then it is considered to be noise-dominated and hence unusable.
| Quadrant | # 1 sec bins | Bins with >0 counts | Bins with >2000 counts | High rate bins dominated by noise | Noise dominated (total time) | Noise dominated (detector-on time) | Marked lightcurve |
|---|---|---|---|---|---|---|---|
| A | 7566 | 6367 | 5 | 5 | 0.07% | 0.08% | 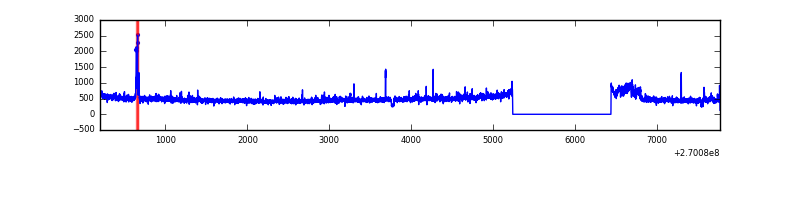 |
| B | 7566 | 6367 | 26 | 26 | 0.34% | 0.41% | 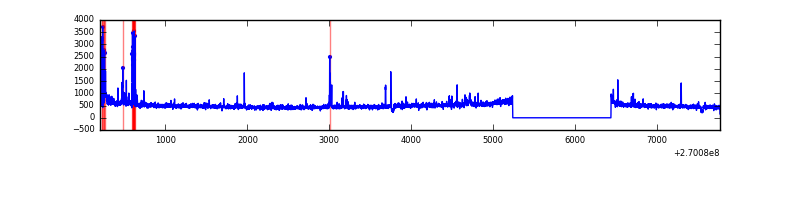 |
| C | 7566 | 6367 | 13 | 13 | 0.17% | 0.20% | 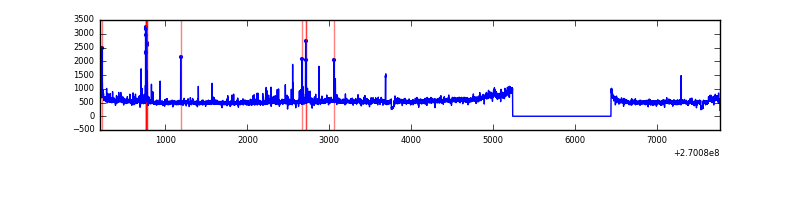 |
| D | 7566 | 6367 | 16 | 16 | 0.21% | 0.25% | 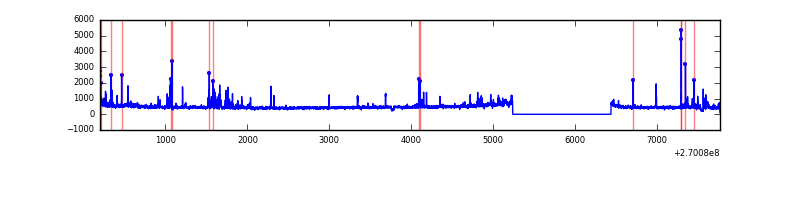 |
Top three noisy pixels from each quadrant. If the there are fewer than three noisy pixels in the level2.evt file, extra rows are filled as -1
| Pixel properties | Quadrant properties | ||||||
|---|---|---|---|---|---|---|---|
| Quadrant | DetID | PixID | Counts | Sigma | Mean | Median | Sigma |
| A | 0 | 253 | 95056 | 621.01 | 758 | 743 | 151.9 |
| A | 12 | 189 | 88656 | 578.87 | 758 | 743 | 151.9 |
| A | 13 | 248 | 36442 | 235.06 | 758 | 743 | 151.9 |
| B | 10 | 16 | 143497 | 1005.4 | 763 | 744 | 142.0 |
| B | 0 | 197 | 25457 | 174.05 | 763 | 744 | 142.0 |
| B | 0 | 189 | 24460 | 167.03 | 763 | 744 | 142.0 |
| C | 3 | 233 | 546169 | 3199.43 | 748 | 752 | 170.5 |
| C | 4 | 254 | 118125 | 688.51 | 748 | 752 | 170.5 |
| C | 7 | 247 | 22263 | 126.18 | 748 | 752 | 170.5 |
| D | 2 | 16 | 101482 | 568.13 | 740 | 717 | 177.4 |
| D | 1 | 255 | 86456 | 483.41 | 740 | 717 | 177.4 |
| D | 2 | 136 | 54656 | 304.12 | 740 | 717 | 177.4 |
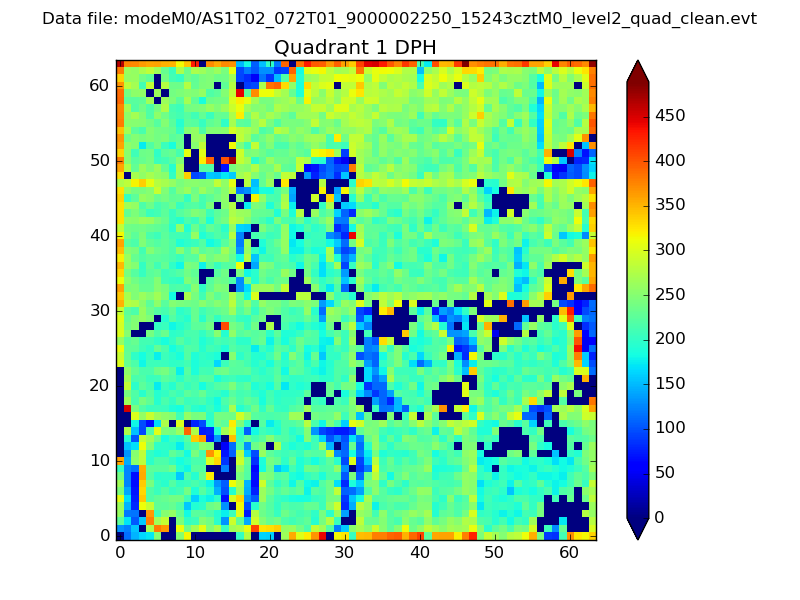
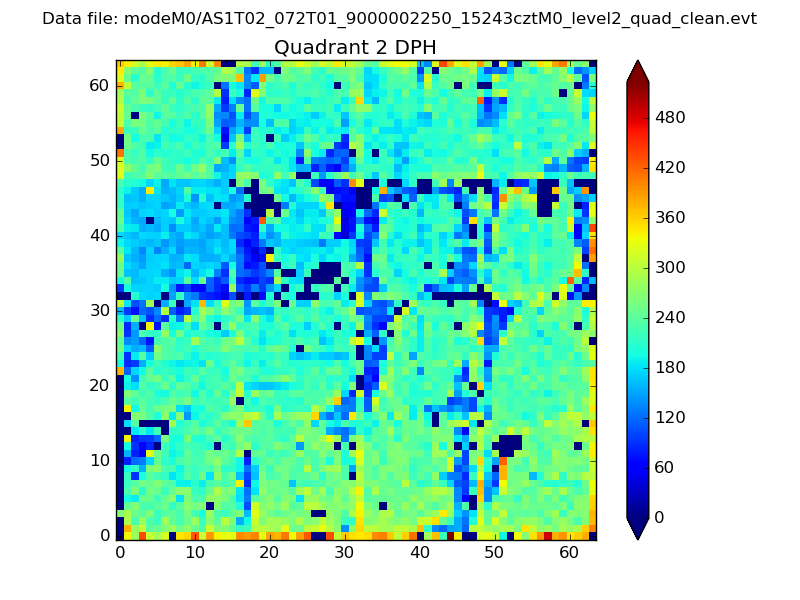
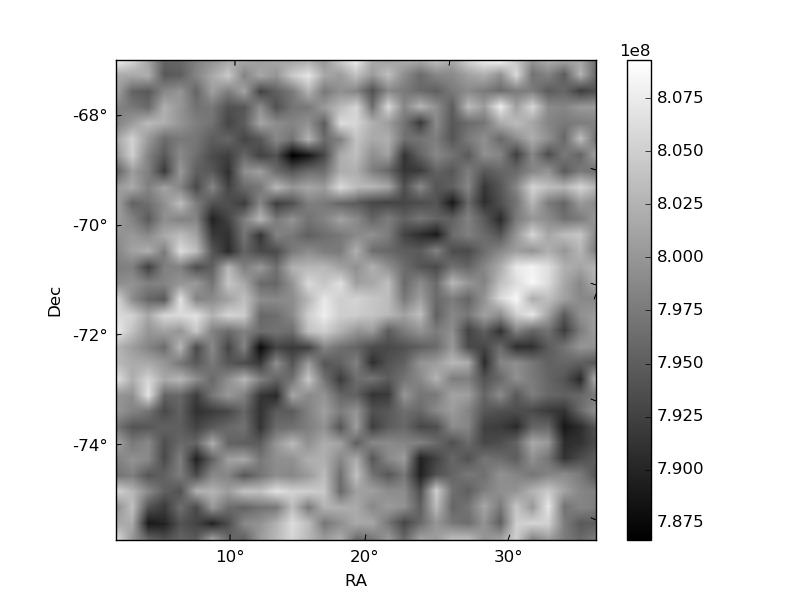
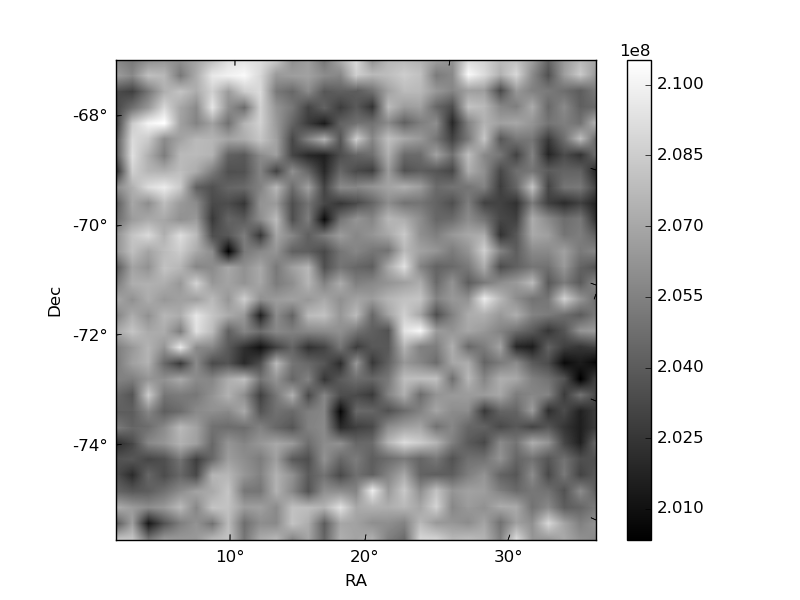
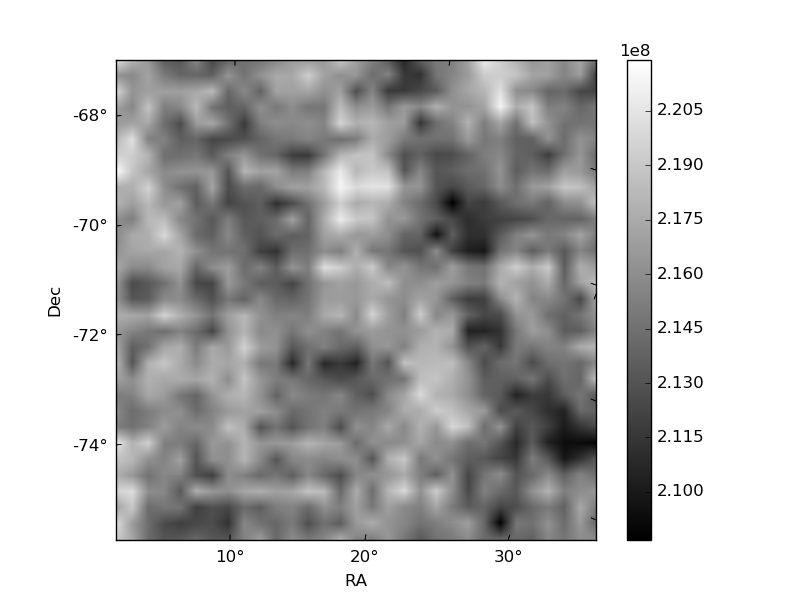
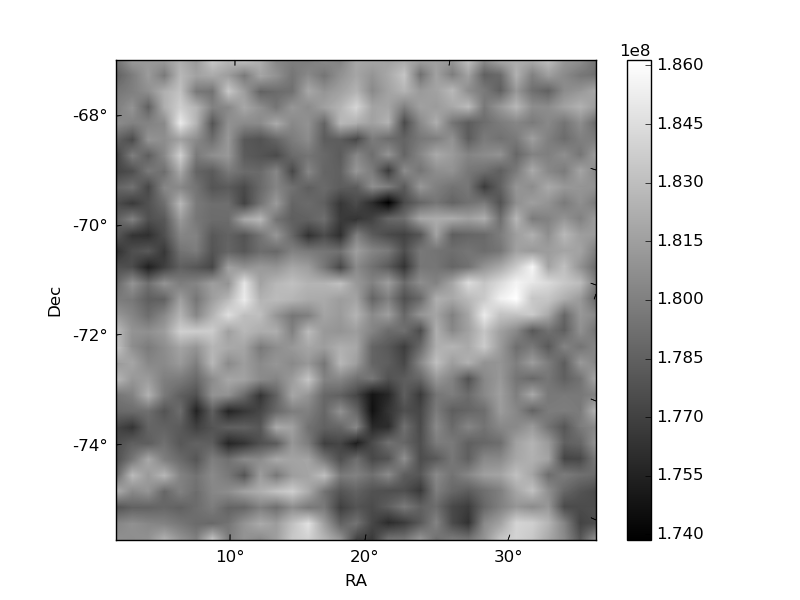
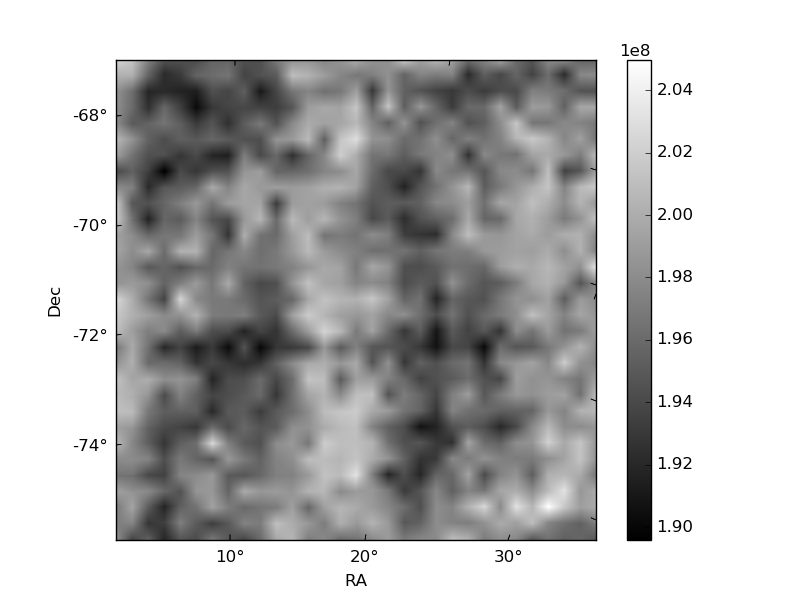
Histogram calculated using DETX and DETY for each event in the final _common_clean file
| Quadrant A |  |
 |
Quadrant B |
|---|---|---|---|
| Quadrant D | 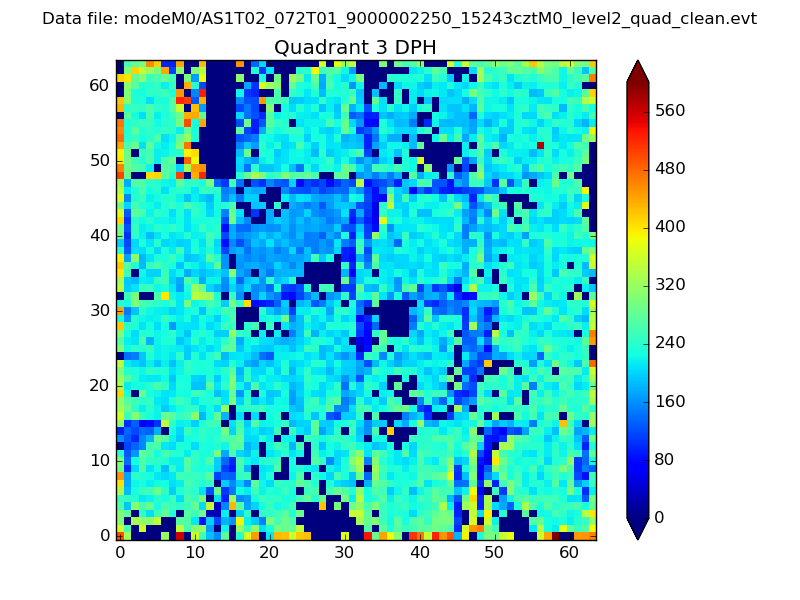 |
 |
Quadrant C |
| Plot type | Count rate plots | Images |
|---|---|---|
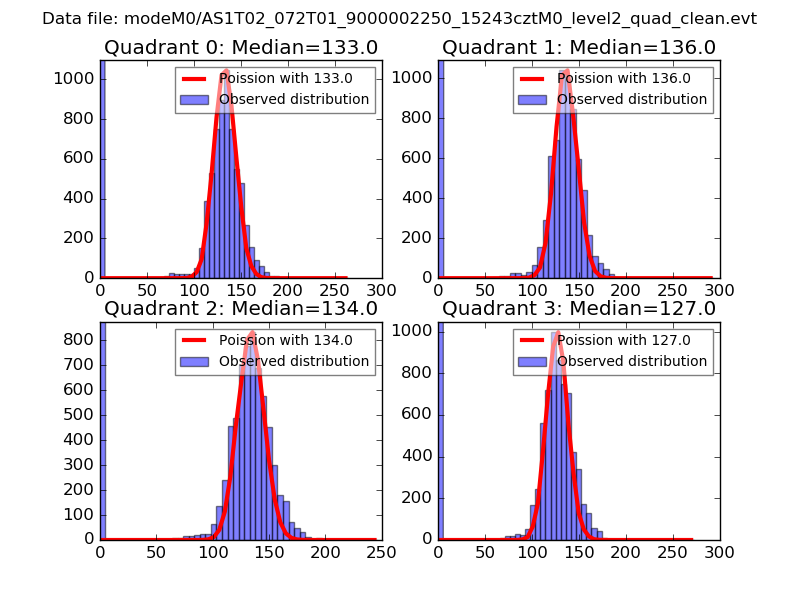
| Comparison with Poisson distribution Blue bars denote a histogram of data divided into 1 sec bins. Red curve is a Poisson curve with rate = median count rate of data. |
 |
 |
| Quadrant-wise count rates Data is divided into 100 sec bins |
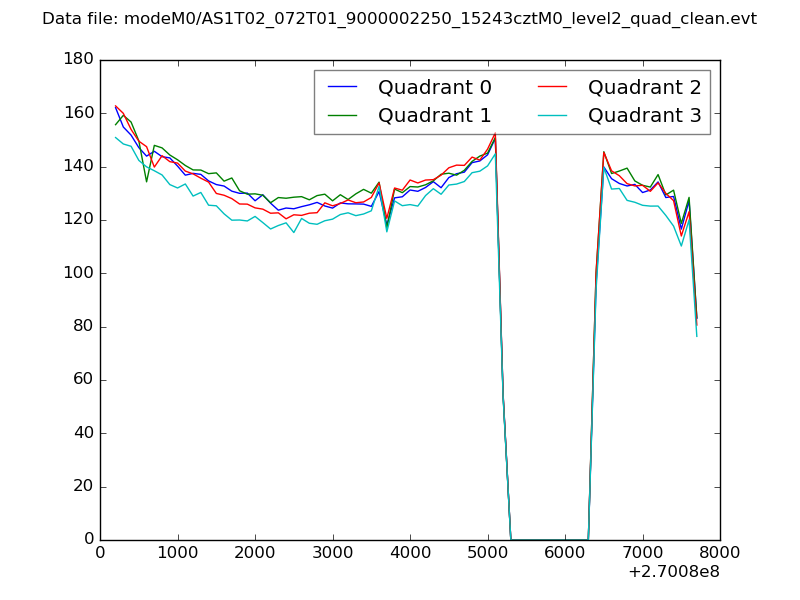 |
|
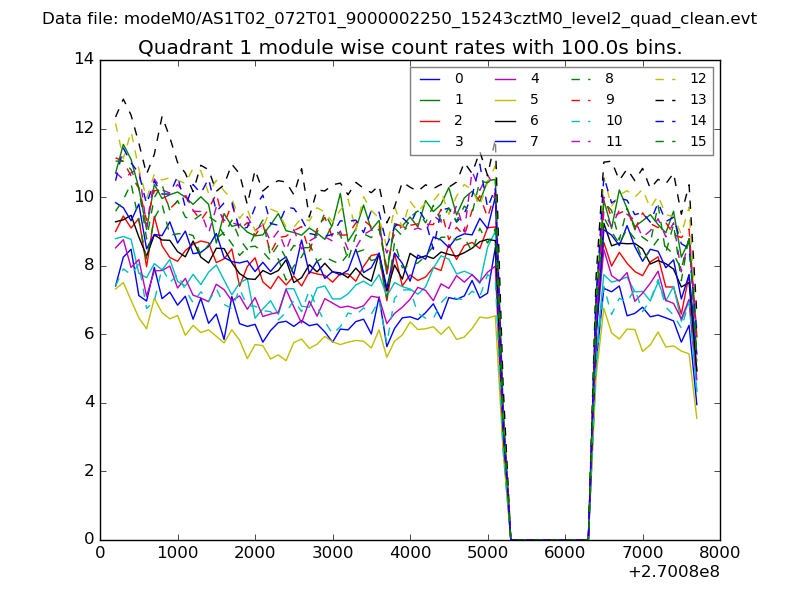
| Module-wise count rates for Quadrant A Data is divided into 100 sec bins |
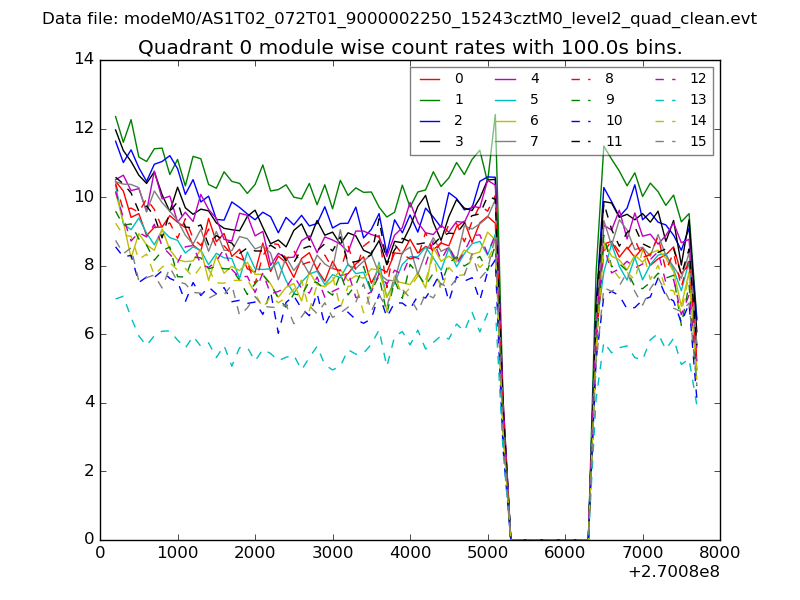 |
 |
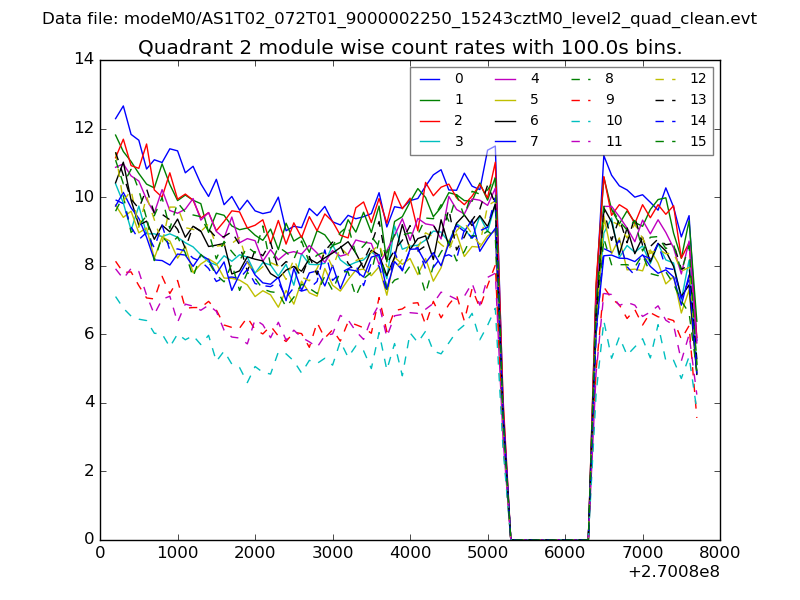
| Module-wise count rates for Quadrant B Data is divided into 100 sec bins |
 |
 |
| Module-wise count rates for Quadrant C Data is divided into 100 sec bins |
 |
 |
| Module-wise count rates for Quadrant D Data is divided into 100 sec bins |
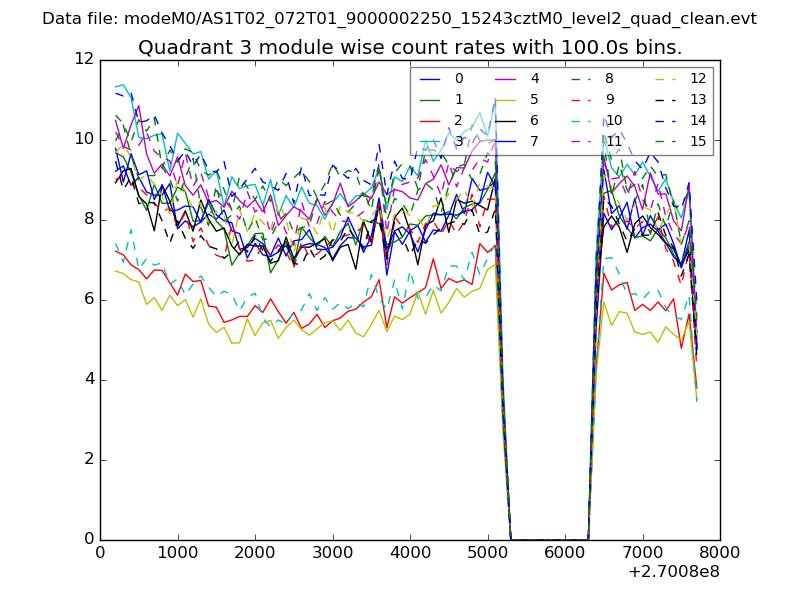 |
 |
| Parameter | Plot |
|---|---|
| CZT HV Monitor | 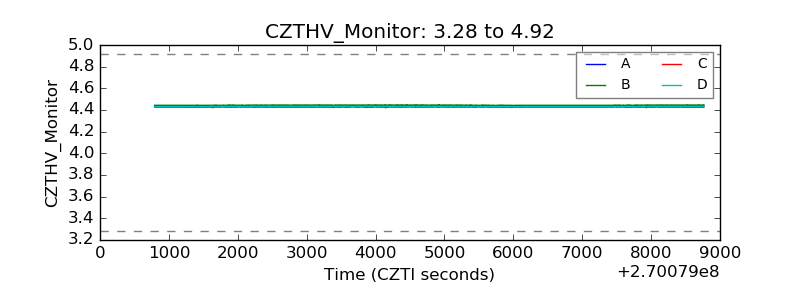 |
| D_VDD | 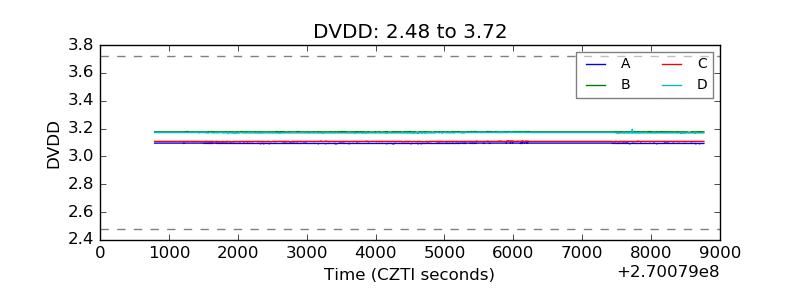 |
| Temperature 1 | 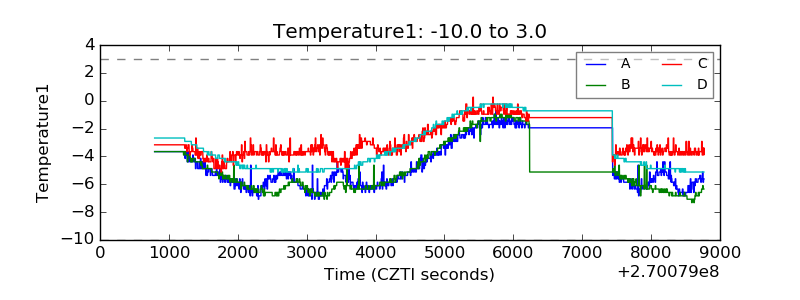 |
| Veto HV Monitor |  |
| Veto LLD | 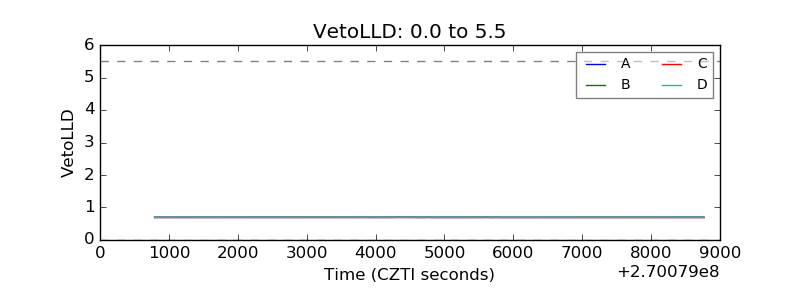 |
| Alpha Counter | 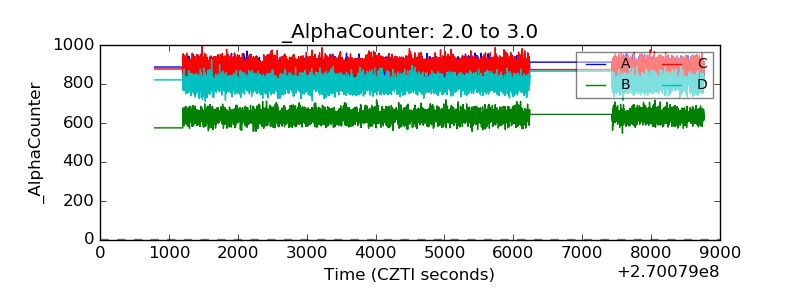 |
| _CPM_Rate | 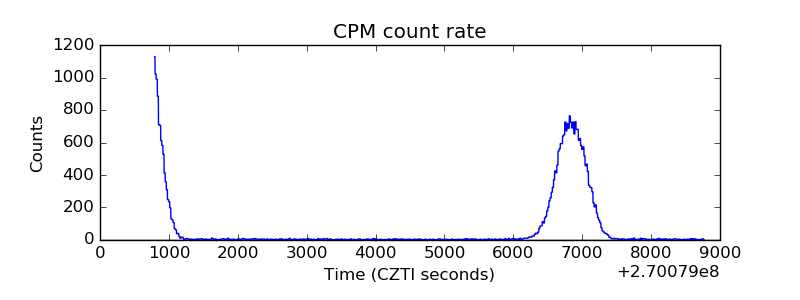 |
| CZT Counter | 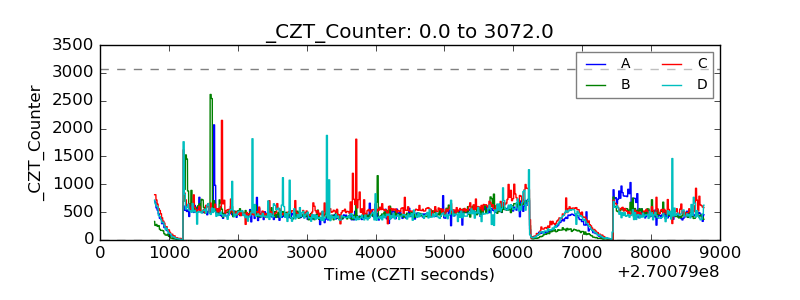 |
| +2.5 Volts monitor |  |
| +5 Volts monitor | 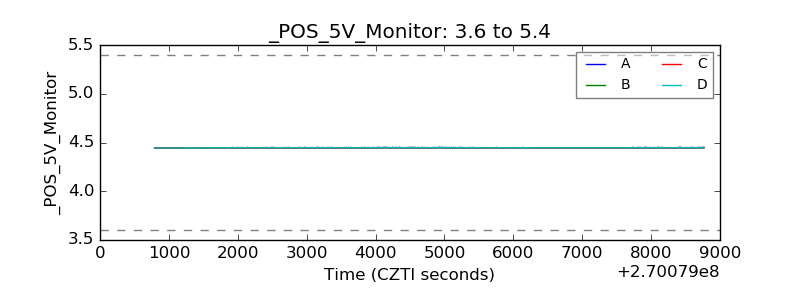 |
| _ROLL_ROT | 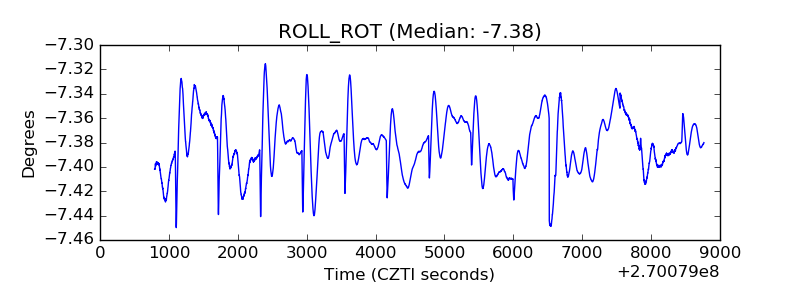 |
| _Roll_DEC | 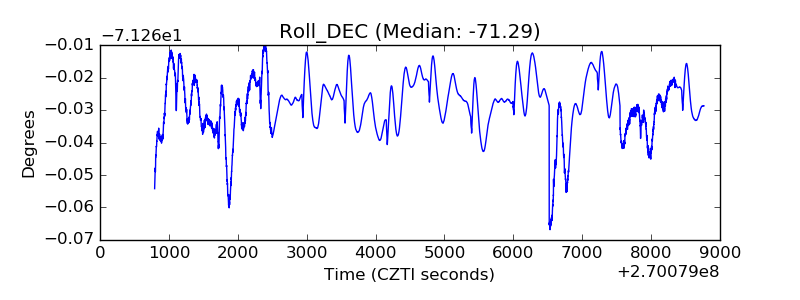 |
| _Roll_RA |  |
| Veto Counter | 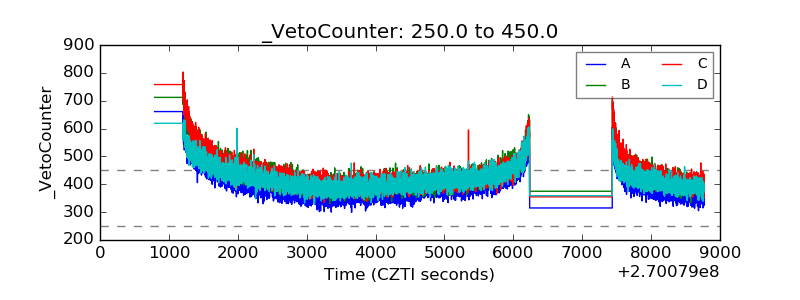 |