| Param | Original file | Final file |
|---|---|---|
| Filename | modeM0/AS1T02_072T01_9000002250_15245cztM0_level2.evt | modeM0/AS1T02_072T01_9000002250_15245cztM0_level2_quad_clean.evt |
| Size (bytes) | 693,648,000 | 146,528,640 |
| Size | 661.5 MB | 139.7 MB |
| Events in quadrant A | 4,141,500 | 995,365 |
| Events in quadrant B | 4,082,305 | 1,012,200 |
| Events in quadrant C | 8,327,597 | 903,497 |
| Events in quadrant D | 3,909,444 | 965,824 |
| Mode M9 | |||
|---|---|---|---|
| Quadrant | BADHDUFLAG | Total packets | Discarded packets |
| A | 0 | 12 | 0 |
| B | 0 | 12 | 0 |
| C | 0 | 12 | 0 |
| D | 0 | 12 | 0 |
| Mode SS | |||
|---|---|---|---|
| Quadrant | BADHDUFLAG | Total packets | Discarded packets |
| A | 0 | 166 | 0 |
| B | 0 | 166 | 0 |
| C | 0 | 166 | 0 |
| D | 0 | 166 | 0 |
| Mode M0 | |||
|---|---|---|---|
| Quadrant | BADHDUFLAG | Total packets | Discarded packets |
| A | 0 | 17283 | 3 |
| B | 0 | 17503 | 2 |
| C | 0 | 30254 | 2 |
| D | 0 | 17316 | 2 |
| Quadrant | Total seconds | Saturated seconds | Saturation percentage |
|---|---|---|---|
| A | 8059 | 63 | 0.781735% |
| B | 8059 | 134 | 1.662737% |
| C | 8059 | 1741 | 21.603177% |
| D | 8059 | 107 | 1.327708% |
Noise dominated data is calculated using 1-second bins in cleaned event files. If a bin has >2000 counts, and if more than 50% of those come from <1% of pixels, then it is considered to be noise-dominated and hence unusable.
| Quadrant | # 1 sec bins | Bins with >0 counts | Bins with >2000 counts | High rate bins dominated by noise | Noise dominated (total time) | Noise dominated (detector-on time) | Marked lightcurve |
|---|---|---|---|---|---|---|---|
| A | 9295 | 8061 | 4 | 4 | 0.04% | 0.05% | 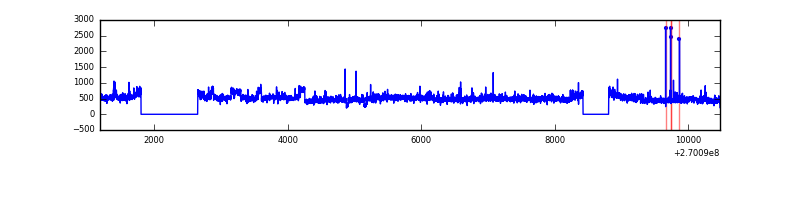 |
| B | 9295 | 8062 | 11 | 11 | 0.12% | 0.14% | 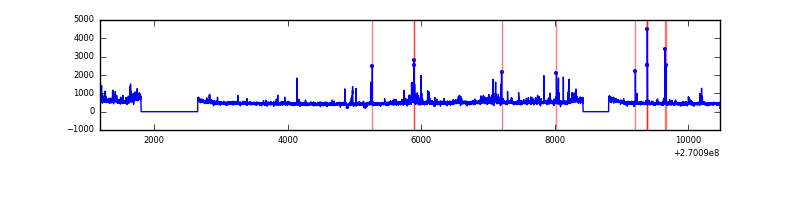 |
| C | 9295 | 8062 | 1181 | 1181 | 12.71% | 14.65% | 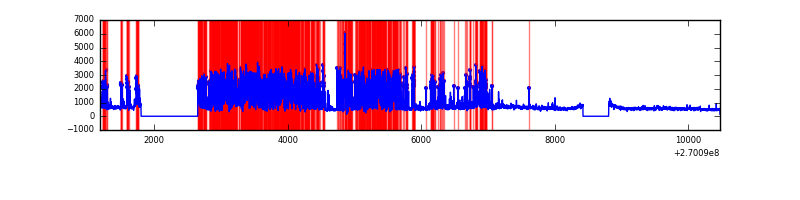 |
| D | 9295 | 8062 | 33 | 33 | 0.36% | 0.41% | 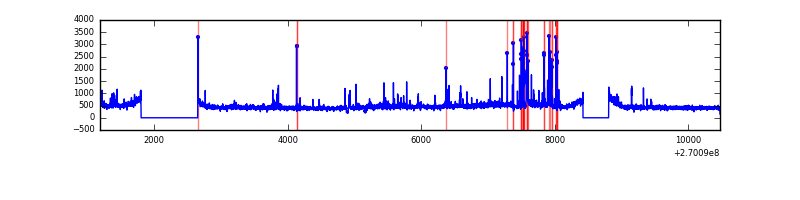 |
Top three noisy pixels from each quadrant. If the there are fewer than three noisy pixels in the level2.evt file, extra rows are filled as -1
| Pixel properties | Quadrant properties | ||||||
|---|---|---|---|---|---|---|---|
| Quadrant | DetID | PixID | Counts | Sigma | Mean | Median | Sigma |
| A | 0 | 253 | 357724 | 1870.54 | 941 | 919 | 190.7 |
| A | 12 | 189 | 131376 | 683.91 | 941 | 919 | 190.7 |
| A | 9 | 143 | 24285 | 122.49 | 941 | 919 | 190.7 |
| B | 10 | 16 | 115008 | 641.47 | 947 | 921 | 177.9 |
| B | 0 | 189 | 69344 | 384.72 | 947 | 921 | 177.9 |
| B | 3 | 64 | 51997 | 287.18 | 947 | 921 | 177.9 |
| C | 4 | 254 | 4161575 | 21388.68 | 851 | 855 | 194.5 |
| C | 3 | 233 | 841577 | 4321.83 | 851 | 855 | 194.5 |
| C | 4 | 238 | 6844 | 30.79 | 851 | 855 | 194.5 |
| D | 7 | 38 | 143510 | 640.49 | 920 | 891 | 222.7 |
| D | 2 | 16 | 89981 | 400.1 | 920 | 891 | 222.7 |
| D | 9 | 68 | 62193 | 275.3 | 920 | 891 | 222.7 |
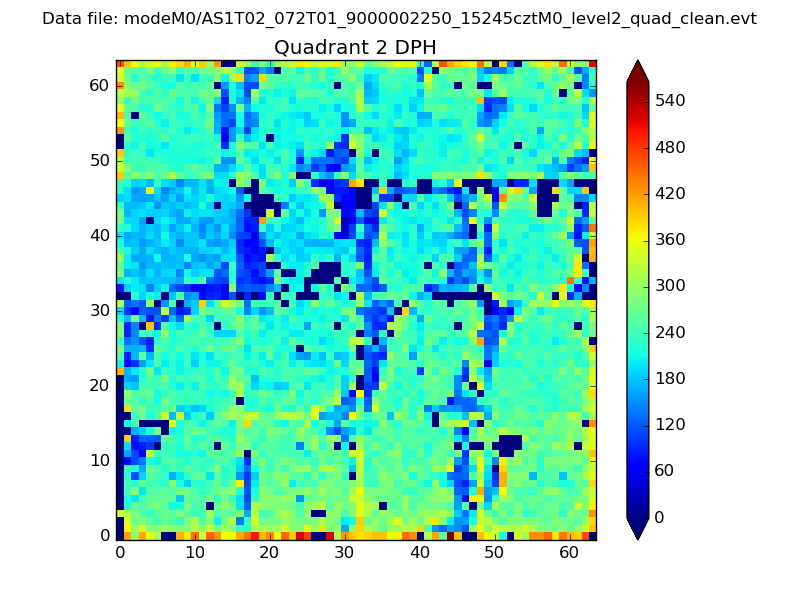
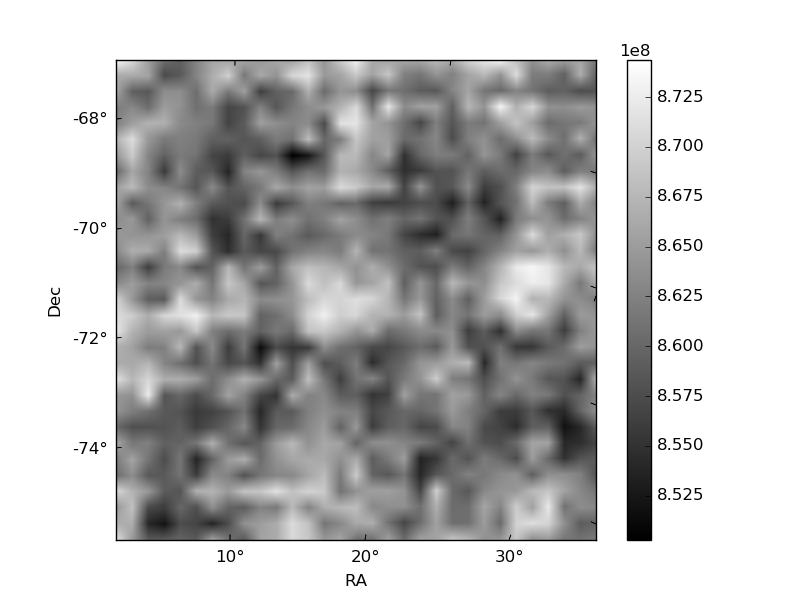
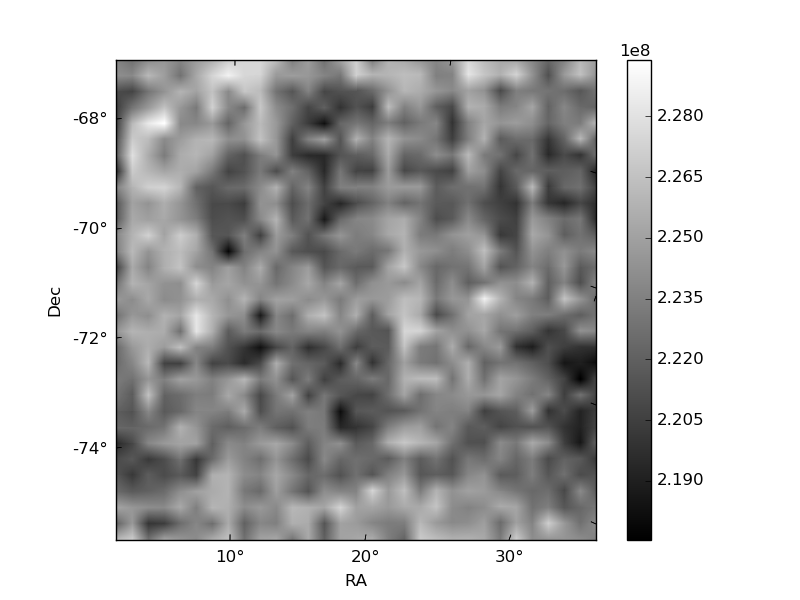
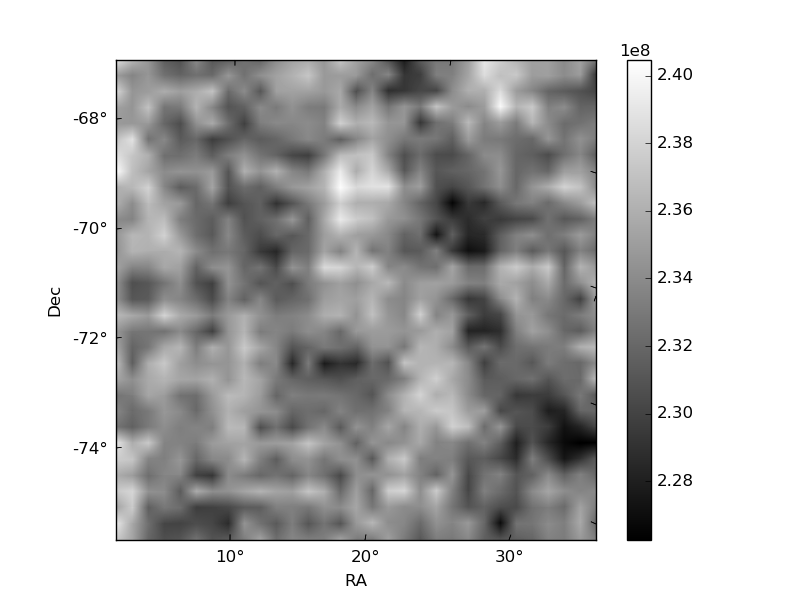
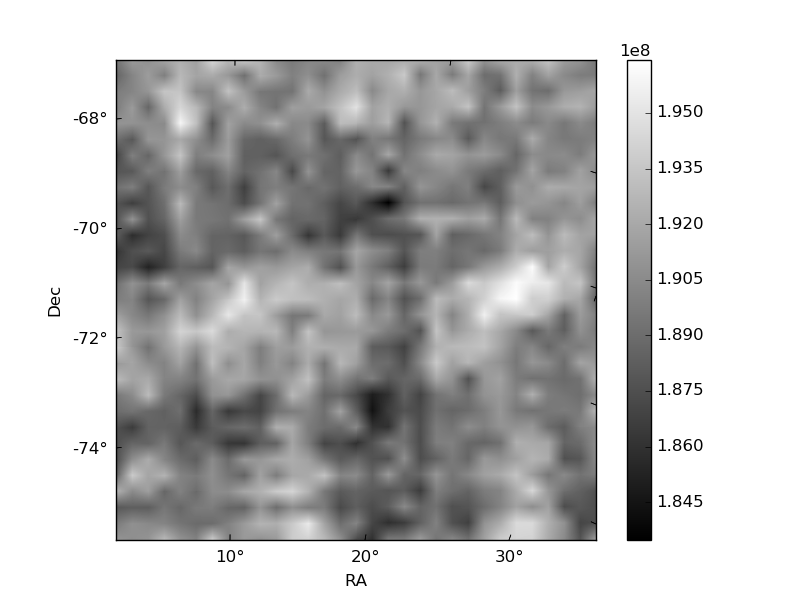
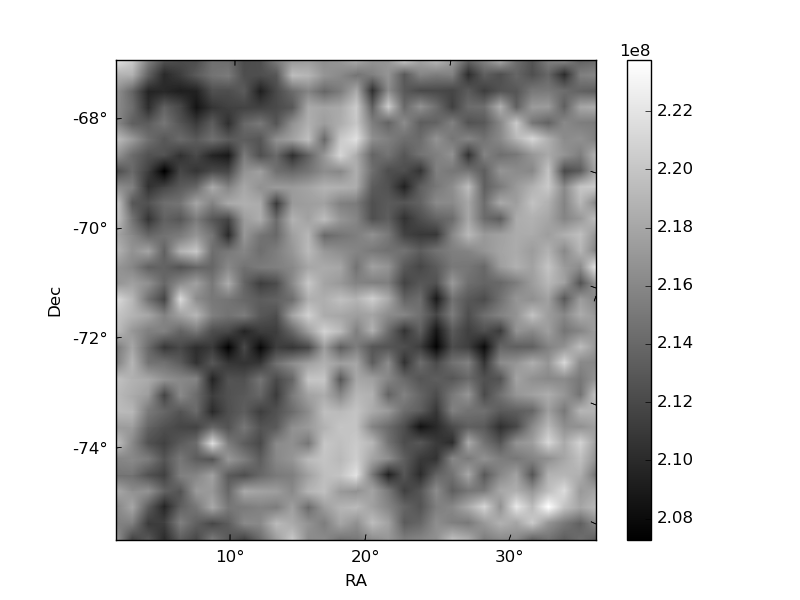
Histogram calculated using DETX and DETY for each event in the final _common_clean file
| Quadrant A | 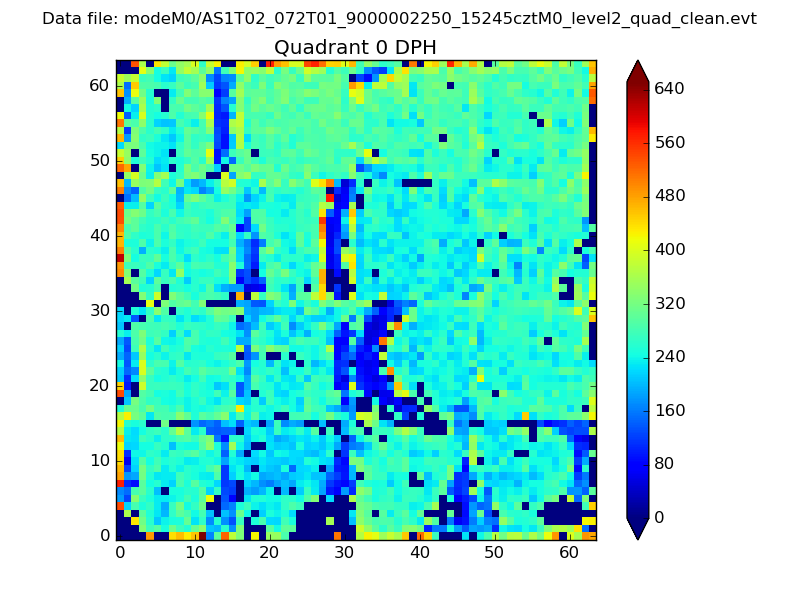 |
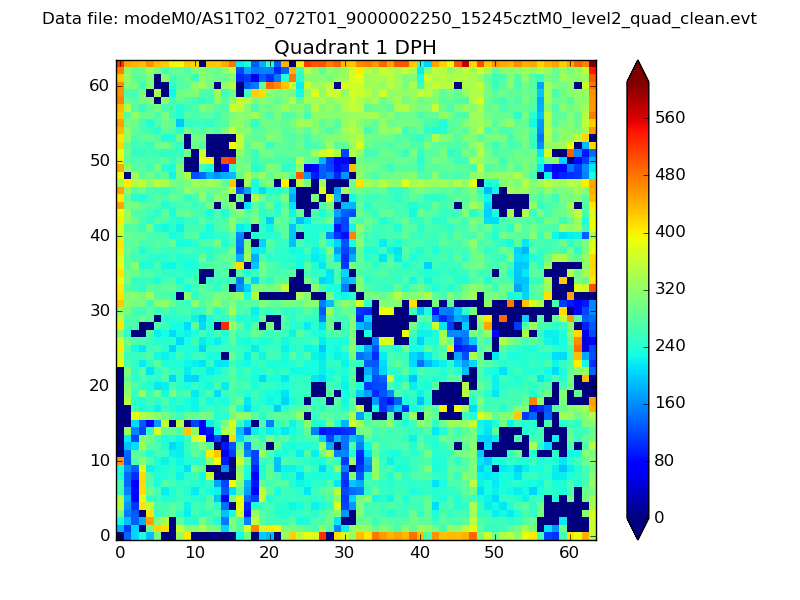 |
Quadrant B |
|---|---|---|---|
| Quadrant D | 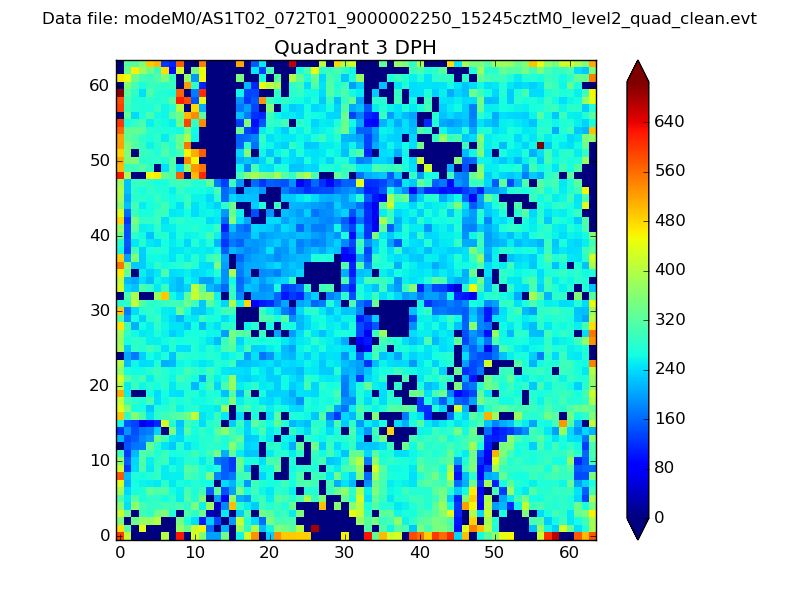 |
 |
Quadrant C |
| Plot type | Count rate plots | Images |
|---|---|---|
| Comparison with Poisson distribution Blue bars denote a histogram of data divided into 1 sec bins. Red curve is a Poisson curve with rate = median count rate of data. |
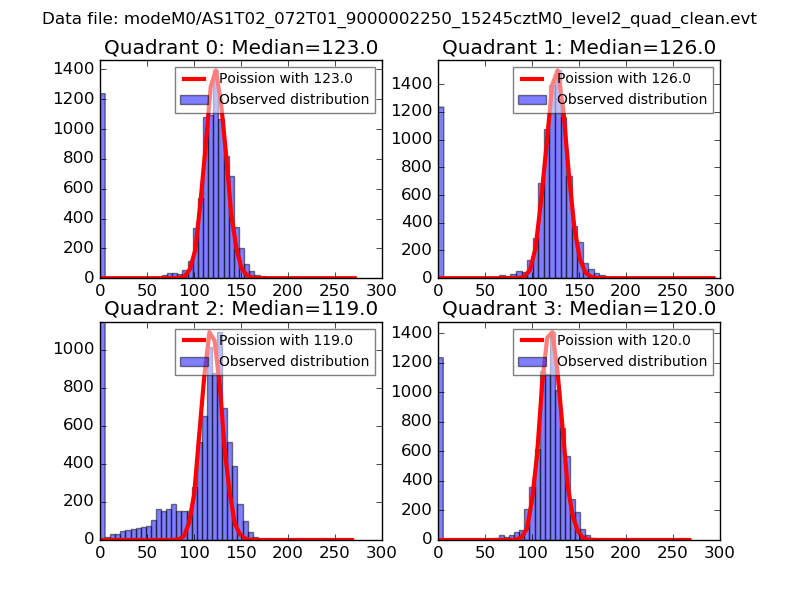 |
 |
| Quadrant-wise count rates Data is divided into 100 sec bins |
 |
|
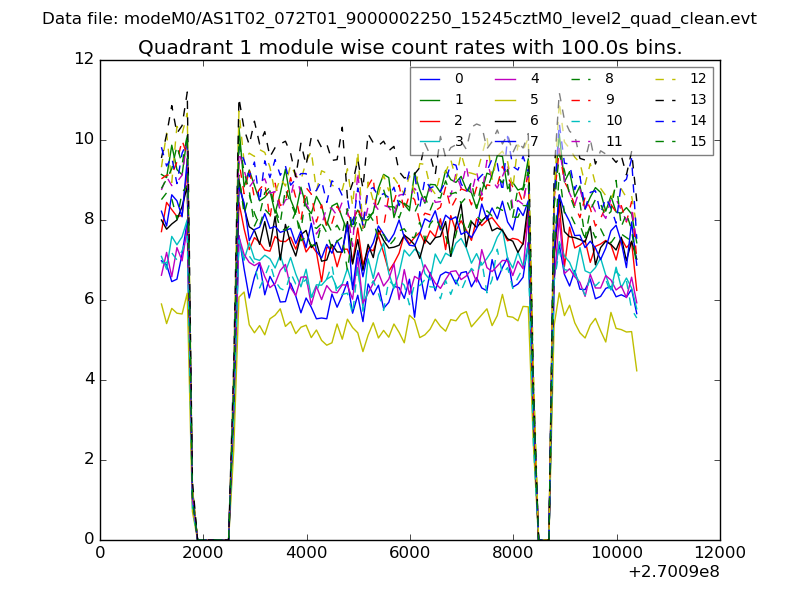
| Module-wise count rates for Quadrant A Data is divided into 100 sec bins |
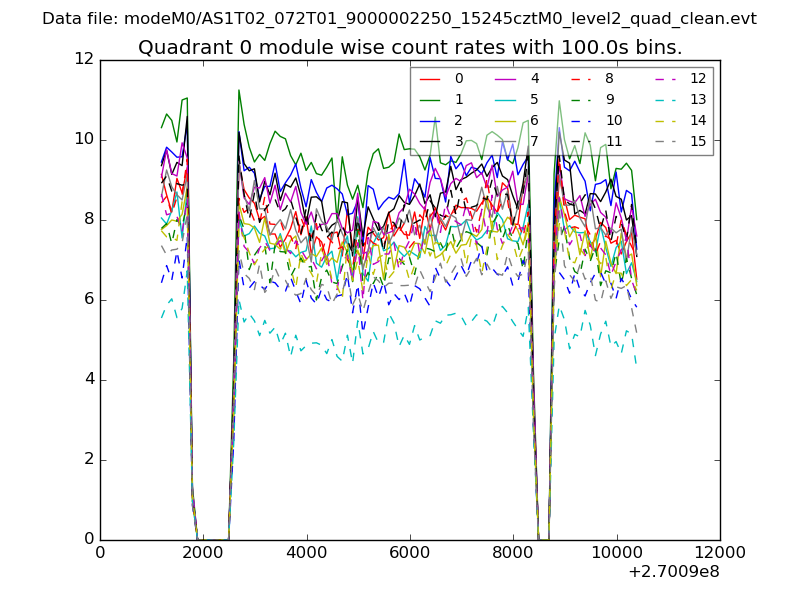 |
 |
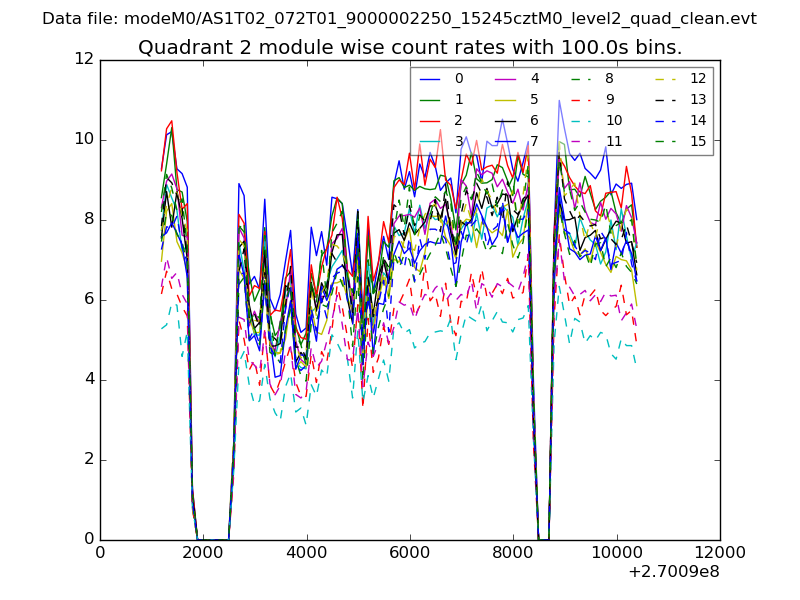
| Module-wise count rates for Quadrant B Data is divided into 100 sec bins |
 |
 |
| Module-wise count rates for Quadrant C Data is divided into 100 sec bins |
 |
 |
| Module-wise count rates for Quadrant D Data is divided into 100 sec bins |
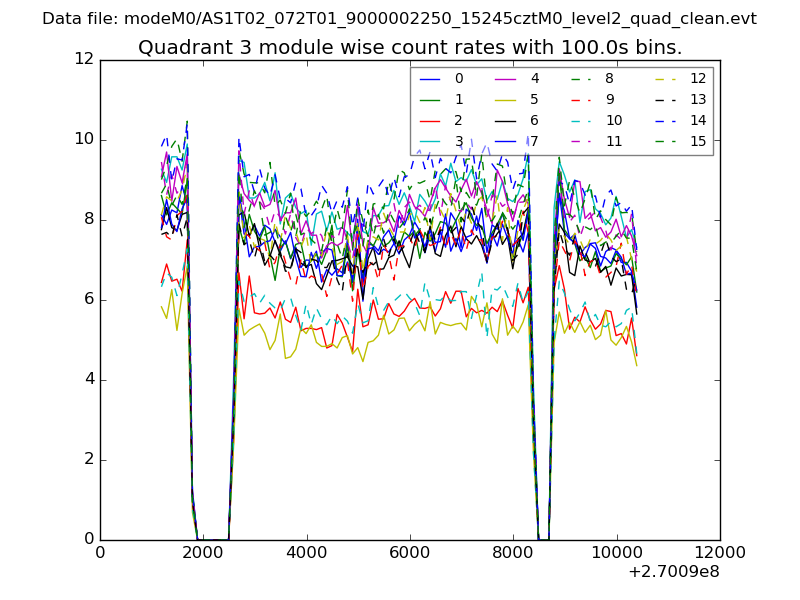 |
 |
| Parameter | Plot |
|---|---|
| CZT HV Monitor | 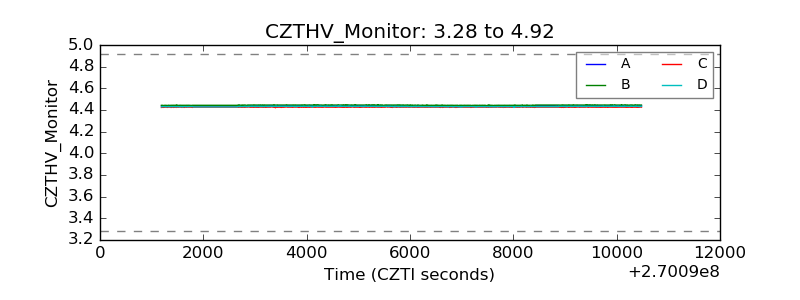 |
| D_VDD | 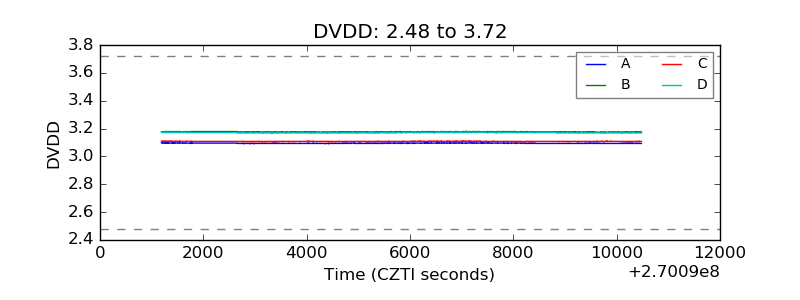 |
| Temperature 1 | 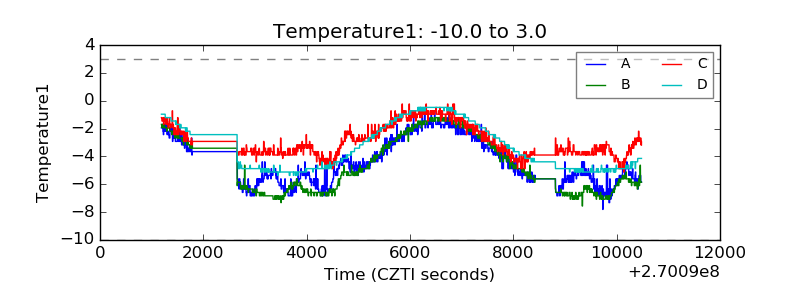 |
| Veto HV Monitor |  |
| Veto LLD | 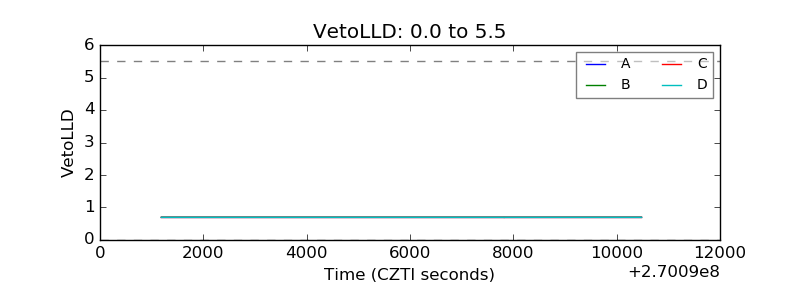 |
| Alpha Counter | 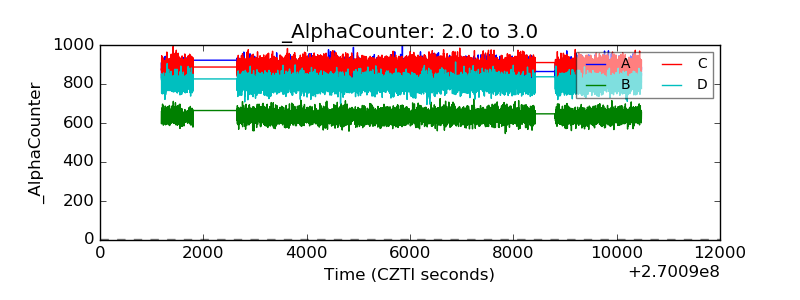 |
| _CPM_Rate | 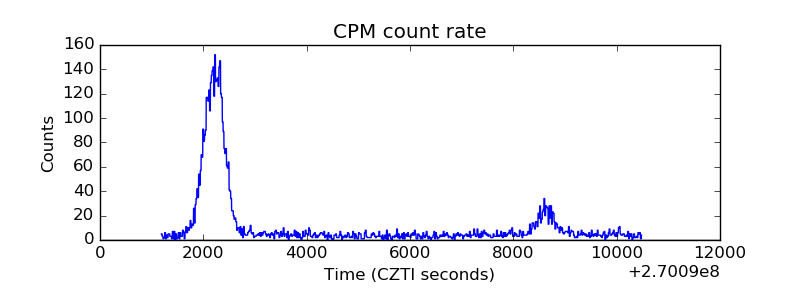 |
| CZT Counter | 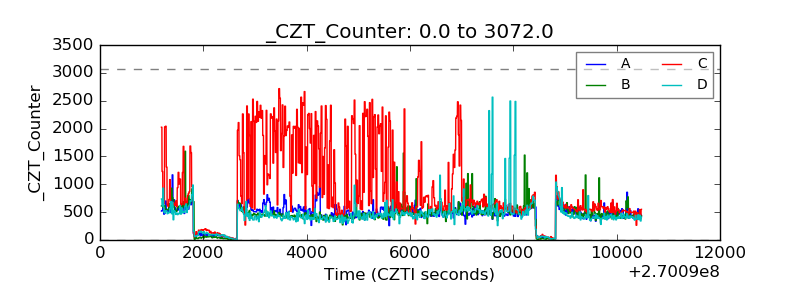 |
| +2.5 Volts monitor |  |
| +5 Volts monitor |  |
| _ROLL_ROT | 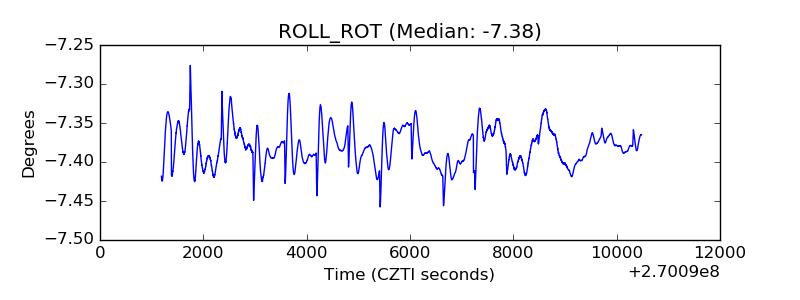 |
| _Roll_DEC | 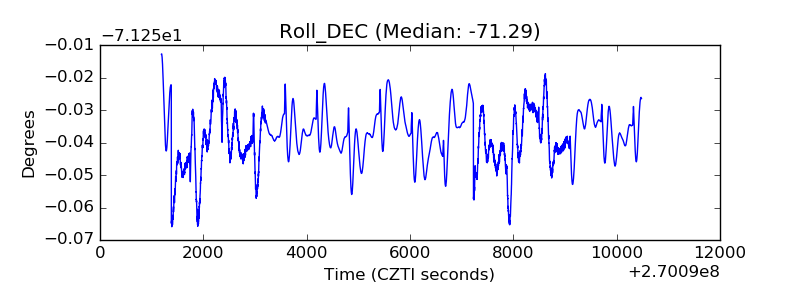 |
| _Roll_RA | 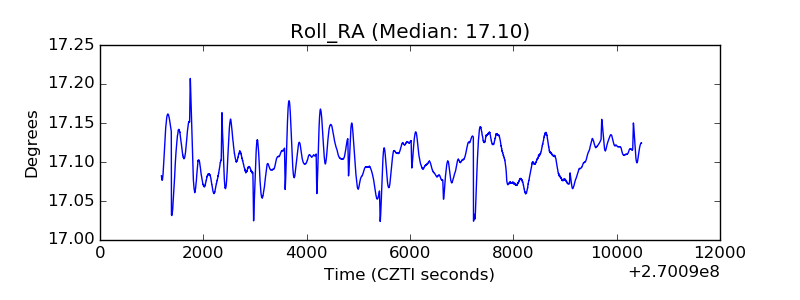 |
| Veto Counter | 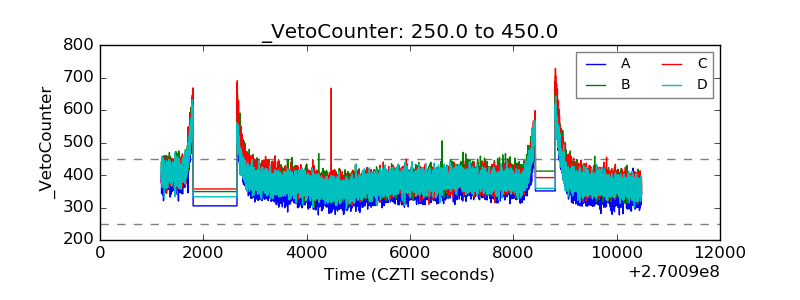 |