| Param | Original file | Final file |
|---|---|---|
| Filename | modeM0/AS1T02_072T01_9000002250_15246cztM0_level2.evt | modeM0/AS1T02_072T01_9000002250_15246cztM0_level2_quad_clean.evt |
| Size (bytes) | 535,265,280 | 137,393,280 |
| Size | 510.5 MB | 131.0 MB |
| Events in quadrant A | 3,613,456 | 914,372 |
| Events in quadrant B | 3,873,582 | 926,571 |
| Events in quadrant C | 4,767,707 | 906,099 |
| Events in quadrant D | 3,440,703 | 886,376 |
| Mode M9 | |||
|---|---|---|---|
| Quadrant | BADHDUFLAG | Total packets | Discarded packets |
| A | 0 | 1 | 0 |
| B | 0 | 1 | 0 |
| C | 0 | 1 | 0 |
| D | 0 | 1 | 0 |
| Mode SS | |||
|---|---|---|---|
| Quadrant | BADHDUFLAG | Total packets | Discarded packets |
| A | 0 | 156 | 0 |
| B | 0 | 156 | 0 |
| C | 0 | 156 | 0 |
| D | 0 | 156 | 0 |
| Mode M0 | |||
|---|---|---|---|
| Quadrant | BADHDUFLAG | Total packets | Discarded packets |
| A | 0 | 15764 | 3 |
| B | 0 | 16496 | 2 |
| C | 0 | 18943 | 2 |
| D | 0 | 15786 | 2 |
| Quadrant | Total seconds | Saturated seconds | Saturation percentage |
|---|---|---|---|
| A | 7581 | 98 | 1.292705% |
| B | 7581 | 201 | 2.651365% |
| C | 7581 | 275 | 3.627490% |
| D | 7581 | 102 | 1.345469% |
Noise dominated data is calculated using 1-second bins in cleaned event files. If a bin has >2000 counts, and if more than 50% of those come from <1% of pixels, then it is considered to be noise-dominated and hence unusable.
| Quadrant | # 1 sec bins | Bins with >0 counts | Bins with >2000 counts | High rate bins dominated by noise | Noise dominated (total time) | Noise dominated (detector-on time) | Marked lightcurve |
|---|---|---|---|---|---|---|---|
| A | 7762 | 7573 | 5 | 5 | 0.06% | 0.07% | 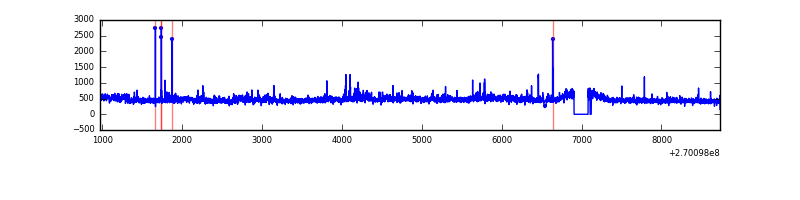 |
| B | 7762 | 7573 | 39 | 39 | 0.50% | 0.51% | 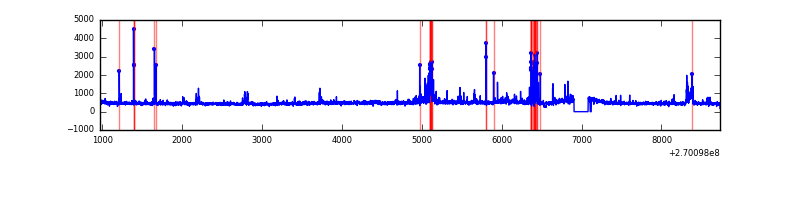 |
| C | 7762 | 7573 | 99 | 99 | 1.28% | 1.31% | 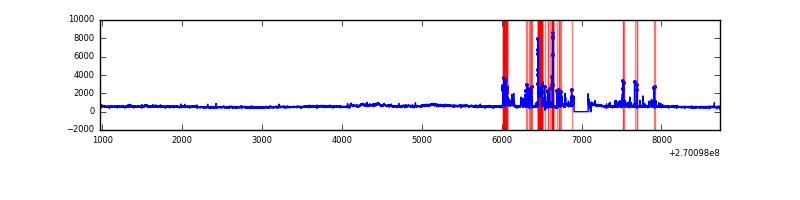 |
| D | 7762 | 7573 | 23 | 23 | 0.30% | 0.30% | 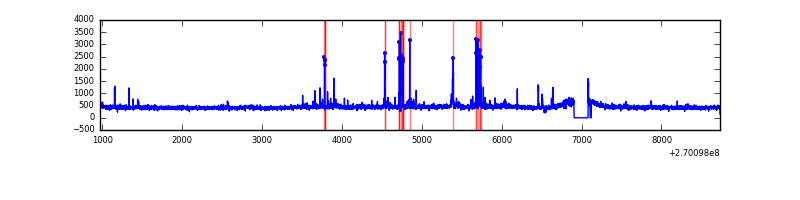 |
Top three noisy pixels from each quadrant. If the there are fewer than three noisy pixels in the level2.evt file, extra rows are filled as -1
| Pixel properties | Quadrant properties | ||||||
|---|---|---|---|---|---|---|---|
| Quadrant | DetID | PixID | Counts | Sigma | Mean | Median | Sigma |
| A | 12 | 189 | 180066 | 1009.76 | 870 | 850 | 177.5 |
| A | 0 | 253 | 52376 | 290.31 | 870 | 850 | 177.5 |
| A | 9 | 143 | 27909 | 152.46 | 870 | 850 | 177.5 |
| B | 10 | 16 | 163625 | 988.28 | 874 | 849 | 164.7 |
| B | 0 | 197 | 98031 | 590.03 | 874 | 849 | 164.7 |
| B | 0 | 189 | 72939 | 437.69 | 874 | 849 | 164.7 |
| C | 3 | 233 | 901837 | 4632.51 | 844 | 847 | 194.5 |
| C | 4 | 254 | 564154 | 2896.29 | 844 | 847 | 194.5 |
| C | 13 | 61 | 6173 | 27.38 | 844 | 847 | 194.5 |
| D | 7 | 38 | 80091 | 380.89 | 853 | 826 | 208.1 |
| D | 2 | 33 | 40994 | 193.02 | 853 | 826 | 208.1 |
| D | 2 | 16 | 38548 | 181.26 | 853 | 826 | 208.1 |
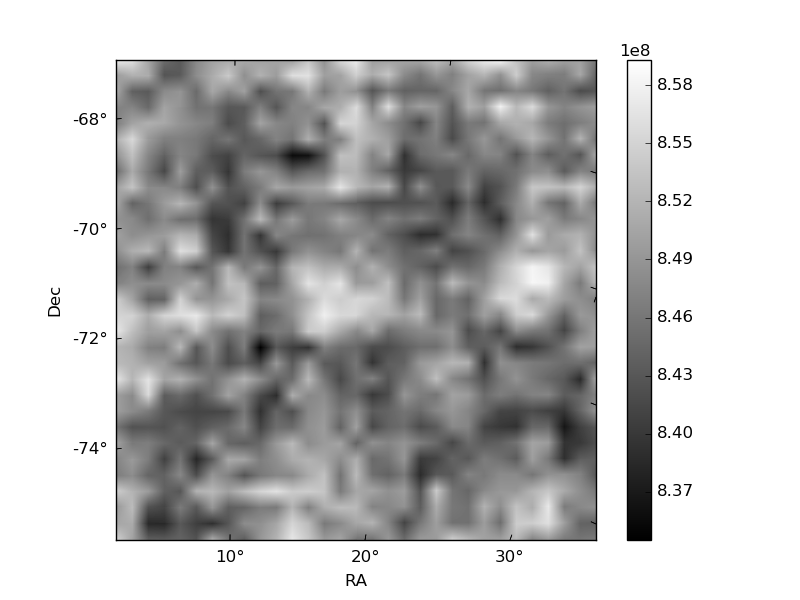
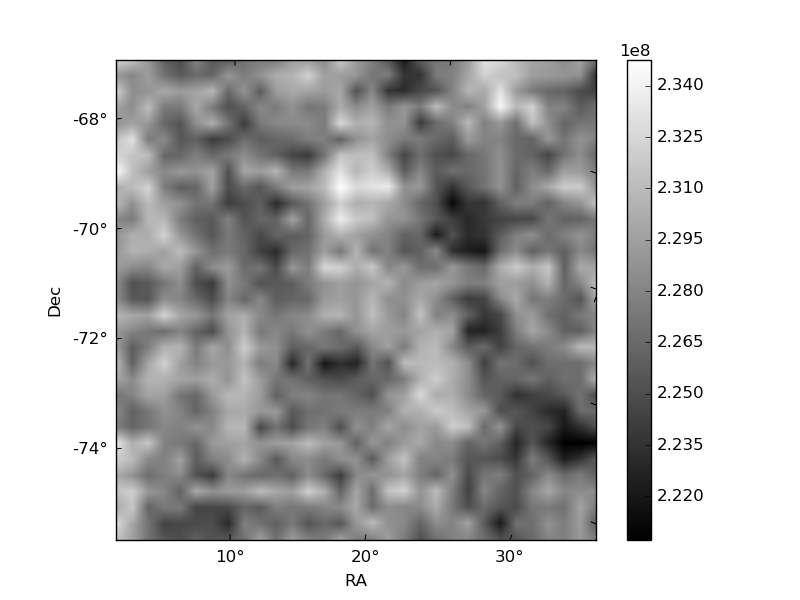
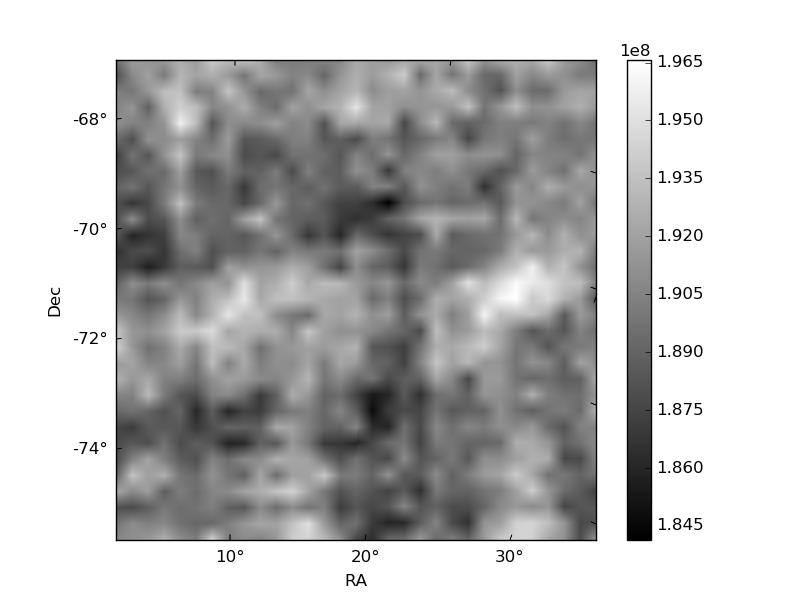
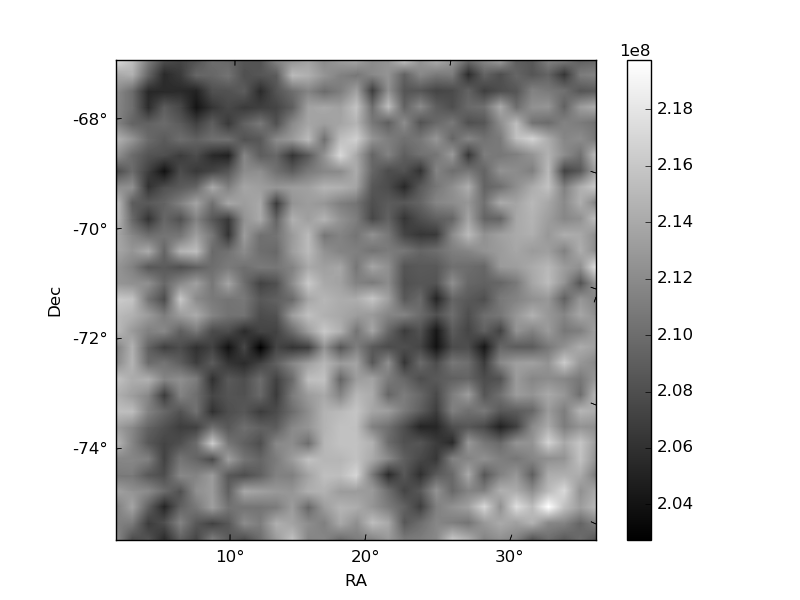
Histogram calculated using DETX and DETY for each event in the final _common_clean file
| Quadrant A | 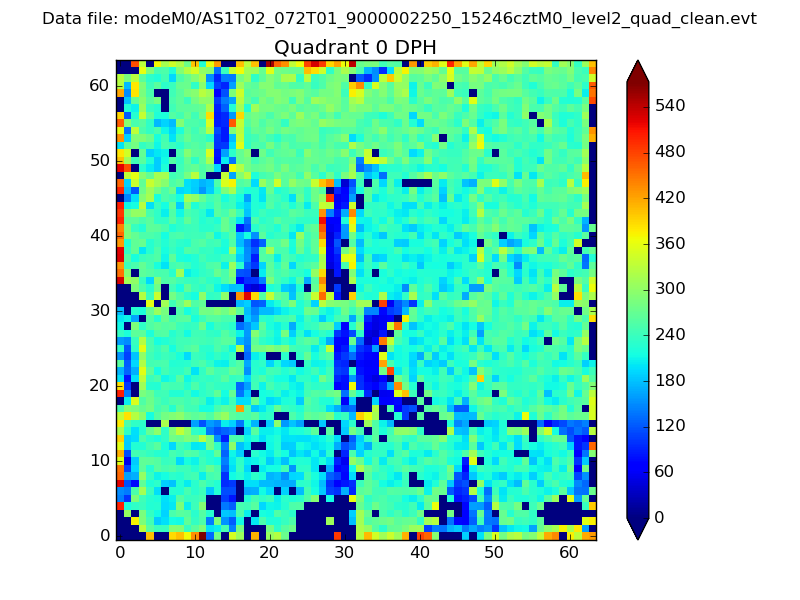 |
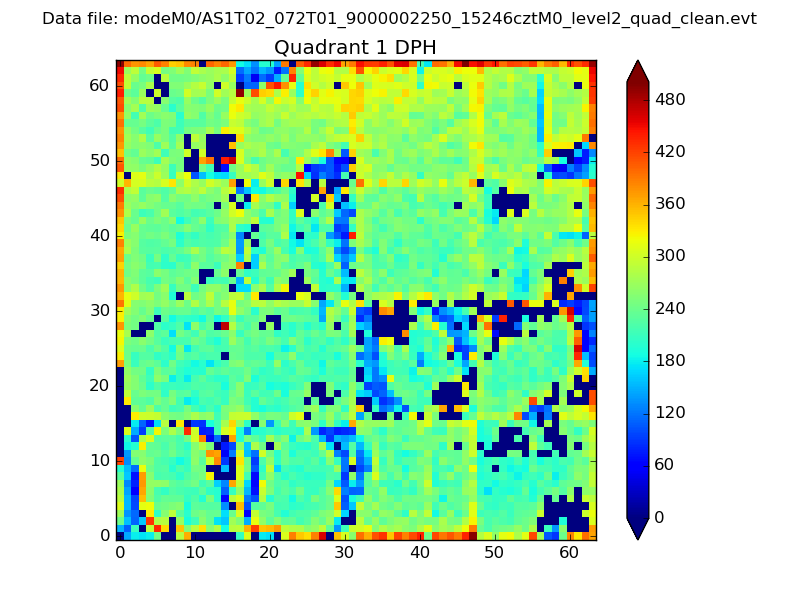 |
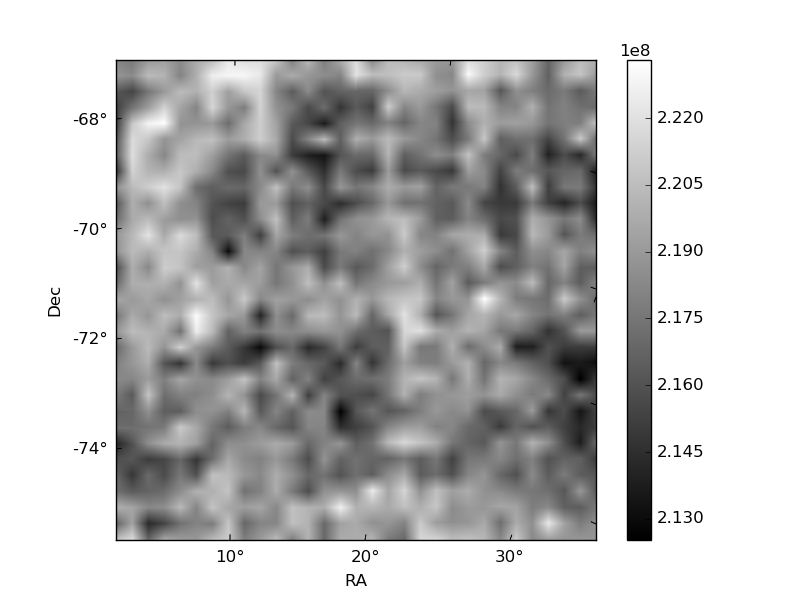
Quadrant B |
|---|---|---|---|
| Quadrant D | 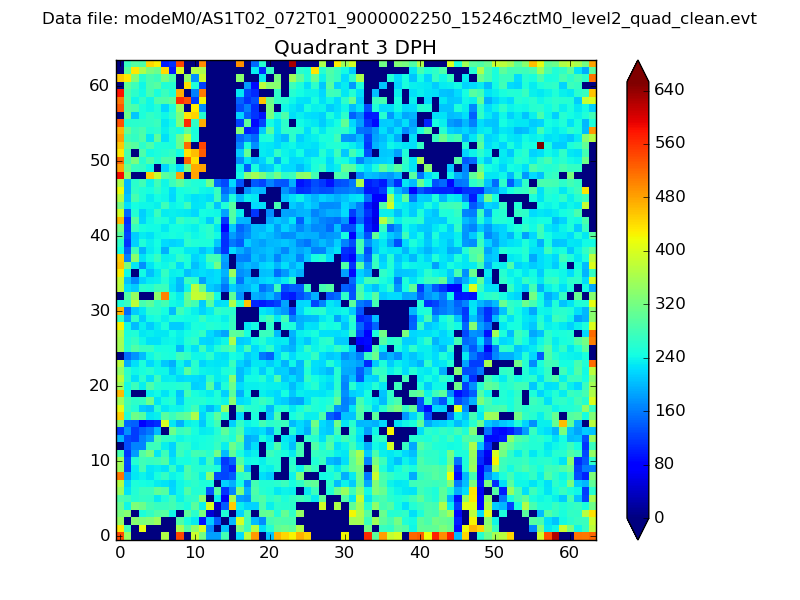 |
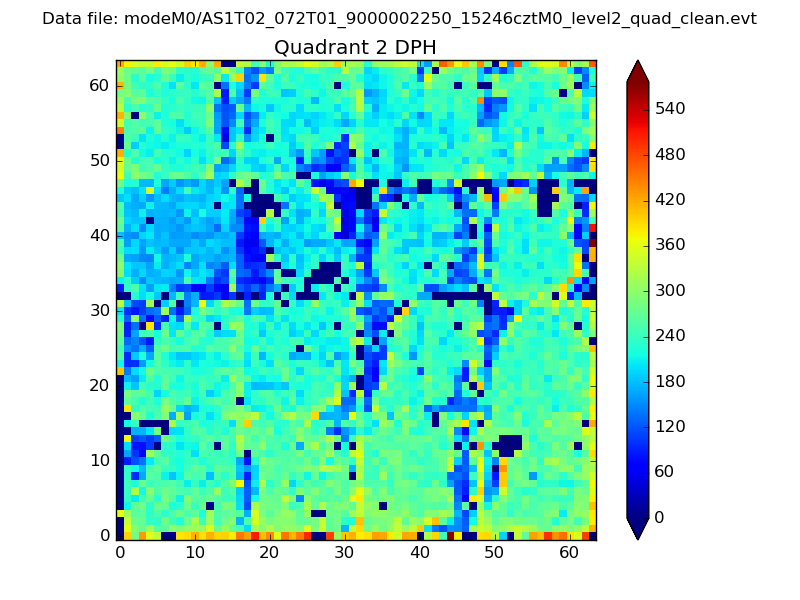 |
Quadrant C |
| Plot type | Count rate plots | Images |
|---|---|---|
| Comparison with Poisson distribution Blue bars denote a histogram of data divided into 1 sec bins. Red curve is a Poisson curve with rate = median count rate of data. |
 |
 |
| Quadrant-wise count rates Data is divided into 100 sec bins |
 |
|
| Module-wise count rates for Quadrant A Data is divided into 100 sec bins |
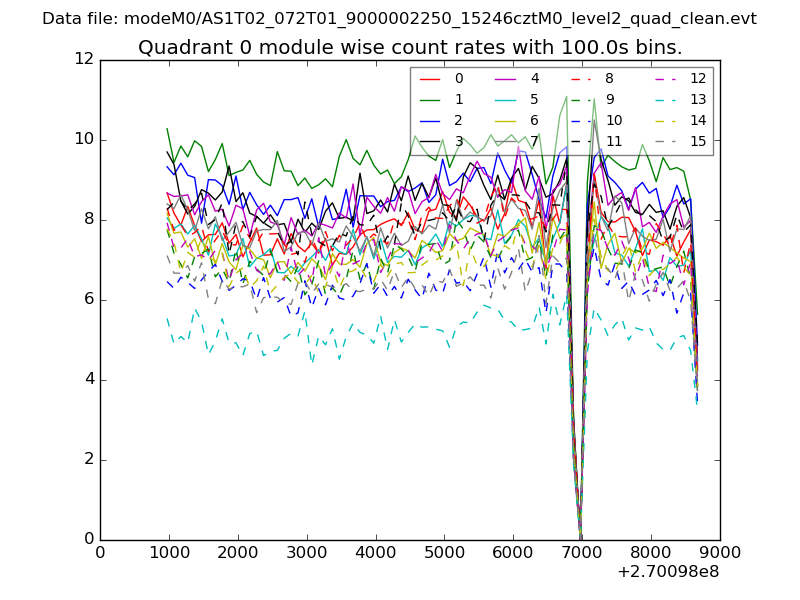 |
 |
| Module-wise count rates for Quadrant B Data is divided into 100 sec bins |
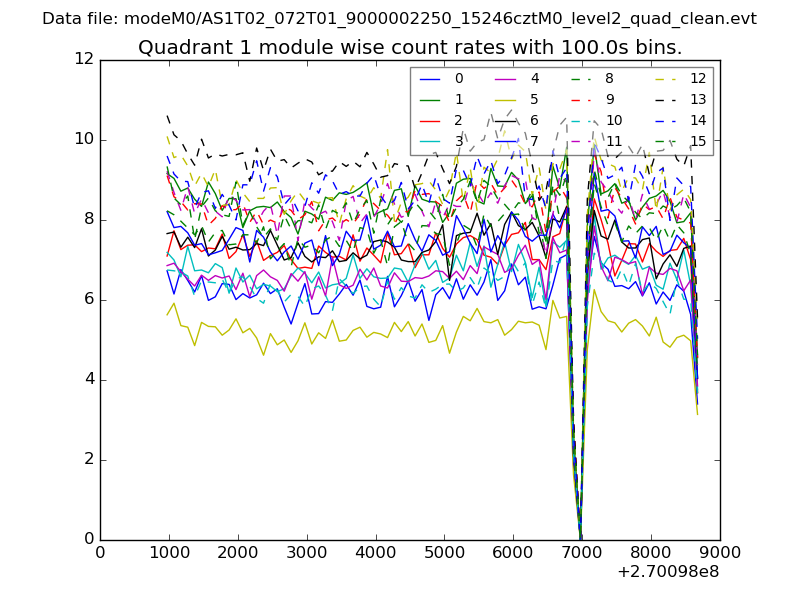 |
 |
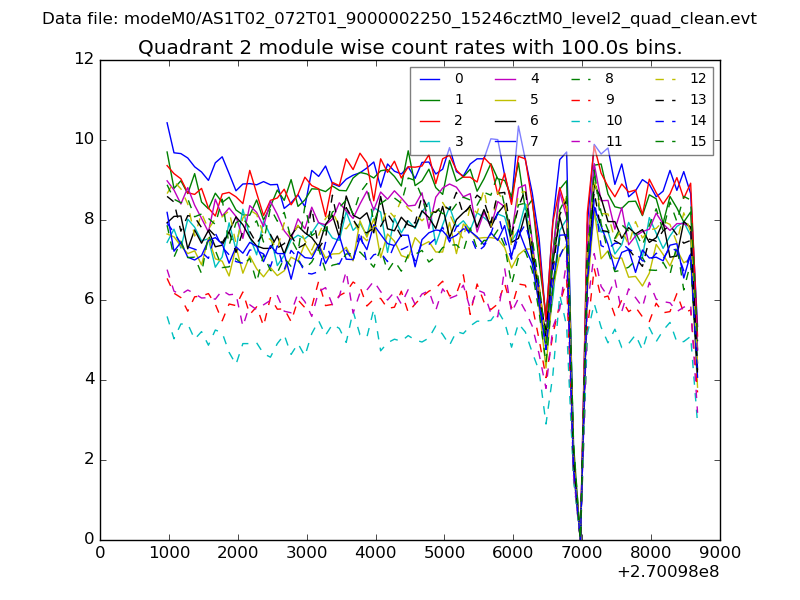
| Module-wise count rates for Quadrant C Data is divided into 100 sec bins |
 |
 |
| Module-wise count rates for Quadrant D Data is divided into 100 sec bins |
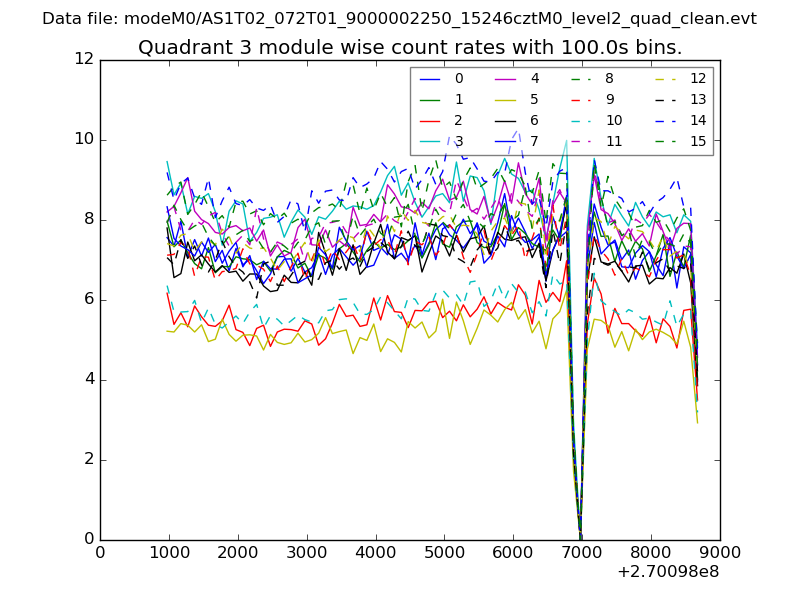 |
 |
| Parameter | Plot |
|---|---|
| CZT HV Monitor | 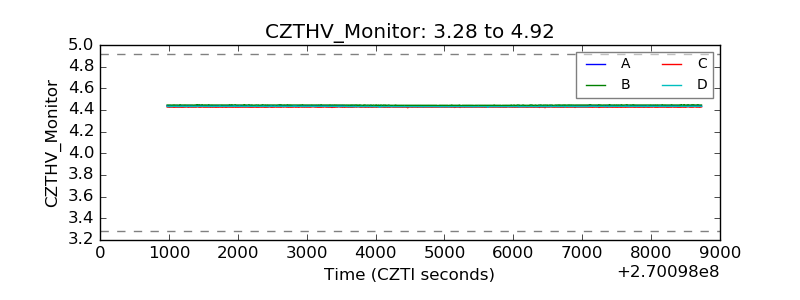 |
| D_VDD | 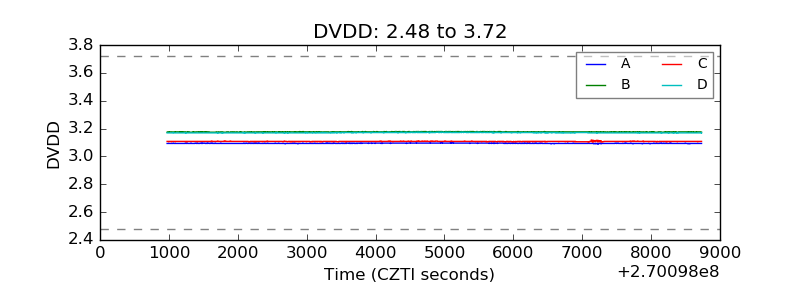 |
| Temperature 1 | 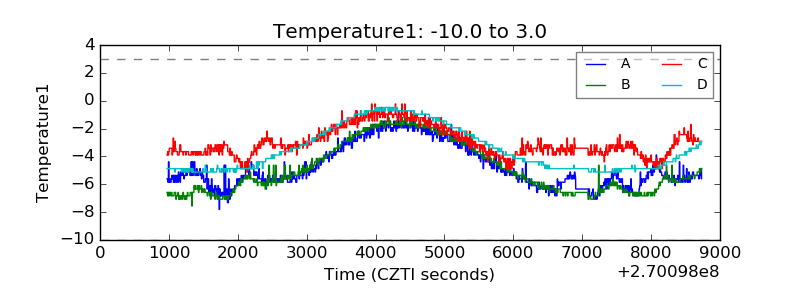 |
| Veto HV Monitor | 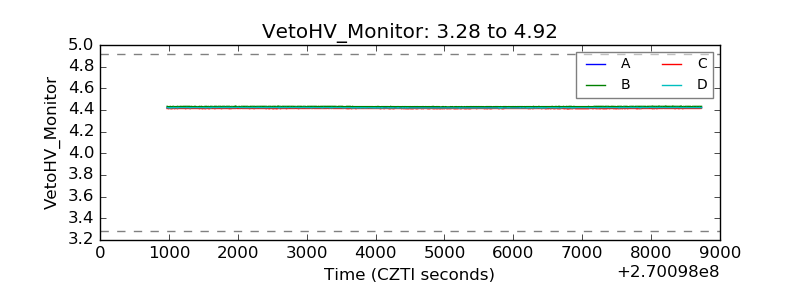 |
| Veto LLD | 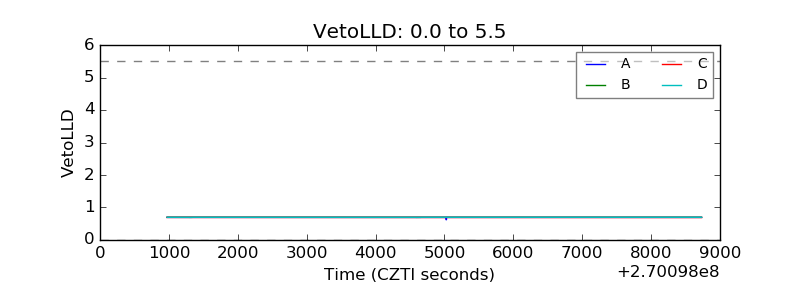 |
| Alpha Counter | 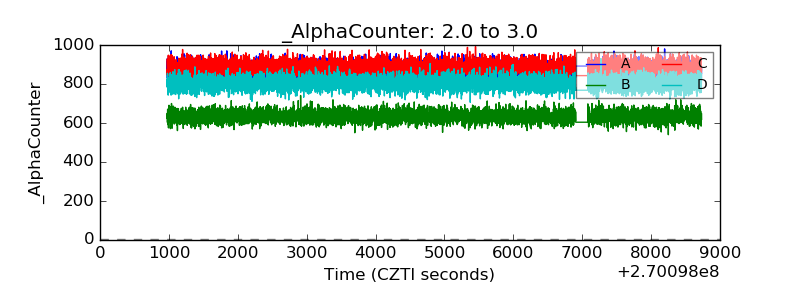 |
| _CPM_Rate |  |
| CZT Counter | 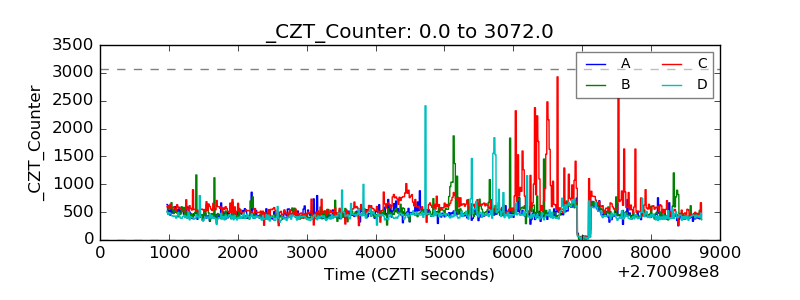 |
| +2.5 Volts monitor |  |
| +5 Volts monitor |  |
| _ROLL_ROT | 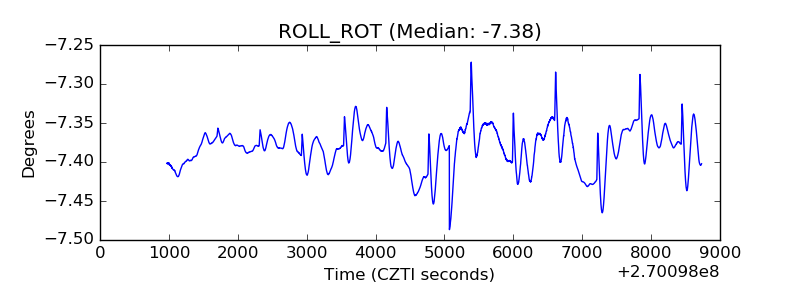 |
| _Roll_DEC | 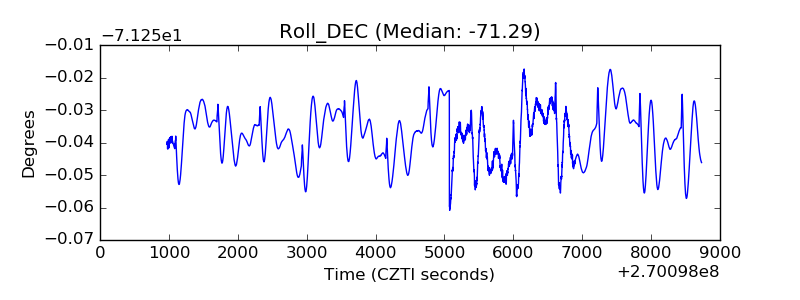 |
| _Roll_RA | 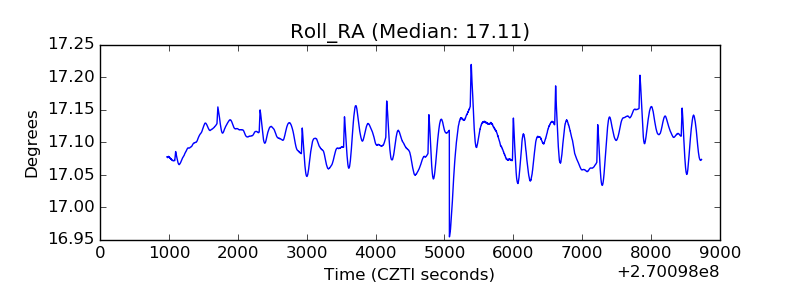 |
| Veto Counter | 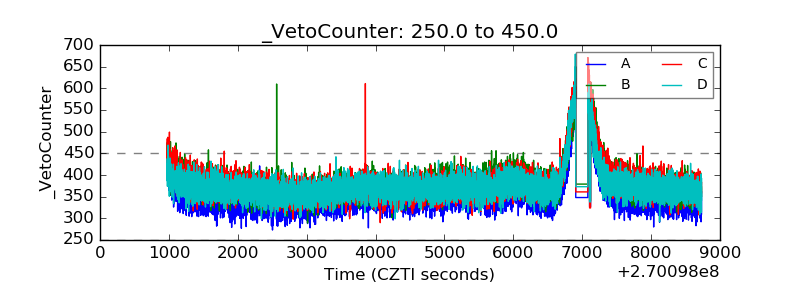 |