| Param | Original file | Final file |
|---|---|---|
| Filename | modeM0/AS1T02_072T01_9000002250_15249cztM0_level2.evt | modeM0/AS1T02_072T01_9000002250_15249cztM0_level2_quad_clean.evt |
| Size (bytes) | 779,575,680 | 195,215,040 |
| Size | 743.5 MB | 186.2 MB |
| Events in quadrant A | 5,280,614 | 1,292,383 |
| Events in quadrant B | 5,999,349 | 1,302,584 |
| Events in quadrant C | 6,565,453 | 1,305,008 |
| Events in quadrant D | 5,028,592 | 1,260,956 |
| Mode M9 | |||
|---|---|---|---|
| Quadrant | BADHDUFLAG | Total packets | Discarded packets |
| A | 0 | 3 | 0 |
| B | 0 | 3 | 0 |
| C | 0 | 3 | 0 |
| D | 0 | 3 | 0 |
| Mode SS | |||
|---|---|---|---|
| Quadrant | BADHDUFLAG | Total packets | Discarded packets |
| A | 0 | 220 | 0 |
| B | 0 | 220 | 0 |
| C | 0 | 220 | 0 |
| D | 0 | 220 | 0 |
| Mode M0 | |||
|---|---|---|---|
| Quadrant | BADHDUFLAG | Total packets | Discarded packets |
| A | 0 | 23067 | 0 |
| B | 0 | 24992 | 0 |
| C | 0 | 25981 | 0 |
| D | 0 | 22725 | 0 |
| Quadrant | Total seconds | Saturated seconds | Saturation percentage |
|---|---|---|---|
| A | 10858 | 142 | 1.307791% |
| B | 10858 | 269 | 2.477436% |
| C | 10858 | 195 | 1.795911% |
| D | 10858 | 138 | 1.270952% |
Noise dominated data is calculated using 1-second bins in cleaned event files. If a bin has >2000 counts, and if more than 50% of those come from <1% of pixels, then it is considered to be noise-dominated and hence unusable.
| Quadrant | # 1 sec bins | Bins with >0 counts | Bins with >2000 counts | High rate bins dominated by noise | Noise dominated (total time) | Noise dominated (detector-on time) | Marked lightcurve |
|---|---|---|---|---|---|---|---|
| A | 11139 | 10859 | 1 | 1 | 0.01% | 0.01% | 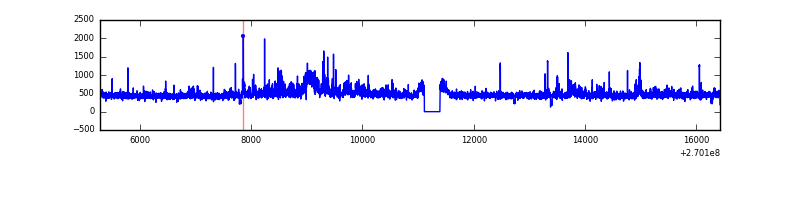 |
| B | 11139 | 10860 | 69 | 69 | 0.62% | 0.64% | 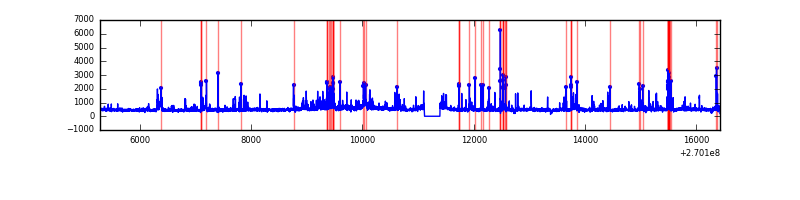 |
| C | 11139 | 10860 | 41 | 41 | 0.37% | 0.38% | 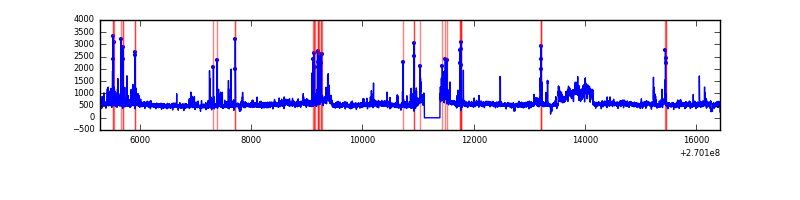 |
| D | 11139 | 10860 | 35 | 35 | 0.31% | 0.32% | 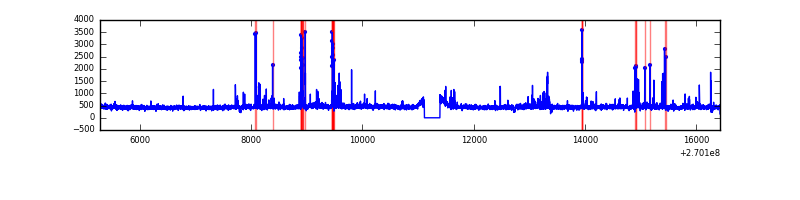 |
Top three noisy pixels from each quadrant. If the there are fewer than three noisy pixels in the level2.evt file, extra rows are filled as -1
| Pixel properties | Quadrant properties | ||||||
|---|---|---|---|---|---|---|---|
| Quadrant | DetID | PixID | Counts | Sigma | Mean | Median | Sigma |
| A | 12 | 189 | 446296 | 1770.64 | 1240 | 1211 | 251.4 |
| A | 0 | 253 | 29373 | 112.03 | 1240 | 1211 | 251.4 |
| A | 9 | 143 | 27830 | 105.9 | 1240 | 1211 | 251.4 |
| B | 10 | 245 | 340457 | 1437.48 | 1237 | 1202 | 236.0 |
| B | 10 | 16 | 327667 | 1383.29 | 1237 | 1202 | 236.0 |
| B | 3 | 64 | 220446 | 928.97 | 1237 | 1202 | 236.0 |
| C | 3 | 233 | 1443796 | 5212.74 | 1210 | 1216 | 276.7 |
| C | 4 | 254 | 380655 | 1371.1 | 1210 | 1216 | 276.7 |
| C | 3 | 9 | 18280 | 61.66 | 1210 | 1216 | 276.7 |
| D | 7 | 38 | 202172 | 685.68 | 1212 | 1173 | 293.1 |
| D | 2 | 16 | 116717 | 394.16 | 1212 | 1173 | 293.1 |
| D | 2 | 136 | 54692 | 182.57 | 1212 | 1173 | 293.1 |
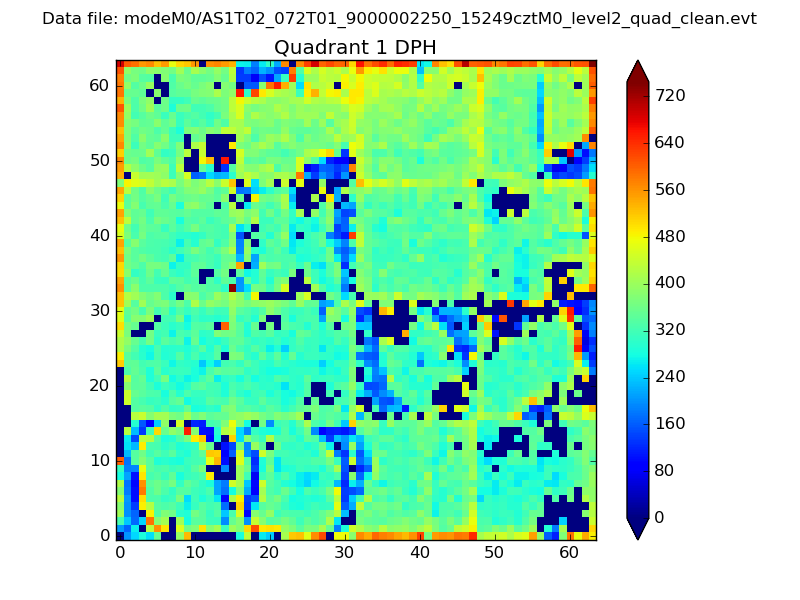
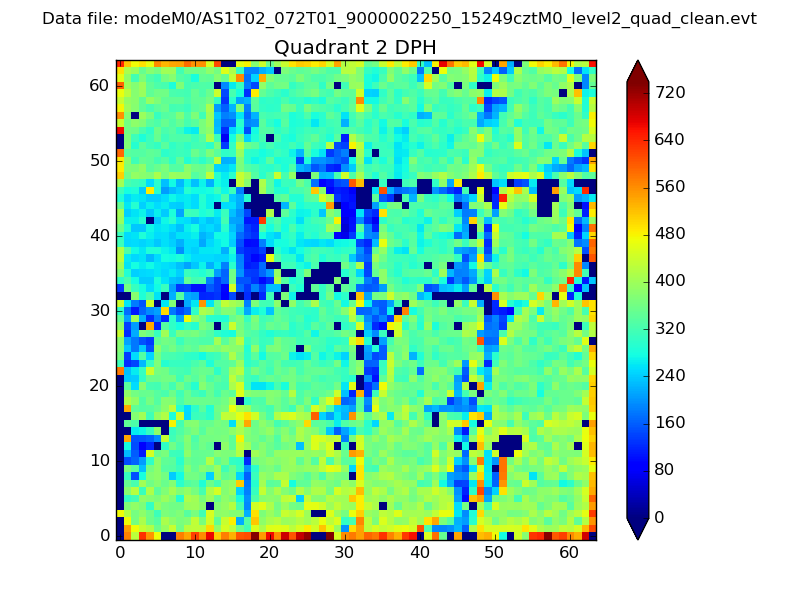
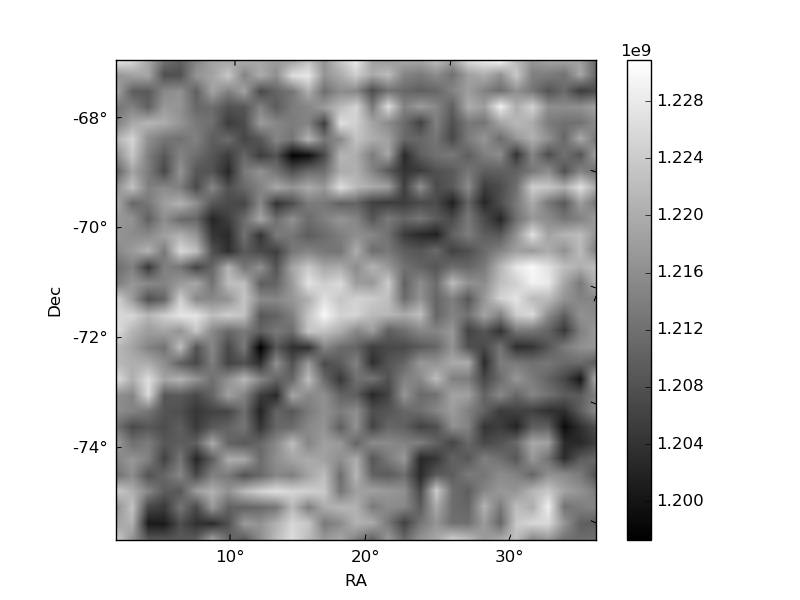
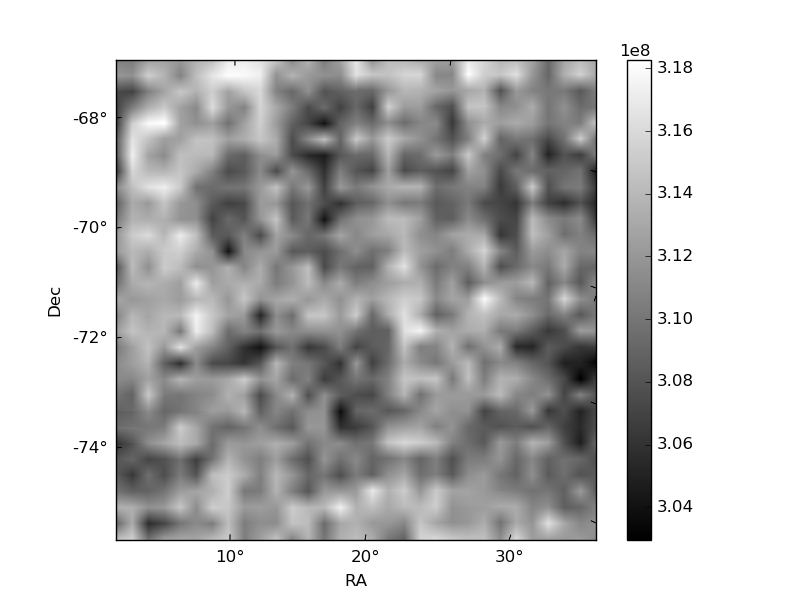
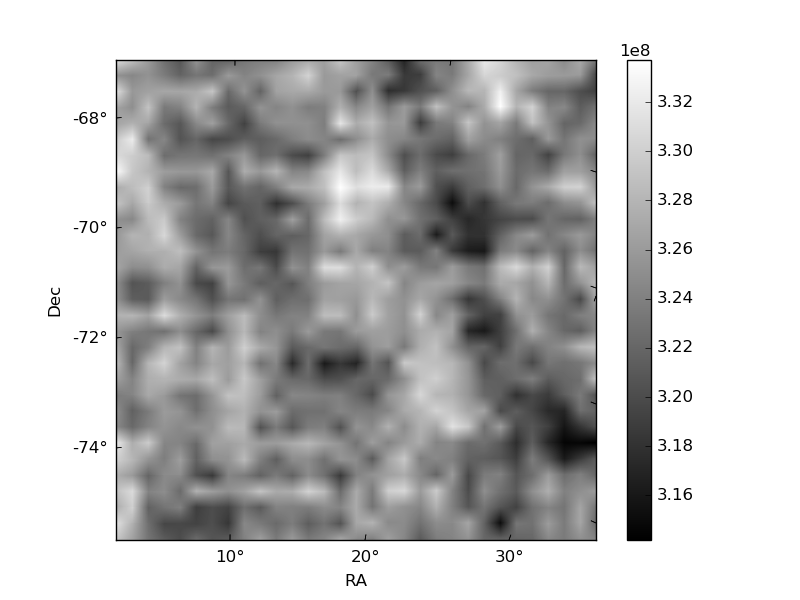
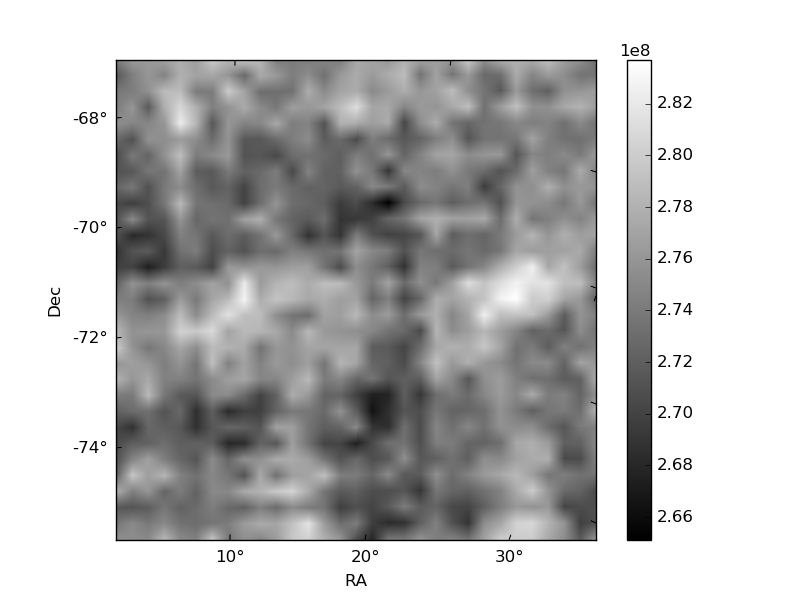
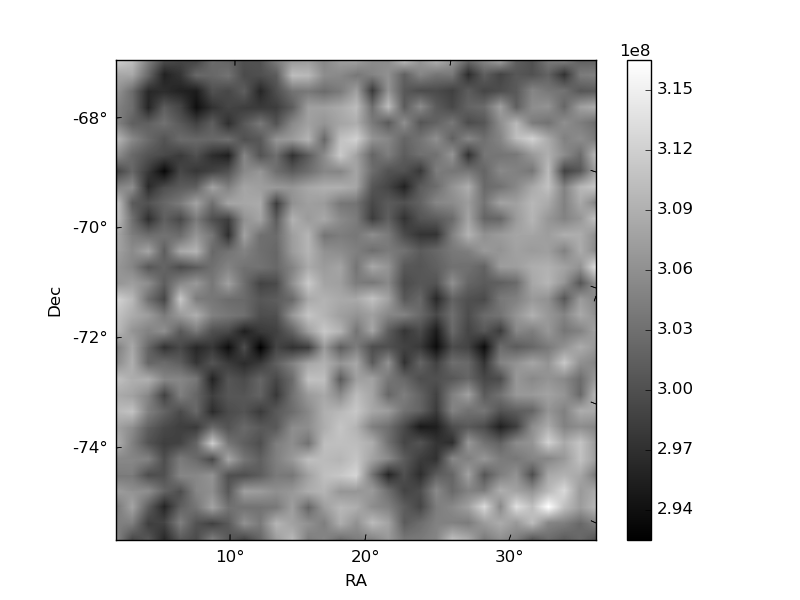
Histogram calculated using DETX and DETY for each event in the final _common_clean file
| Quadrant A |  |
 |
Quadrant B |
|---|---|---|---|
| Quadrant D | 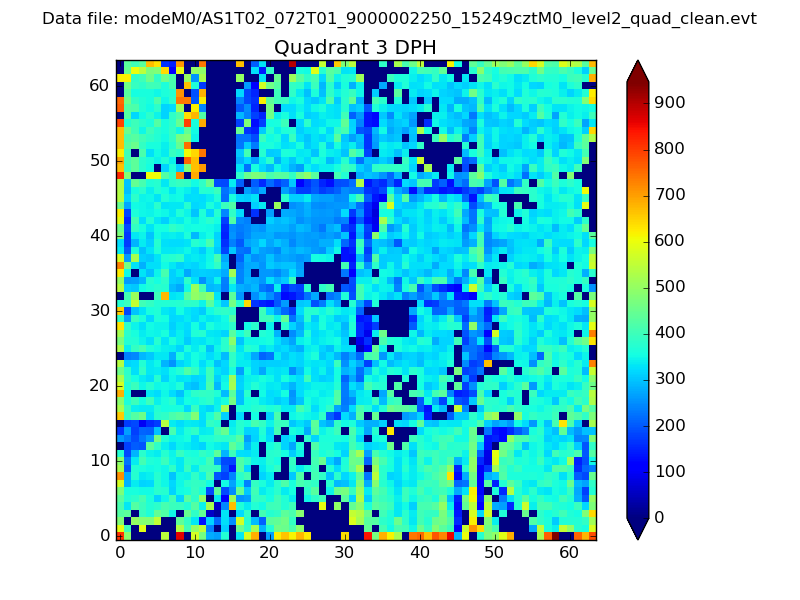 |
 |
Quadrant C |
| Plot type | Count rate plots | Images |
|---|---|---|
| Comparison with Poisson distribution Blue bars denote a histogram of data divided into 1 sec bins. Red curve is a Poisson curve with rate = median count rate of data. |
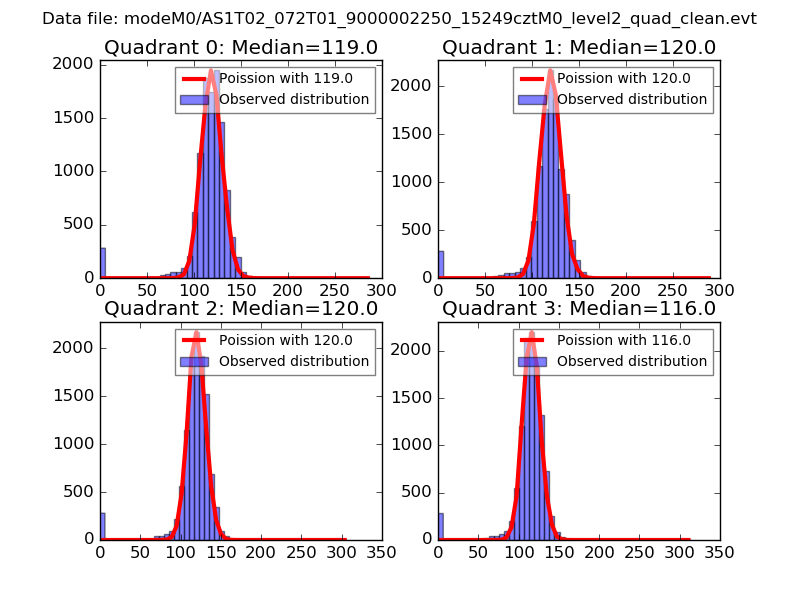 |
 |
| Quadrant-wise count rates Data is divided into 100 sec bins |
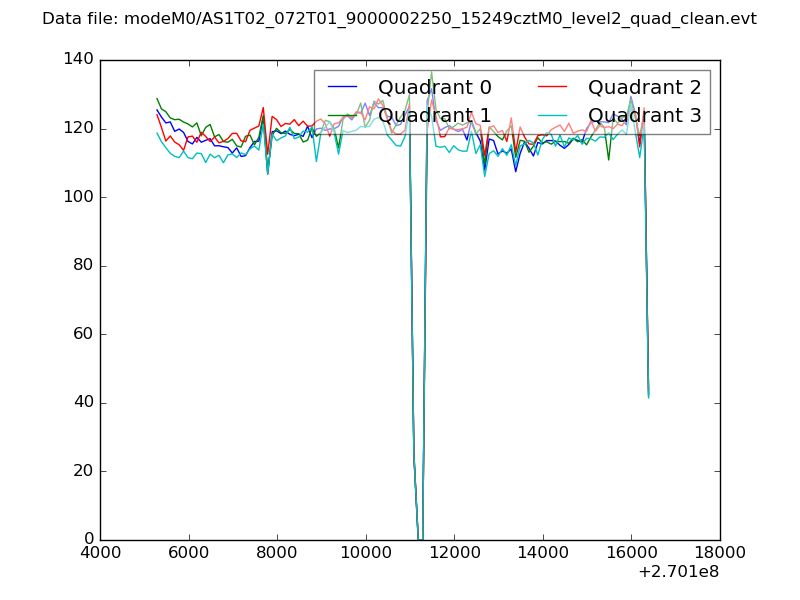 |
|
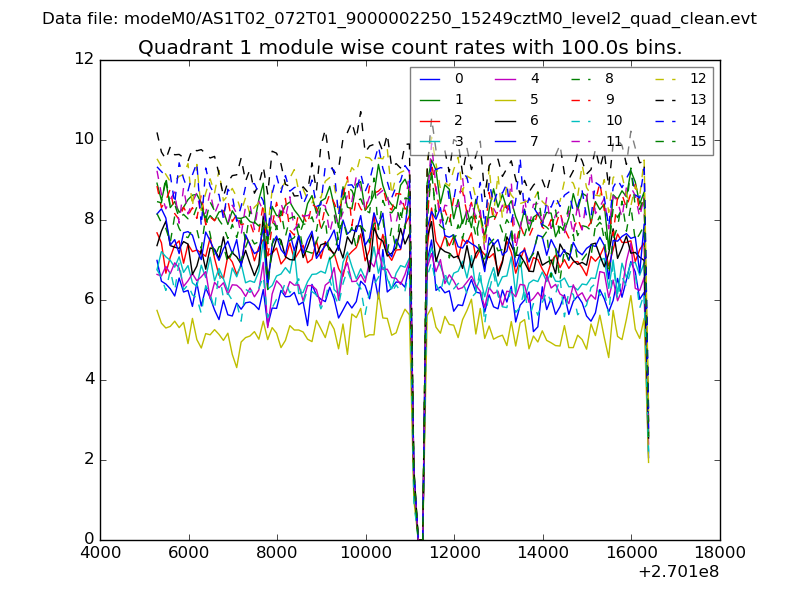
| Module-wise count rates for Quadrant A Data is divided into 100 sec bins |
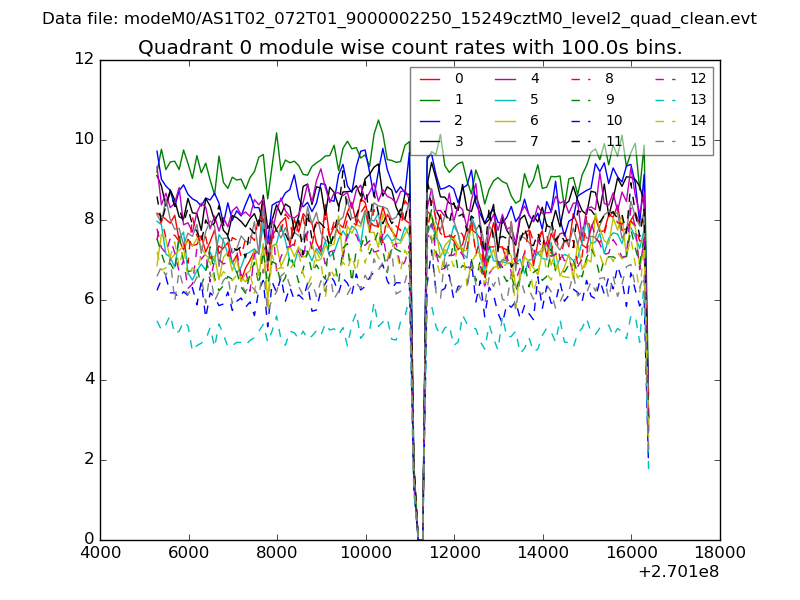 |
 |
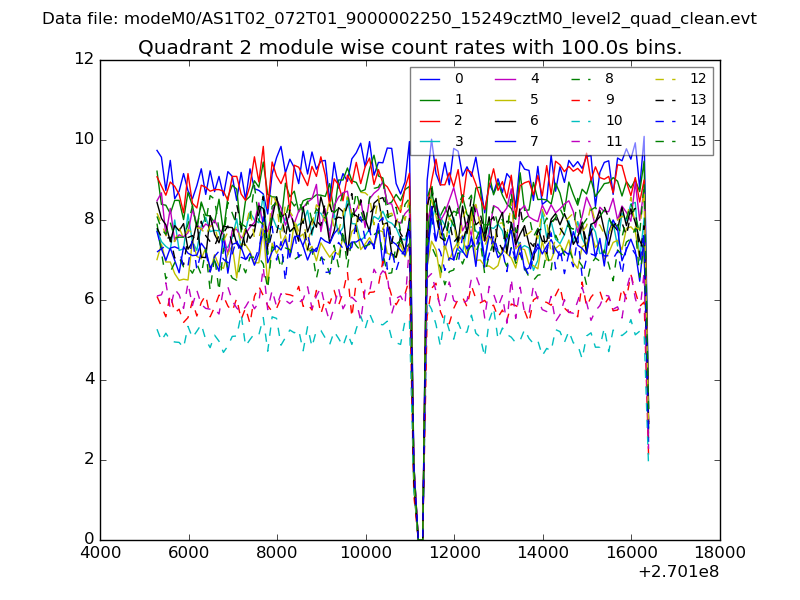
| Module-wise count rates for Quadrant B Data is divided into 100 sec bins |
 |
 |
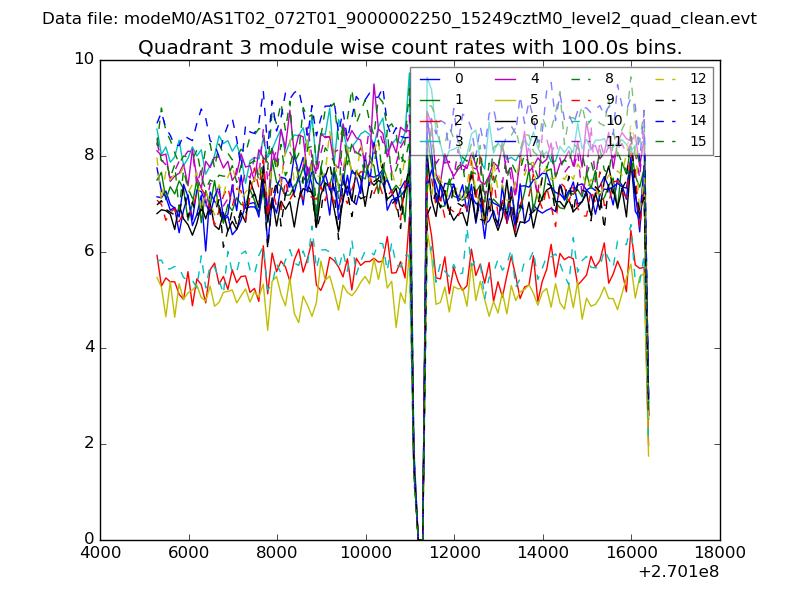
| Module-wise count rates for Quadrant C Data is divided into 100 sec bins |
 |
 |
| Module-wise count rates for Quadrant D Data is divided into 100 sec bins |
 |
 |
| Parameter | Plot |
|---|---|
| CZT HV Monitor | 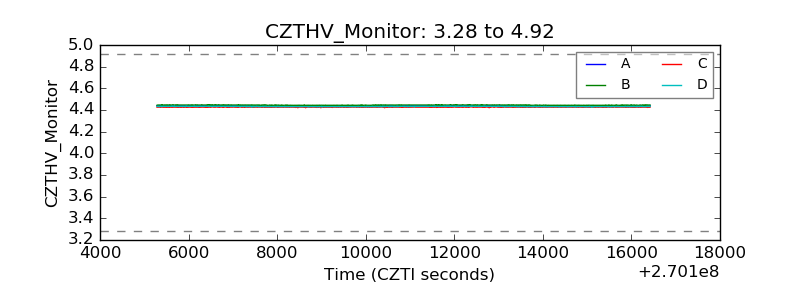 |
| D_VDD | 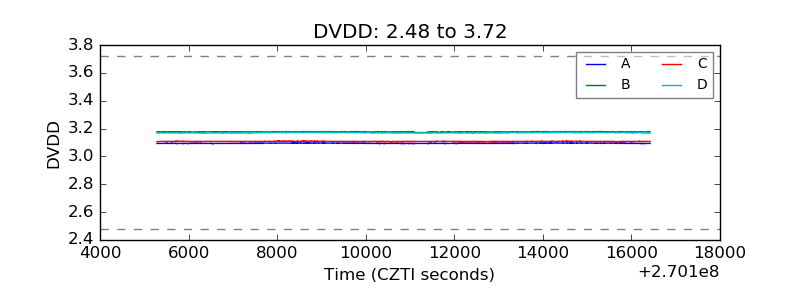 |
| Temperature 1 | 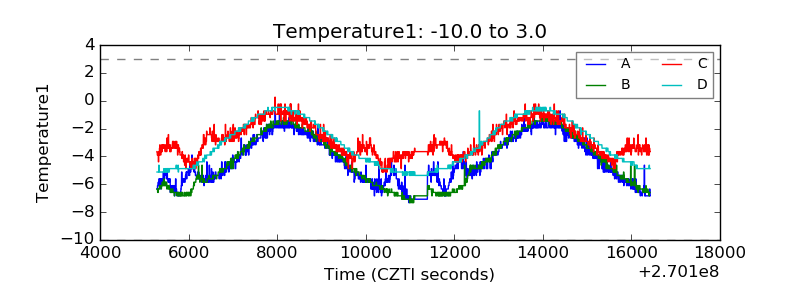 |
| Veto HV Monitor |  |
| Veto LLD | 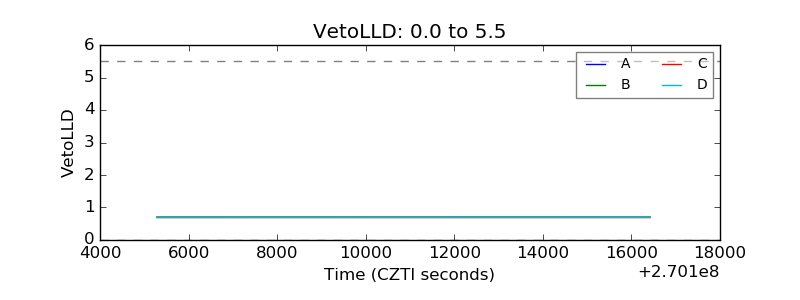 |
| Alpha Counter | 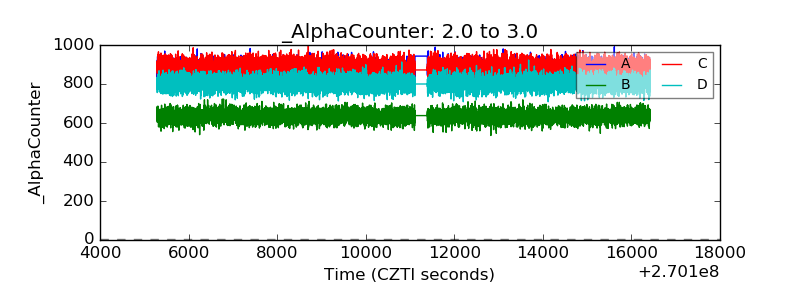 |
| _CPM_Rate |  |
| CZT Counter | 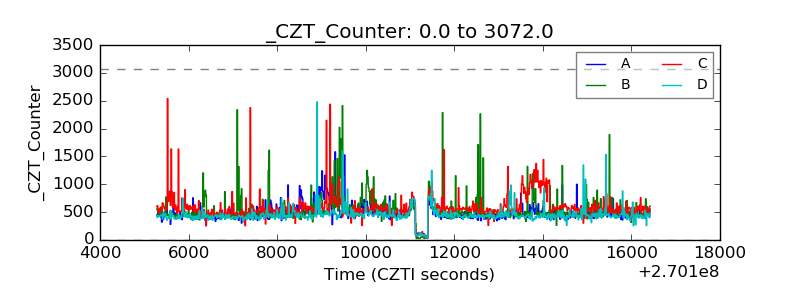 |
| +2.5 Volts monitor |  |
| +5 Volts monitor |  |
| _ROLL_ROT | 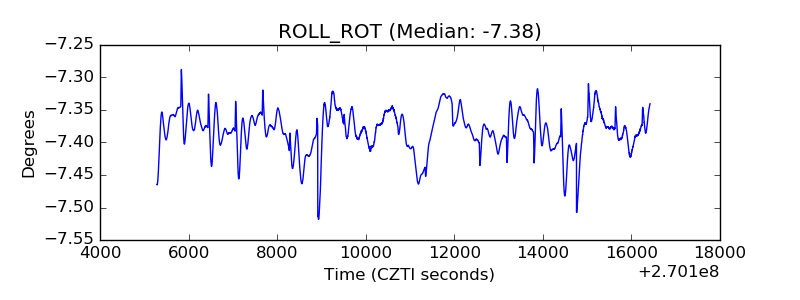 |
| _Roll_DEC | 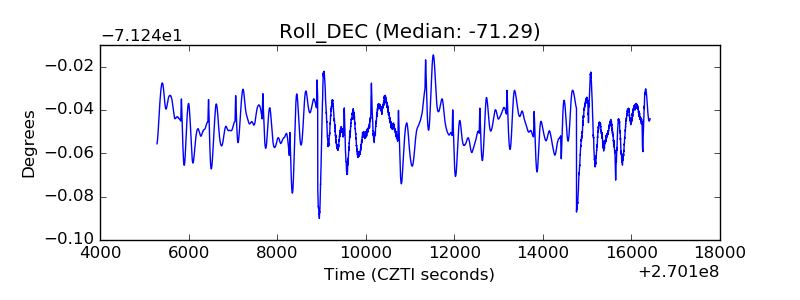 |
| _Roll_RA | 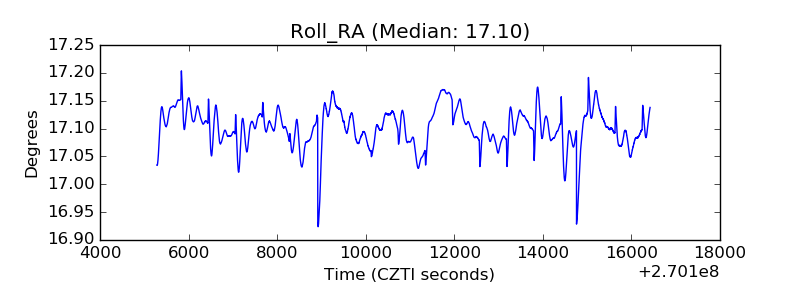 |
| Veto Counter |  |