| Param | Original file | Final file |
|---|---|---|
| Filename | modeM0/AS1T02_073T01_9000002252cztM0_level2.fits | modeM0/AS1T02_073T01_9000002252cztM0_level2_quad_clean.evt |
| Size (bytes) | 518,742,720 | 453,458,880 |
| Size | 494.7 MB | 432.5 MB |
| Events in quadrant A | 3,170,026 | 2,630,165 |
| Events in quadrant B | 3,040,524 | 2,639,650 |
| Events in quadrant C | 3,136,820 | 2,510,135 |
| Events in quadrant D | 2,740,064 | 2,329,287 |
| Mode M9 | |||
|---|---|---|---|
| Quadrant | BADHDUFLAG | Total packets | Discarded packets |
| A | 0 | 106 | 0 |
| B | 0 | 106 | 0 |
| C | 0 | 106 | 0 |
| D | 0 | 106 | 0 |
| Mode SS | |||
|---|---|---|---|
| Quadrant | BADHDUFLAG | Total packets | Discarded packets |
| A | 0 | 1076 | 0 |
| B | 0 | 1076 | 0 |
| C | 0 | 1076 | 0 |
| D | 0 | 1076 | 0 |
| Mode M0 | |||
|---|---|---|---|
| Quadrant | BADHDUFLAG | Total packets | Discarded packets |
| A | 0 | 111230 | 0 |
| B | 0 | 118703 | 0 |
| C | 0 | 115636 | 0 |
| D | 0 | 112277 | 0 |
| Quadrant | Total seconds | Saturated seconds | Saturation percentage |
|---|---|---|---|
| A | 52804 | 459 | 0.869252% |
| B | 52804 | 1244 | 2.355882% |
| C | 52804 | 626 | 1.185516% |
| D | 52804 | 519 | 0.982880% |
Noise dominated data is calculated using 1-second bins in cleaned event files. If a bin has >2000 counts, and if more than 50% of those come from <1% of pixels, then it is considered to be noise-dominated and hence unusable.
| Quadrant | # 1 sec bins | Bins with >0 counts | Bins with >2000 counts | High rate bins dominated by noise | Noise dominated (total time) | Noise dominated (detector-on time) | Marked lightcurve |
|---|---|---|---|---|---|---|---|
| A | 63395 | 52795 | 0 | 0 | 0.00% | 0.00% |  |
| B | 63395 | 52798 | 0 | 0 | 0.00% | 0.00% |  |
| C | 63395 | 52798 | 0 | 0 | 0.00% | 0.00% |  |
| D | 63395 | 52796 | 0 | 0 | 0.00% | 0.00% |  |
Top three noisy pixels from each quadrant. If the there are fewer than three noisy pixels in the level2.evt file, extra rows are filled as -1
| Pixel properties | Quadrant properties | ||||||
|---|---|---|---|---|---|---|---|
| Quadrant | DetID | PixID | Counts | Sigma | Mean | Median | Sigma |
| A | 0 | 29 | 3015 | 11.12 | 823 | 773 | 201.6 |
| A | 7 | 110 | 2543 | 8.78 | 823 | 773 | 201.6 |
| A | 15 | 236 | 2353 | 7.84 | 823 | 773 | 201.6 |
| B | 2 | 9 | 2421 | 10.49 | 802 | 766 | 157.7 |
| B | 2 | 8 | 2002 | 7.84 | 802 | 766 | 157.7 |
| B | 14 | 254 | 1999 | 7.82 | 802 | 766 | 157.7 |
| C | 12 | 241 | 2167 | 6.49 | 828 | 774 | 214.7 |
| C | 2 | 191 | 2101 | 6.18 | 828 | 774 | 214.7 |
| C | 7 | 111 | 2087 | 6.12 | 828 | 774 | 214.7 |
| D | 6 | 231 | 2039 | 6.34 | 781 | 711 | 209.3 |
| D | 3 | 14 | 2028 | 6.29 | 781 | 711 | 209.3 |
| D | 7 | 3 | 1946 | 5.9 | 781 | 711 | 209.3 |
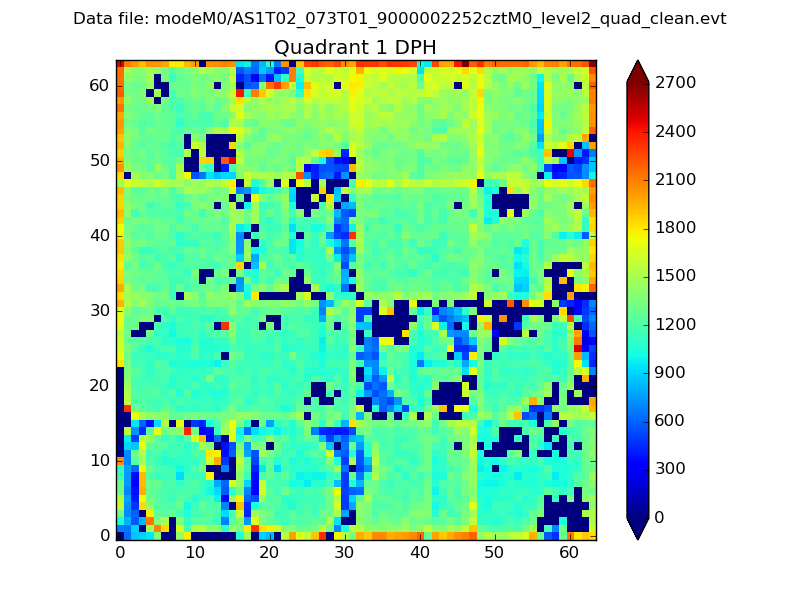
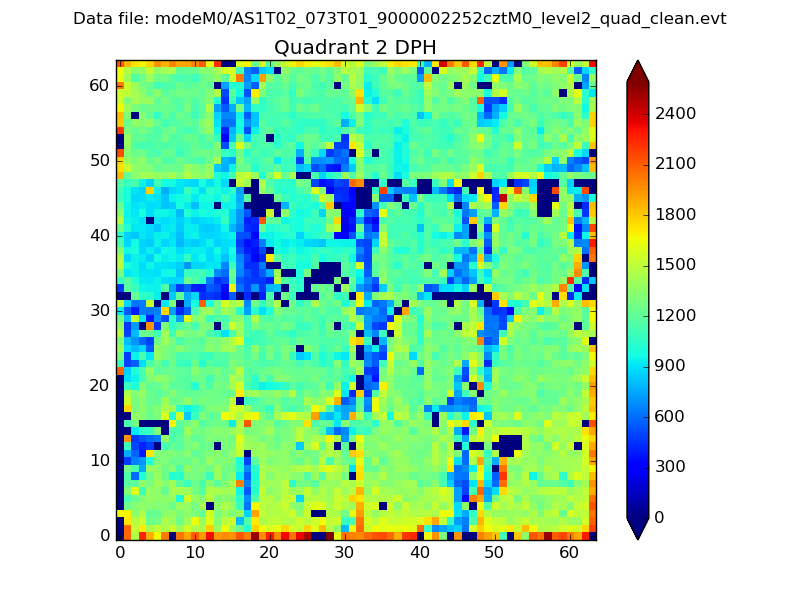
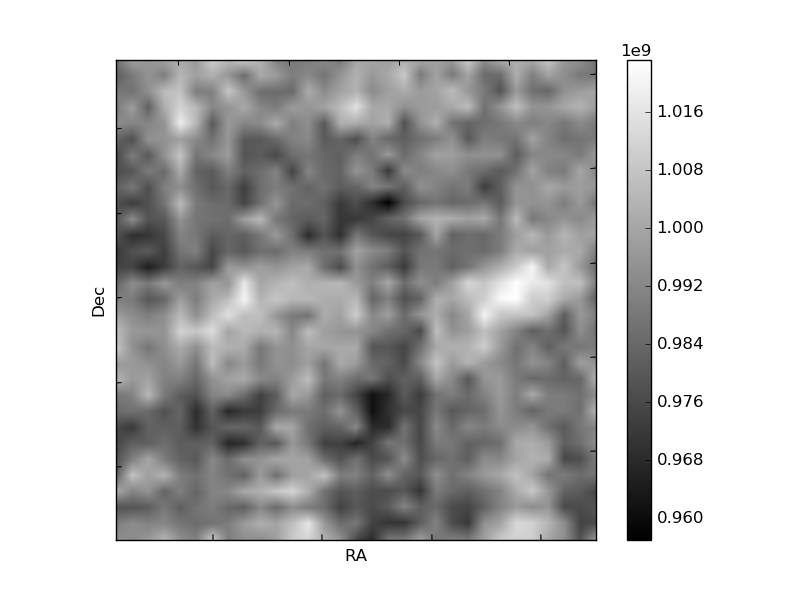
Histogram calculated using DETX and DETY for each event in the final _common_clean file
| Quadrant A |  |
 |
Quadrant B |
|---|---|---|---|
| Quadrant D | 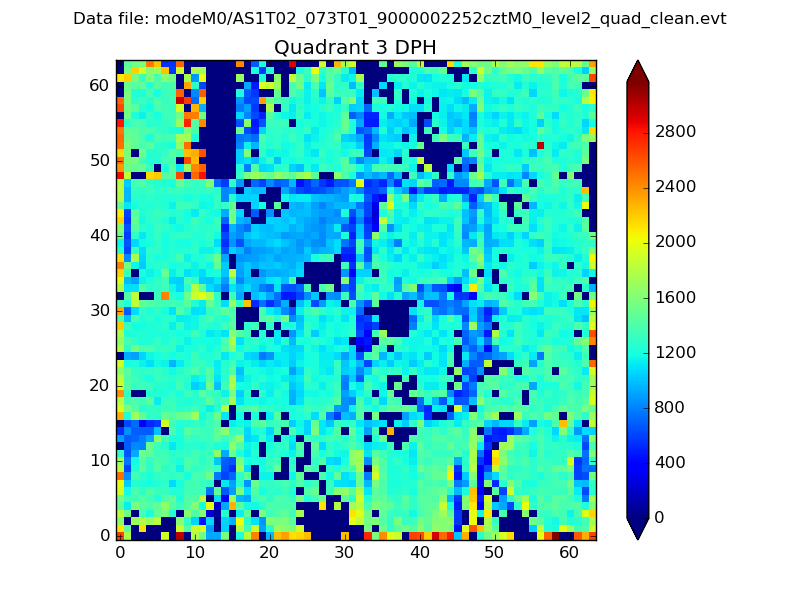 |
 |
Quadrant C |
| Plot type | Count rate plots | Images |
|---|---|---|
| Comparison with Poisson distribution Blue bars denote a histogram of data divided into 1 sec bins. Red curve is a Poisson curve with rate = median count rate of data. |
 |
 |
| Quadrant-wise count rates Data is divided into 100 sec bins |
 |
|
| Module-wise count rates for Quadrant A Data is divided into 100 sec bins |
 |
 |
| Module-wise count rates for Quadrant B Data is divided into 100 sec bins |
 |
 |
| Module-wise count rates for Quadrant C Data is divided into 100 sec bins |
 |
 |
| Module-wise count rates for Quadrant D Data is divided into 100 sec bins |
 |
 |
| Parameter | Plot |
|---|---|
| CZT HV Monitor |  |
| D_VDD |  |
| Temperature 1 |  |
| Veto HV Monitor |  |
| Veto LLD |  |
| Alpha Counter |  |
| _CPM_Rate | 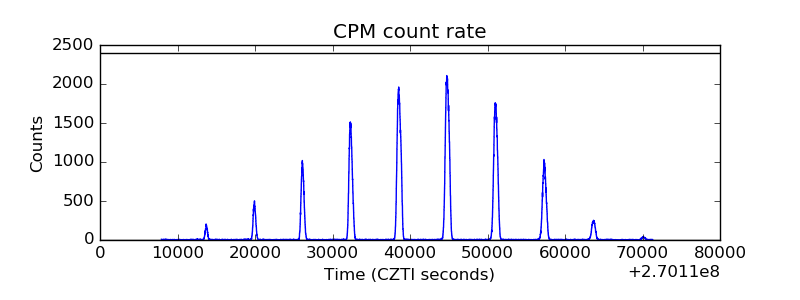 |
| CZT Counter |  |
| +2.5 Volts monitor | 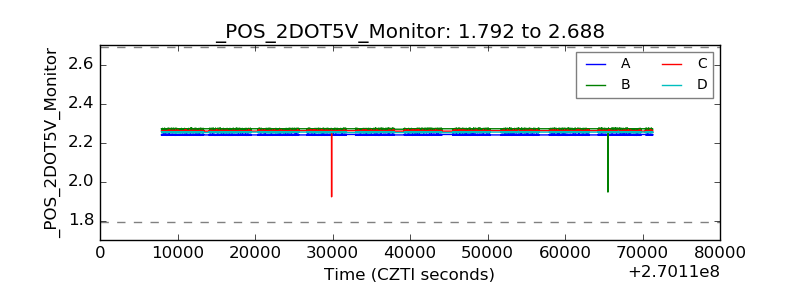 |
| +5 Volts monitor |  |
| _ROLL_ROT |  |
| _Roll_DEC |  |
| _Roll_RA | 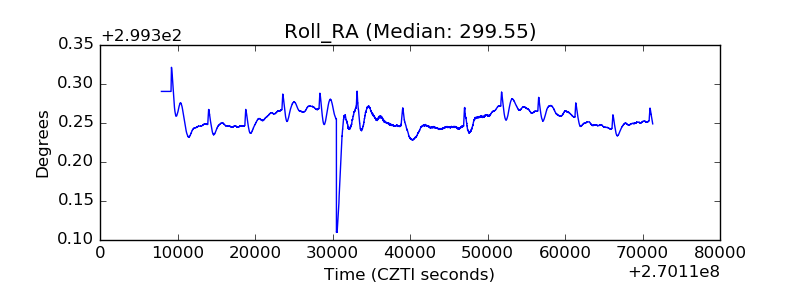 |
| Veto Counter |  |