| Param | Original file | Final file |
|---|---|---|
| Filename | modeM0/AS1T02_073T01_9000002252_15249cztM0_level2.evt | modeM0/AS1T02_073T01_9000002252_15249cztM0_level2_quad_clean.evt |
| Size (bytes) | 300,905,280 | 45,512,640 |
| Size | 287.0 MB | 43.4 MB |
| Events in quadrant A | 2,031,479 | 277,526 |
| Events in quadrant B | 2,849,431 | 270,635 |
| Events in quadrant C | 2,098,455 | 268,555 |
| Events in quadrant D | 1,843,410 | 261,607 |
| Mode SS | |||
|---|---|---|---|
| Quadrant | BADHDUFLAG | Total packets | Discarded packets |
| A | 0 | 84 | 0 |
| B | 0 | 84 | 0 |
| C | 0 | 84 | 0 |
| D | 0 | 84 | 0 |
| Mode M0 | |||
|---|---|---|---|
| Quadrant | BADHDUFLAG | Total packets | Discarded packets |
| A | 0 | 8773 | 1 |
| B | 0 | 11145 | 0 |
| C | 0 | 8725 | 0 |
| D | 0 | 8562 | 0 |
| Quadrant | Total seconds | Saturated seconds | Saturation percentage |
|---|---|---|---|
| A | 4254 | 7 | 0.164551% |
| B | 4254 | 267 | 6.276446% |
| C | 4254 | 1 | 0.023507% |
| D | 4254 | 0 | 0.000000% |
Noise dominated data is calculated using 1-second bins in cleaned event files. If a bin has >2000 counts, and if more than 50% of those come from <1% of pixels, then it is considered to be noise-dominated and hence unusable.
| Quadrant | # 1 sec bins | Bins with >0 counts | Bins with >2000 counts | High rate bins dominated by noise | Noise dominated (total time) | Noise dominated (detector-on time) | Marked lightcurve |
|---|---|---|---|---|---|---|---|
| A | 4255 | 4255 | 0 | 0 | 0.00% | 0.00% | 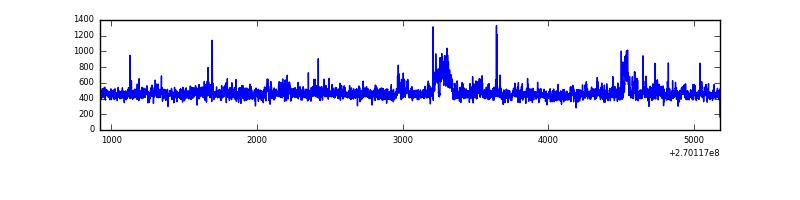 |
| B | 4255 | 4255 | 197 | 197 | 4.63% | 4.63% | 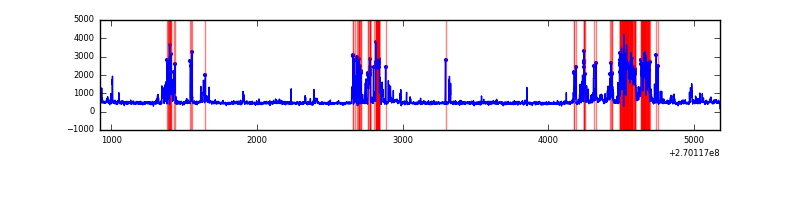 |
| C | 4255 | 4255 | 0 | 0 | 0.00% | 0.00% | 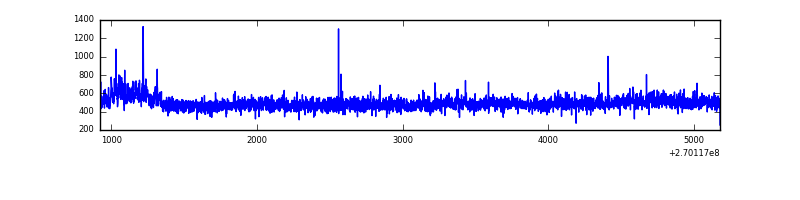 |
| D | 4255 | 4255 | 0 | 0 | 0.00% | 0.00% | 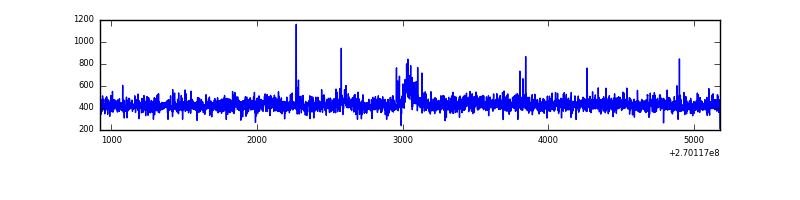 |
Top three noisy pixels from each quadrant. If the there are fewer than three noisy pixels in the level2.evt file, extra rows are filled as -1
| Pixel properties | Quadrant properties | ||||||
|---|---|---|---|---|---|---|---|
| Quadrant | DetID | PixID | Counts | Sigma | Mean | Median | Sigma |
| A | 12 | 189 | 128447 | 1269.74 | 493 | 482 | 100.8 |
| A | 0 | 253 | 5705 | 51.83 | 493 | 482 | 100.8 |
| A | 0 | 226 | 4226 | 37.15 | 493 | 482 | 100.8 |
| B | 10 | 16 | 863437 | 9193.84 | 480 | 469 | 93.9 |
| B | 10 | 245 | 40040 | 421.58 | 480 | 469 | 93.9 |
| B | 0 | 229 | 27212 | 284.91 | 480 | 469 | 93.9 |
| C | 3 | 233 | 232501 | 2074.2 | 477 | 479 | 111.9 |
| C | 4 | 254 | 5869 | 48.18 | 477 | 479 | 111.9 |
| C | 13 | 61 | 3340 | 25.58 | 477 | 479 | 111.9 |
| D | 2 | 136 | 21623 | 179.7 | 478 | 464 | 117.7 |
| D | 2 | 234 | 15506 | 127.75 | 478 | 464 | 117.7 |
| D | 2 | 16 | 10643 | 86.45 | 478 | 464 | 117.7 |
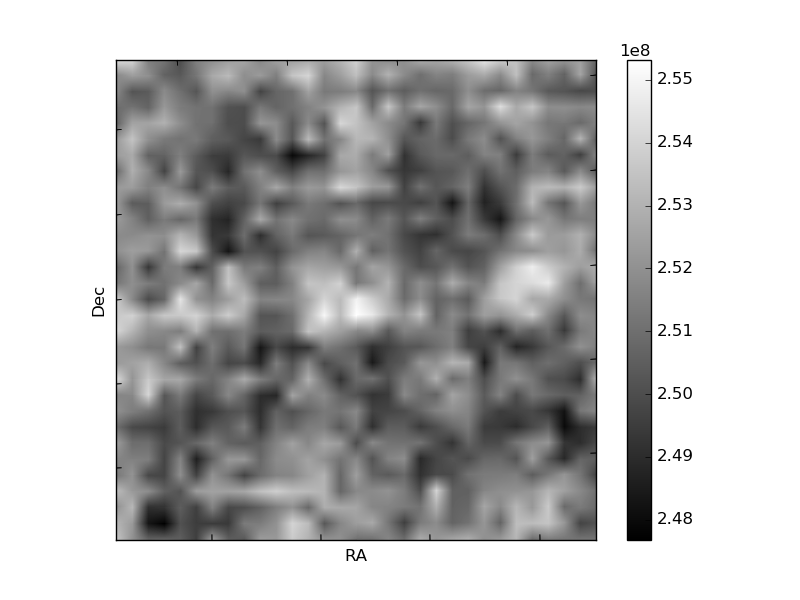
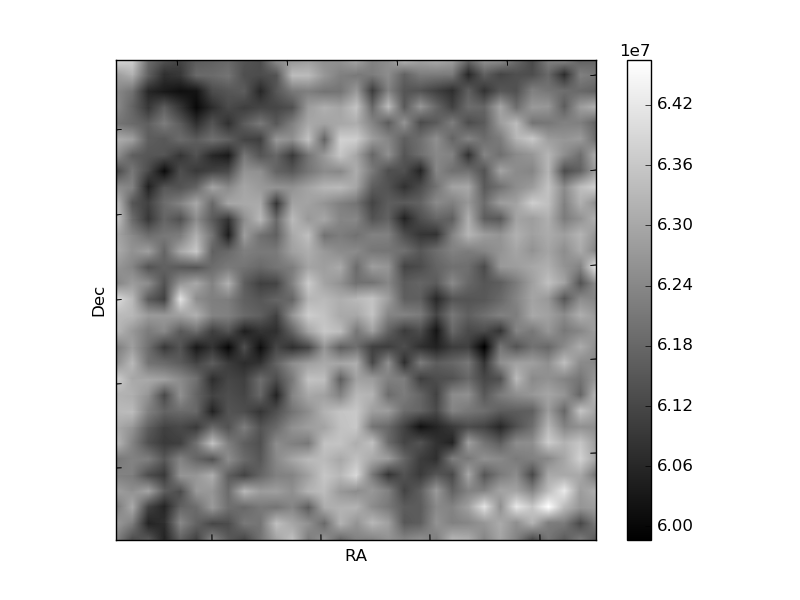
Histogram calculated using DETX and DETY for each event in the final _common_clean file
| Quadrant A | 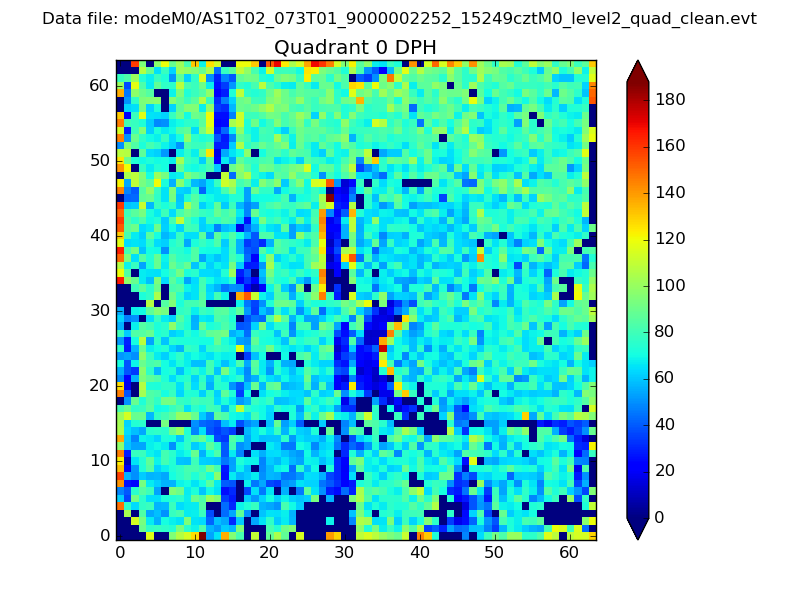 |
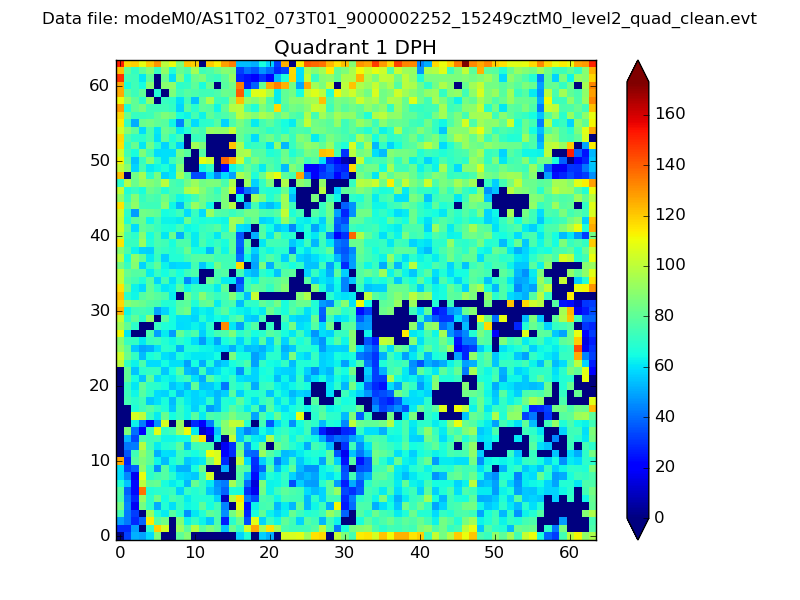 |
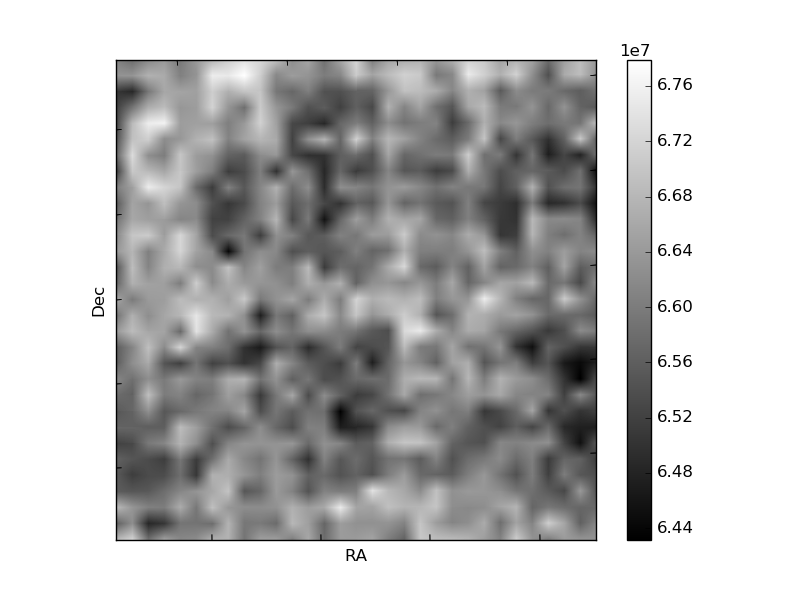
Quadrant B |
|---|---|---|---|
| Quadrant D |  |
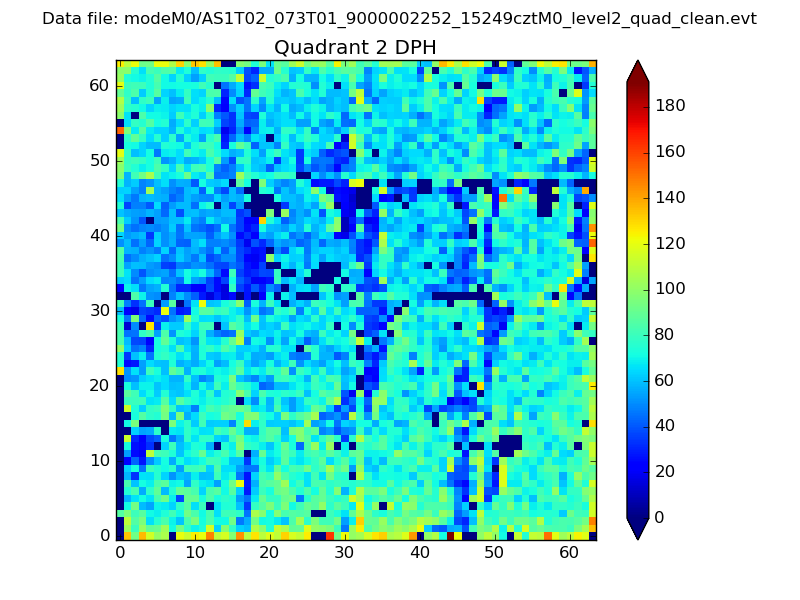 |
Quadrant C |
| Plot type | Count rate plots | Images |
|---|---|---|
| Comparison with Poisson distribution Blue bars denote a histogram of data divided into 1 sec bins. Red curve is a Poisson curve with rate = median count rate of data. |
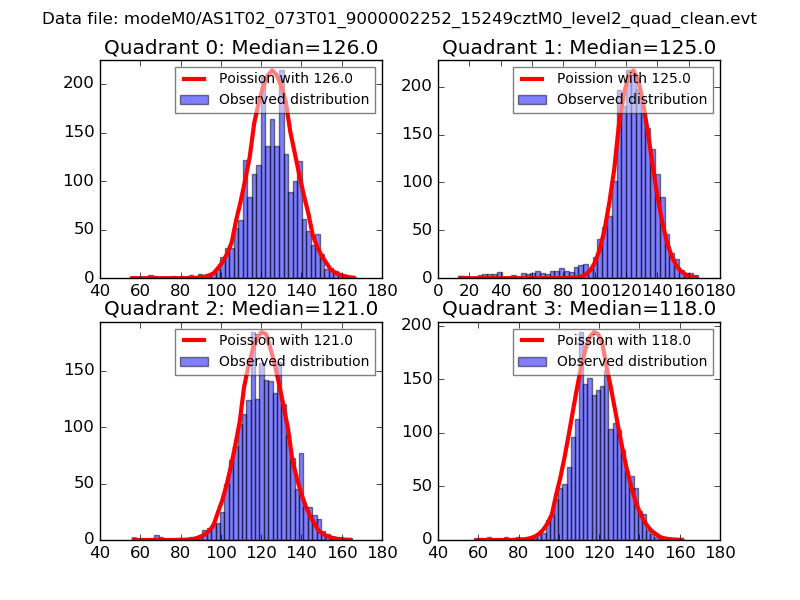 |
 |
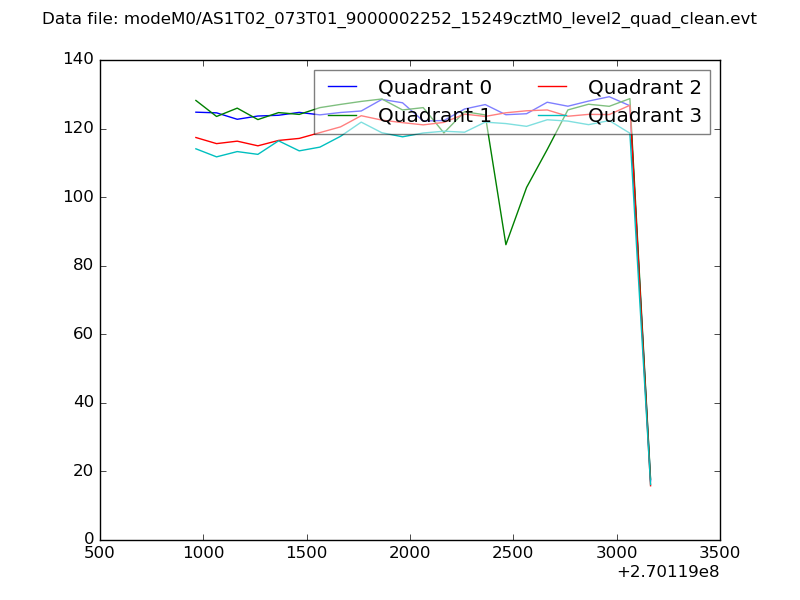
| Quadrant-wise count rates Data is divided into 100 sec bins |
 |
|
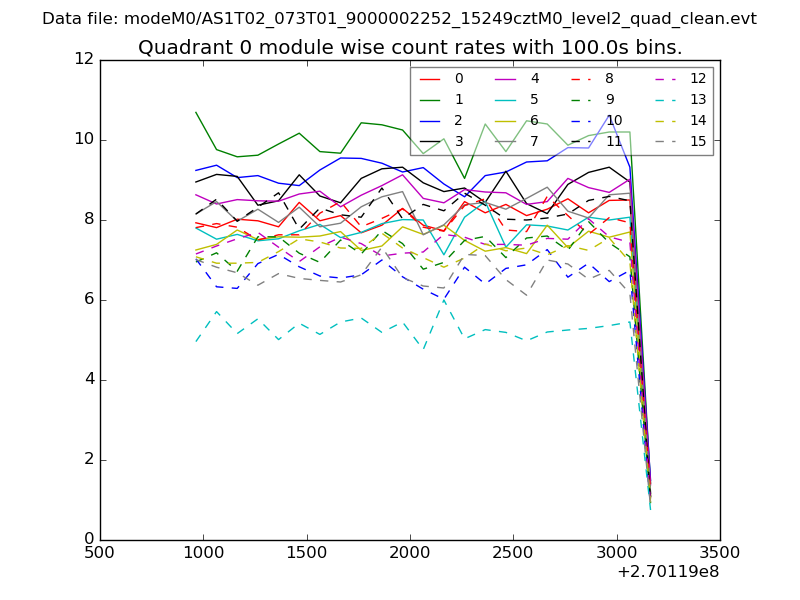
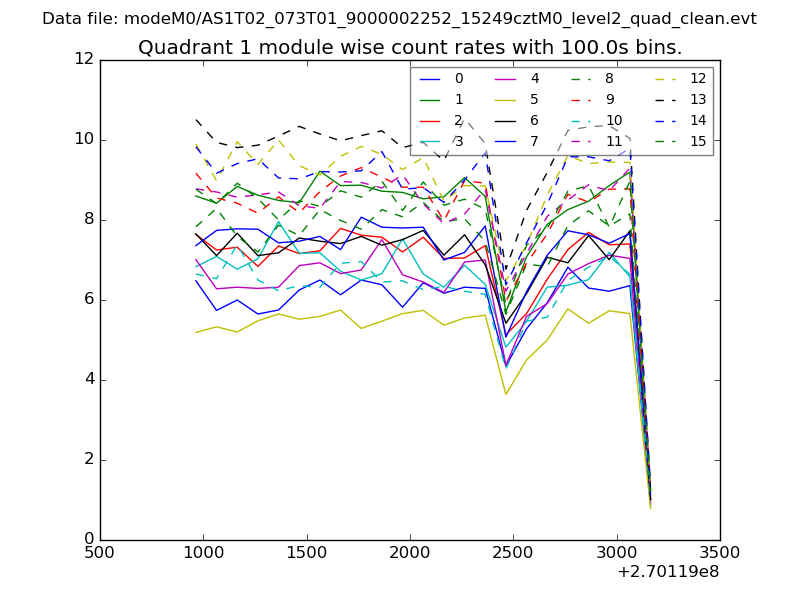
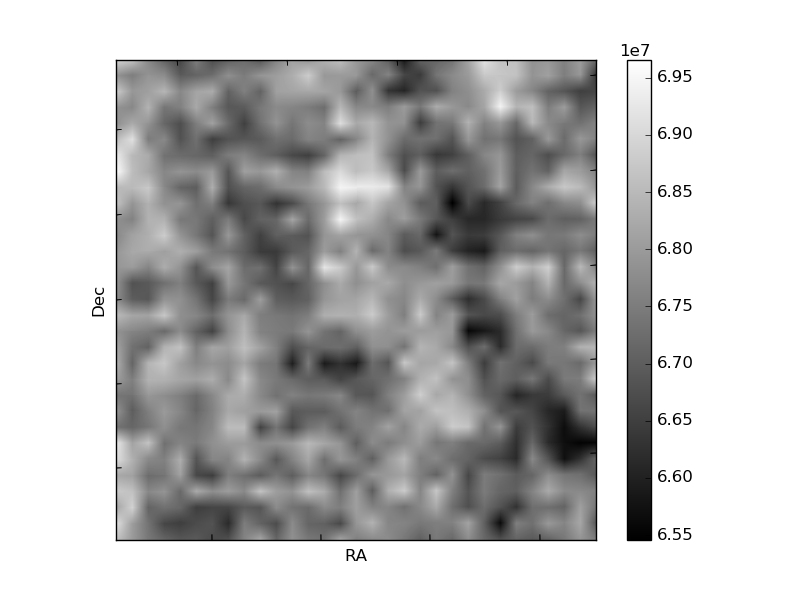
| Module-wise count rates for Quadrant A Data is divided into 100 sec bins |
 |
 |
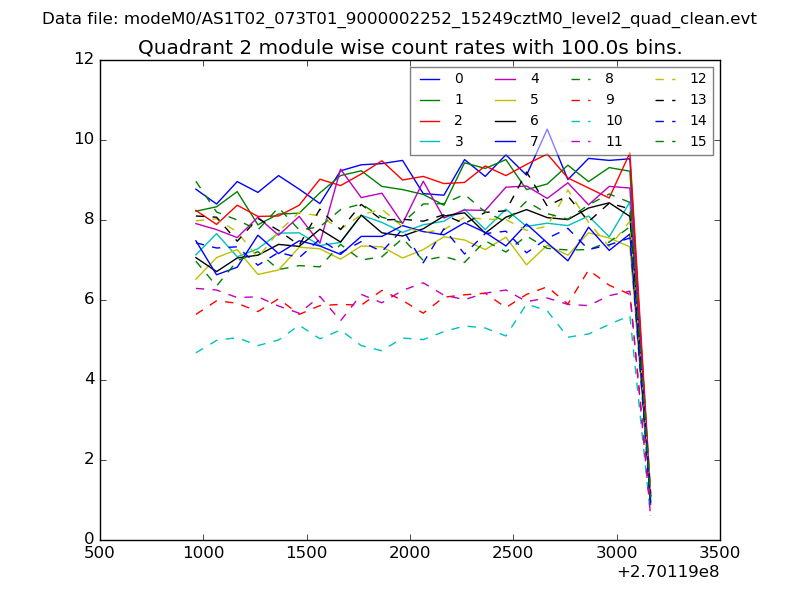
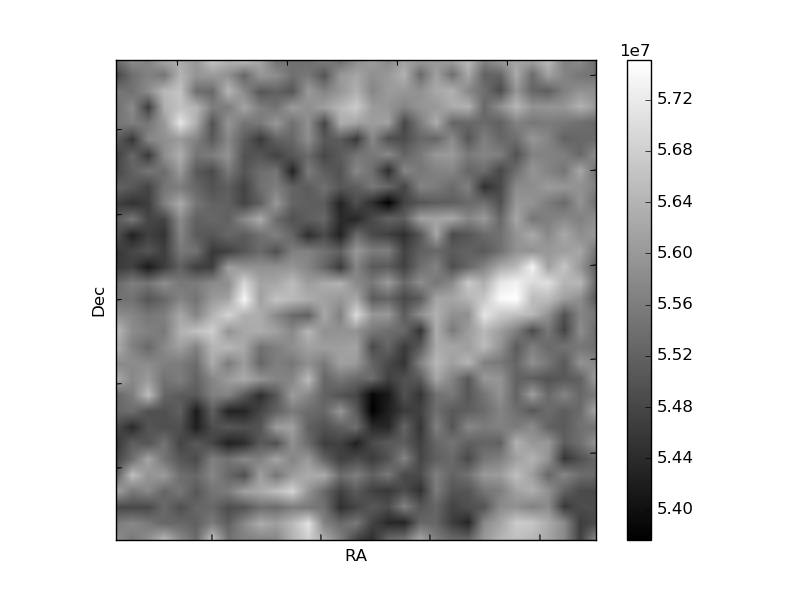
| Module-wise count rates for Quadrant B Data is divided into 100 sec bins |
 |
 |
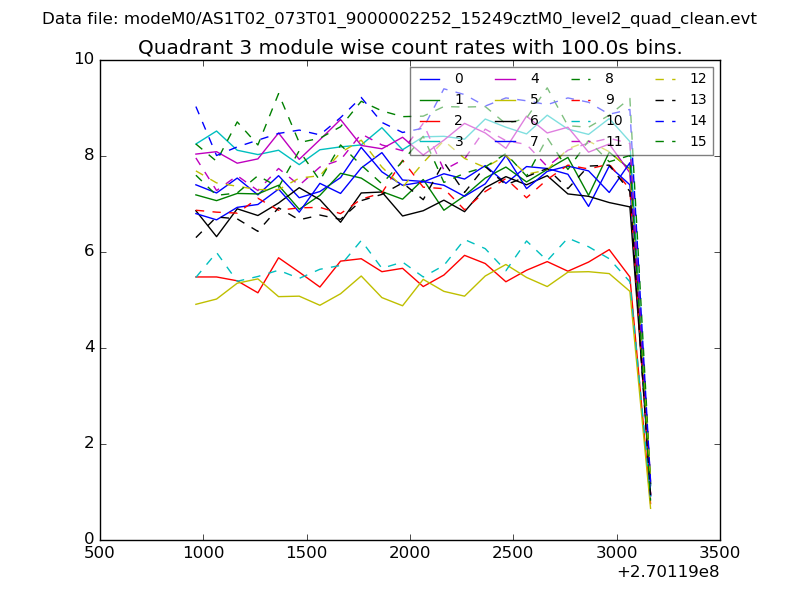
| Module-wise count rates for Quadrant C Data is divided into 100 sec bins |
 |
 |
| Module-wise count rates for Quadrant D Data is divided into 100 sec bins |
 |
 |
| Parameter | Plot |
|---|---|
| CZT HV Monitor | 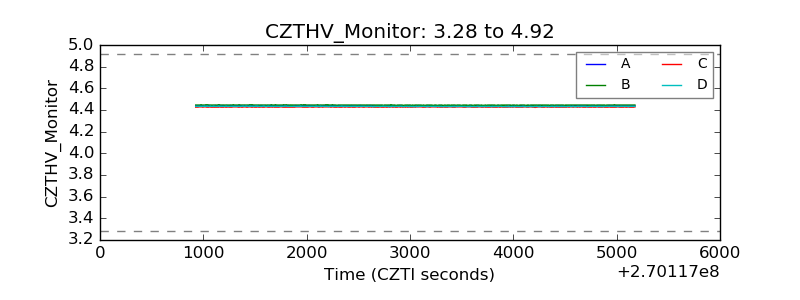 |
| D_VDD | 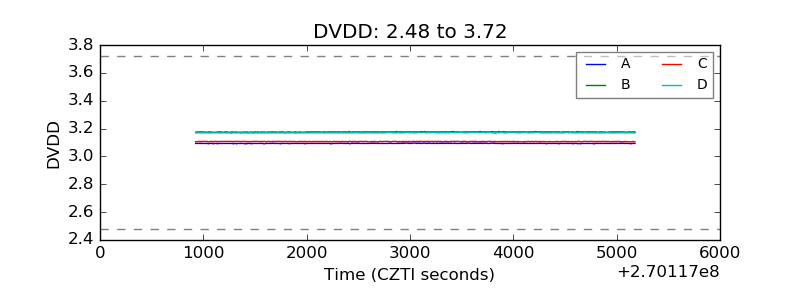 |
| Temperature 1 | 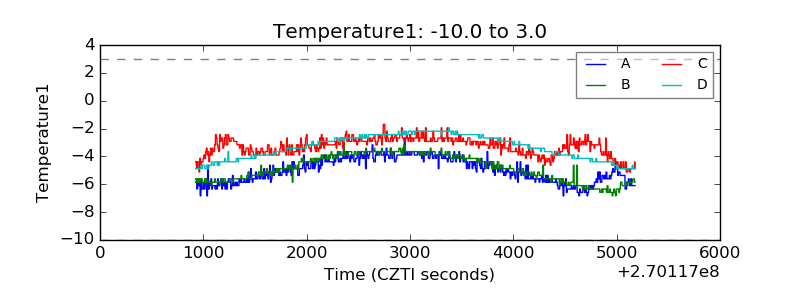 |
| Veto HV Monitor |  |
| Veto LLD | 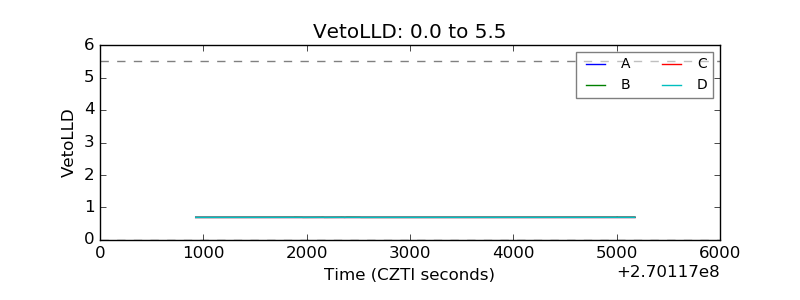 |
| Alpha Counter | 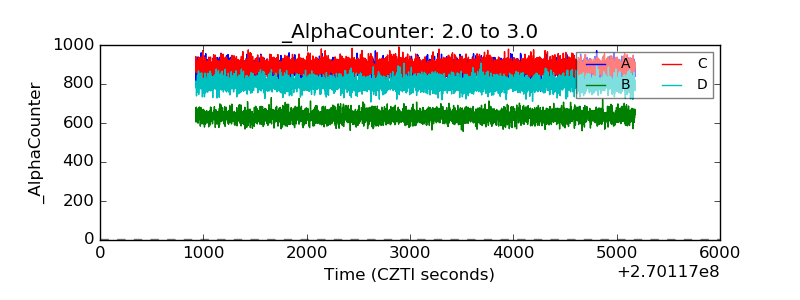 |
| _CPM_Rate | 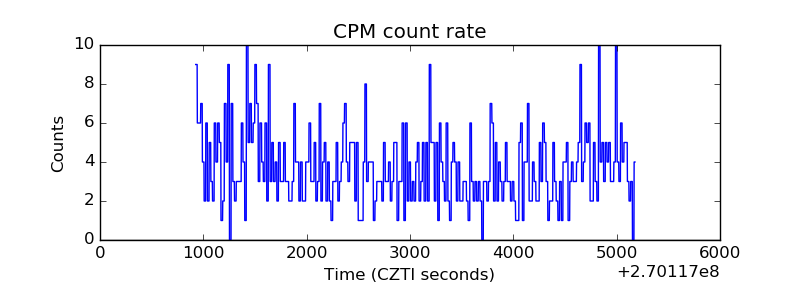 |
| CZT Counter | 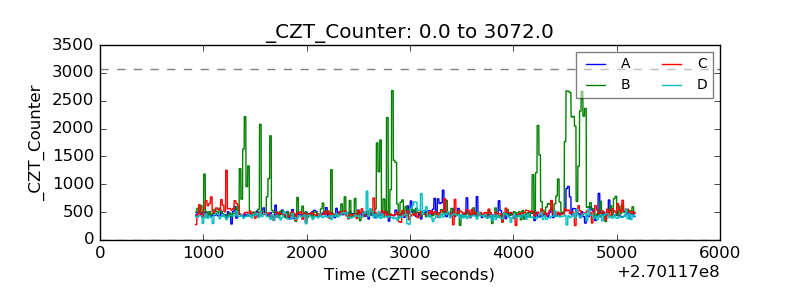 |
| +2.5 Volts monitor |  |
| +5 Volts monitor |  |
| _ROLL_ROT | 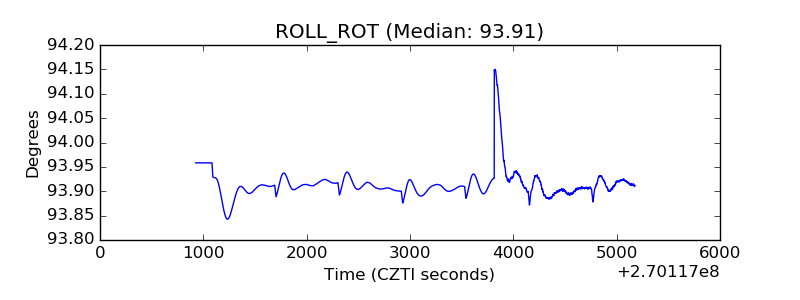 |
| _Roll_DEC |  |
| _Roll_RA |  |
| Veto Counter | 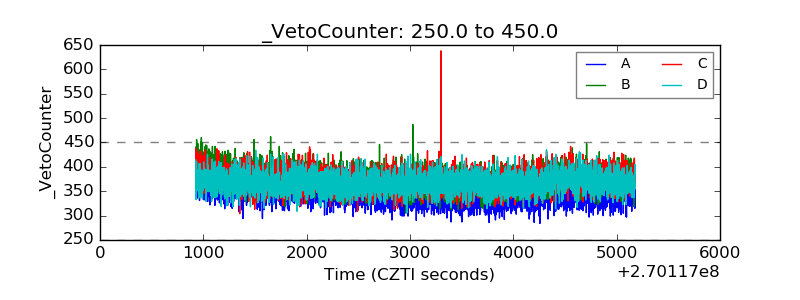 |