| Param | Original file | Final file |
|---|---|---|
| Filename | modeM0/AS1T02_073T01_9000002252_15250cztM0_level2.evt | modeM0/AS1T02_073T01_9000002252_15250cztM0_level2_quad_clean.evt |
| Size (bytes) | 599,679,360 | 111,000,960 |
| Size | 571.9 MB | 105.9 MB |
| Events in quadrant A | 4,282,478 | 700,999 |
| Events in quadrant B | 4,747,191 | 700,999 |
| Events in quadrant C | 4,491,000 | 687,323 |
| Events in quadrant D | 4,052,238 | 670,139 |
| Mode M9 | |||
|---|---|---|---|
| Quadrant | BADHDUFLAG | Total packets | Discarded packets |
| A | 0 | 15 | 0 |
| B | 0 | 15 | 0 |
| C | 0 | 15 | 0 |
| D | 0 | 15 | 0 |
| Mode SS | |||
|---|---|---|---|
| Quadrant | BADHDUFLAG | Total packets | Discarded packets |
| A | 0 | 178 | 0 |
| B | 0 | 178 | 0 |
| C | 0 | 178 | 0 |
| D | 0 | 178 | 0 |
| Mode M0 | |||
|---|---|---|---|
| Quadrant | BADHDUFLAG | Total packets | Discarded packets |
| A | 0 | 18127 | 3 |
| B | 0 | 19439 | 2 |
| C | 0 | 18177 | 2 |
| D | 0 | 18070 | 2 |
| Quadrant | Total seconds | Saturated seconds | Saturation percentage |
|---|---|---|---|
| A | 8672 | 109 | 1.256919% |
| B | 8672 | 234 | 2.698339% |
| C | 8672 | 89 | 1.026292% |
| D | 8672 | 101 | 1.164668% |
Noise dominated data is calculated using 1-second bins in cleaned event files. If a bin has >2000 counts, and if more than 50% of those come from <1% of pixels, then it is considered to be noise-dominated and hence unusable.
| Quadrant | # 1 sec bins | Bins with >0 counts | Bins with >2000 counts | High rate bins dominated by noise | Noise dominated (total time) | Noise dominated (detector-on time) | Marked lightcurve |
|---|---|---|---|---|---|---|---|
| A | 10198 | 8673 | 0 | 0 | 0.00% | 0.00% | 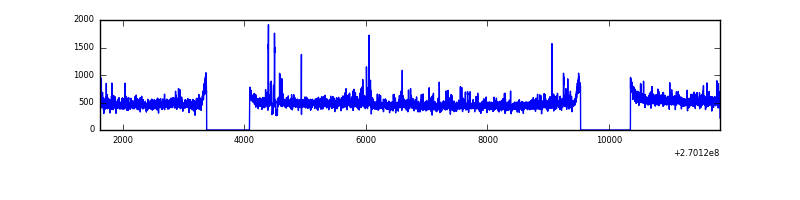 |
| B | 10198 | 8673 | 89 | 89 | 0.87% | 1.03% | 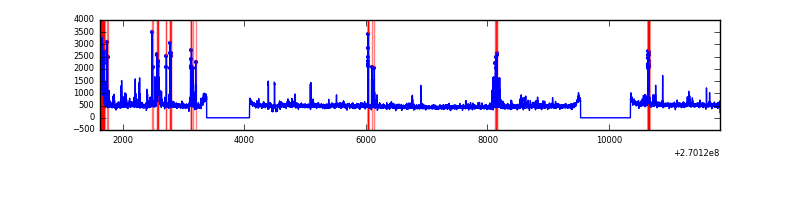 |
| C | 10198 | 8673 | 2 | 2 | 0.02% | 0.02% | 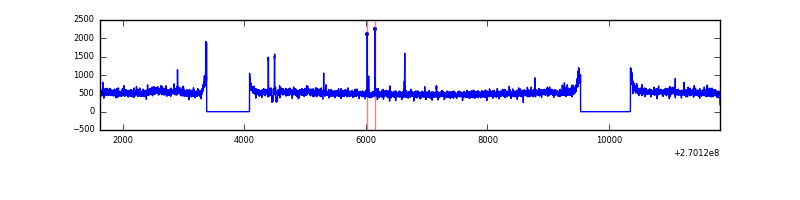 |
| D | 10198 | 8674 | 13 | 13 | 0.13% | 0.15% | 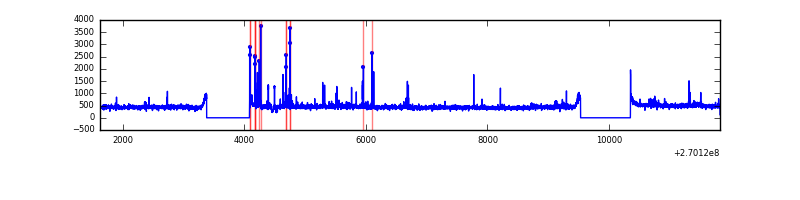 |
Top three noisy pixels from each quadrant. If the there are fewer than three noisy pixels in the level2.evt file, extra rows are filled as -1
| Pixel properties | Quadrant properties | ||||||
|---|---|---|---|---|---|---|---|
| Quadrant | DetID | PixID | Counts | Sigma | Mean | Median | Sigma |
| A | 12 | 189 | 214892 | 996.6 | 1056 | 1033 | 214.6 |
| A | 0 | 226 | 9326 | 38.65 | 1056 | 1033 | 214.6 |
| A | 12 | 194 | 7901 | 32.01 | 1056 | 1033 | 214.6 |
| B | 10 | 16 | 387624 | 1918.68 | 1051 | 1024 | 201.5 |
| B | 10 | 245 | 71253 | 348.54 | 1051 | 1024 | 201.5 |
| B | 3 | 64 | 52713 | 256.53 | 1051 | 1024 | 201.5 |
| C | 3 | 233 | 475827 | 1996.82 | 1021 | 1023 | 237.8 |
| C | 4 | 254 | 26327 | 106.42 | 1021 | 1023 | 237.8 |
| C | 10 | 22 | 10667 | 40.56 | 1021 | 1023 | 237.8 |
| D | 2 | 136 | 107185 | 426.15 | 1021 | 990 | 249.2 |
| D | 2 | 234 | 30264 | 117.47 | 1021 | 990 | 249.2 |
| D | 10 | 70 | 28740 | 111.36 | 1021 | 990 | 249.2 |
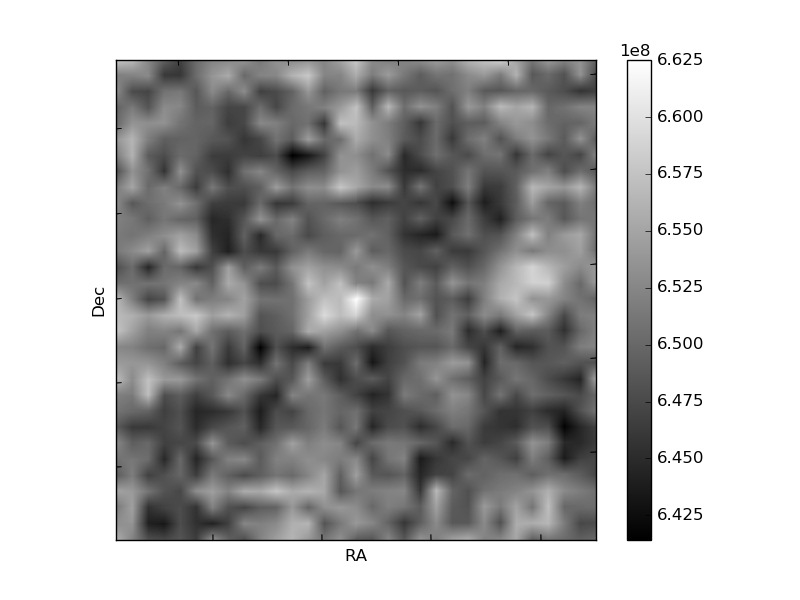
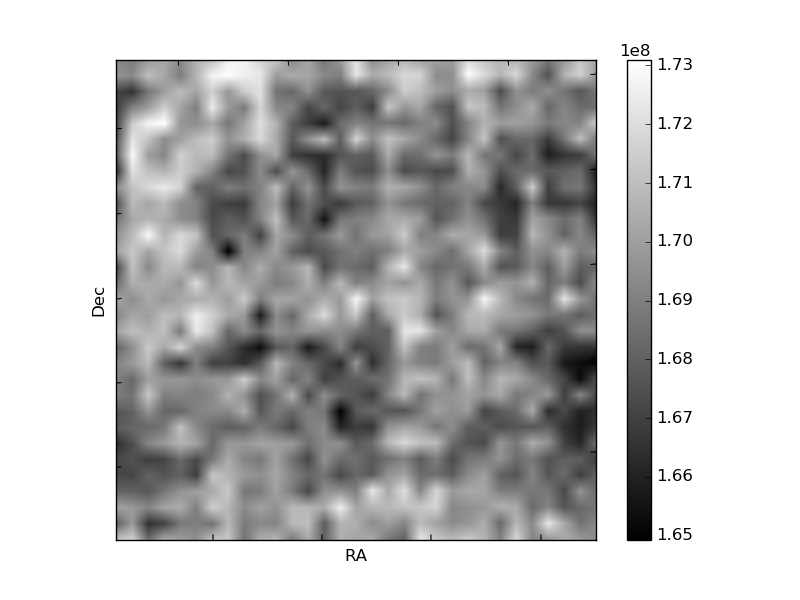
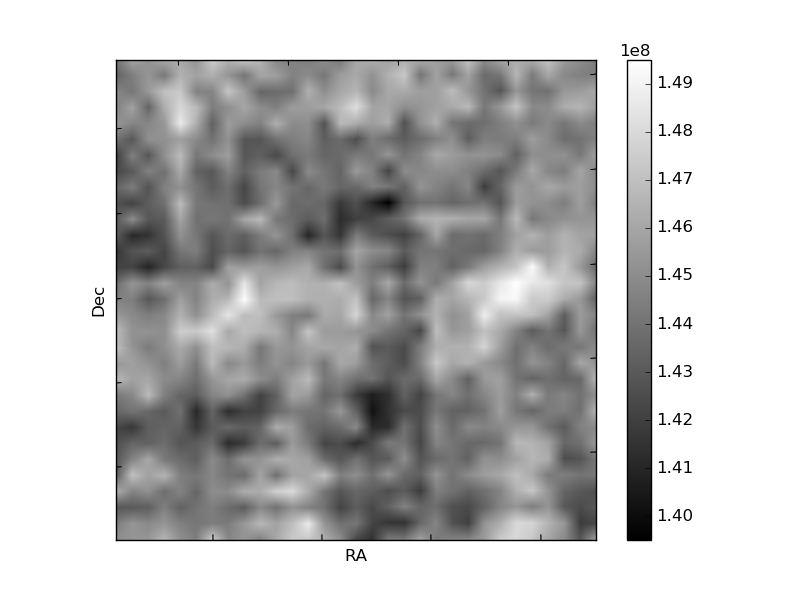
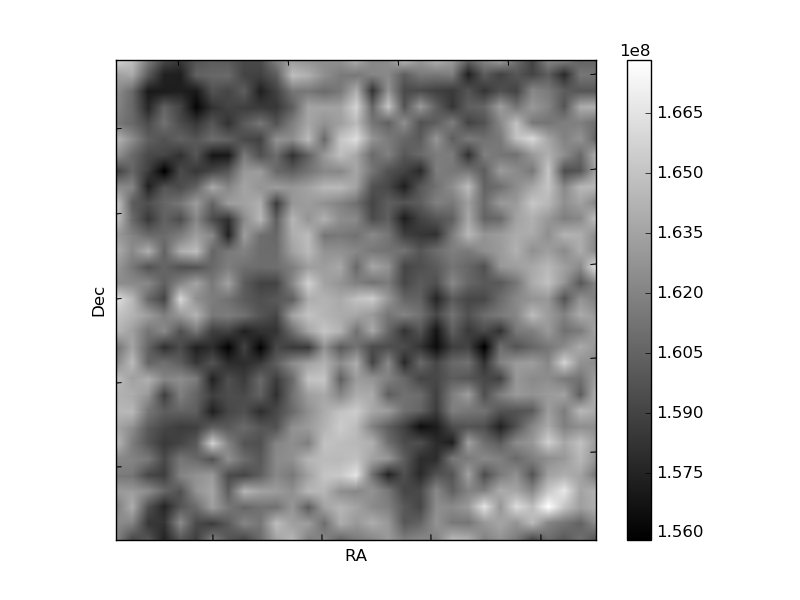
Histogram calculated using DETX and DETY for each event in the final _common_clean file
| Quadrant A | 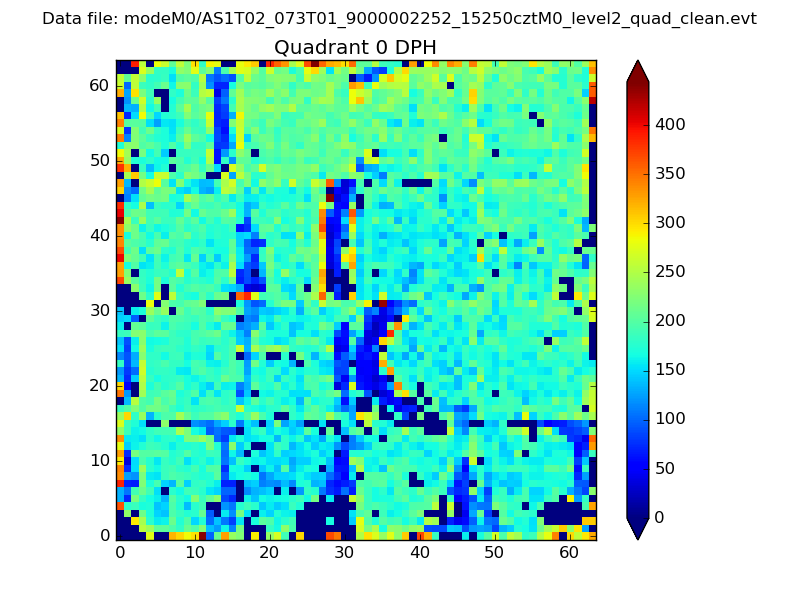 |
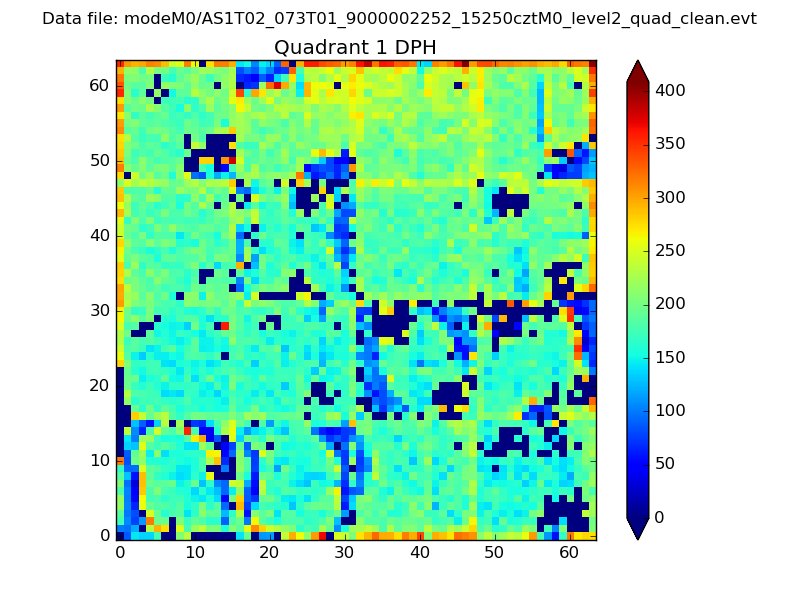 |
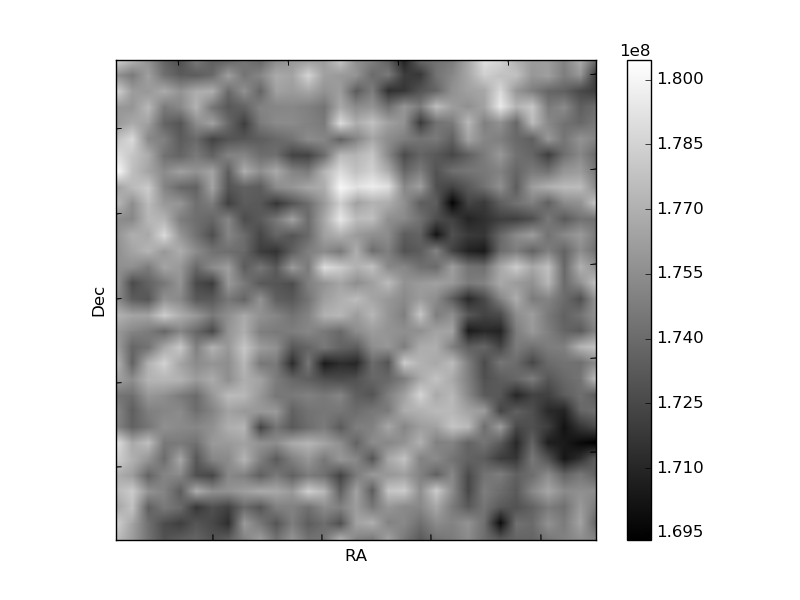
Quadrant B |
|---|---|---|---|
| Quadrant D | 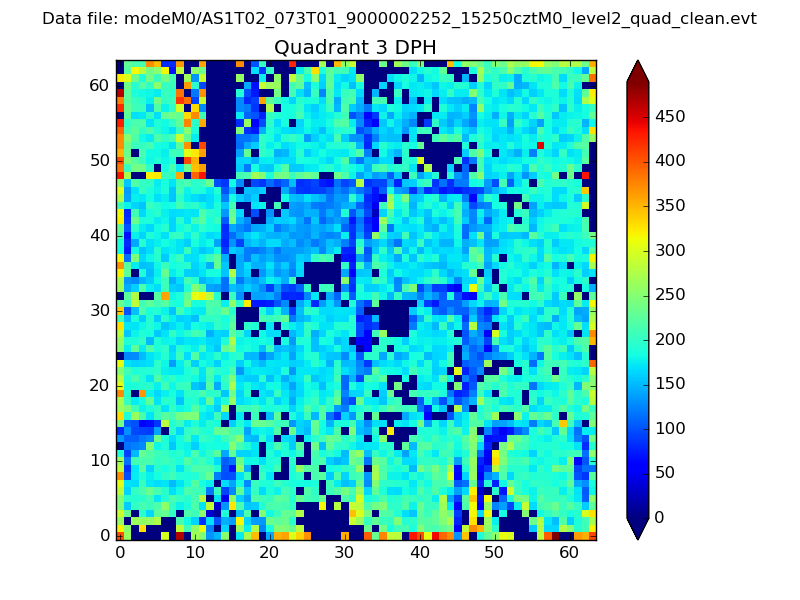 |
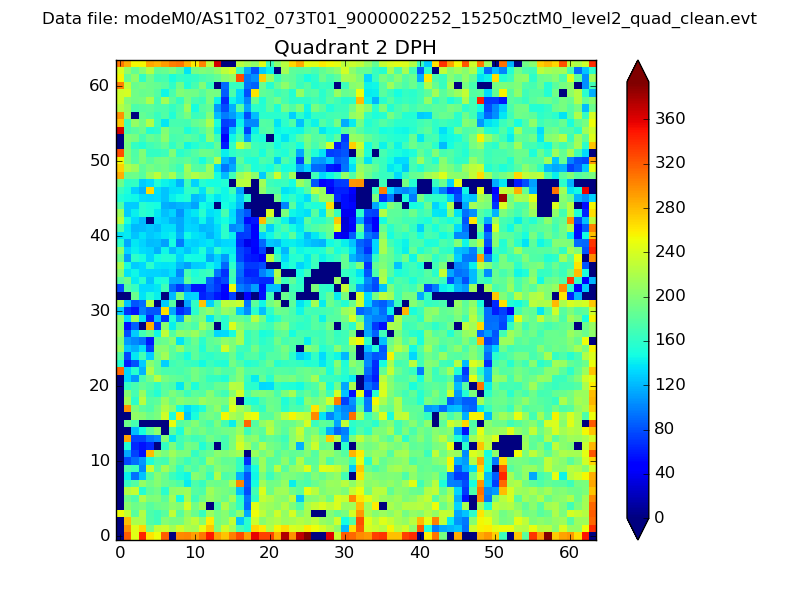 |
Quadrant C |
| Plot type | Count rate plots | Images |
|---|---|---|
| Comparison with Poisson distribution Blue bars denote a histogram of data divided into 1 sec bins. Red curve is a Poisson curve with rate = median count rate of data. |
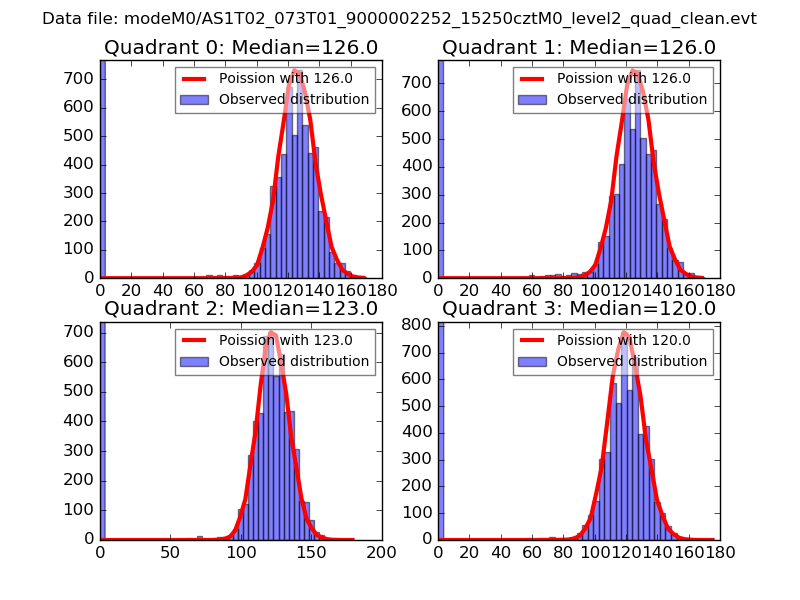 |
 |
| Quadrant-wise count rates Data is divided into 100 sec bins |
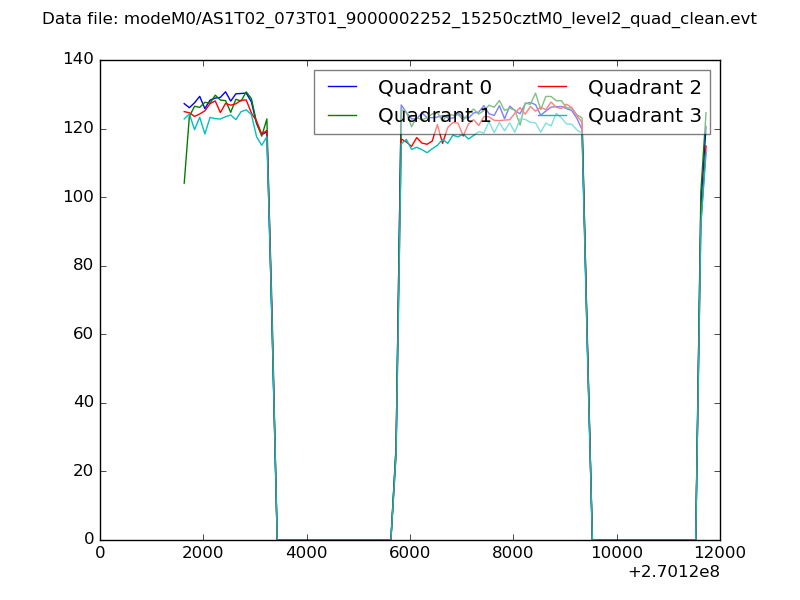 |
|
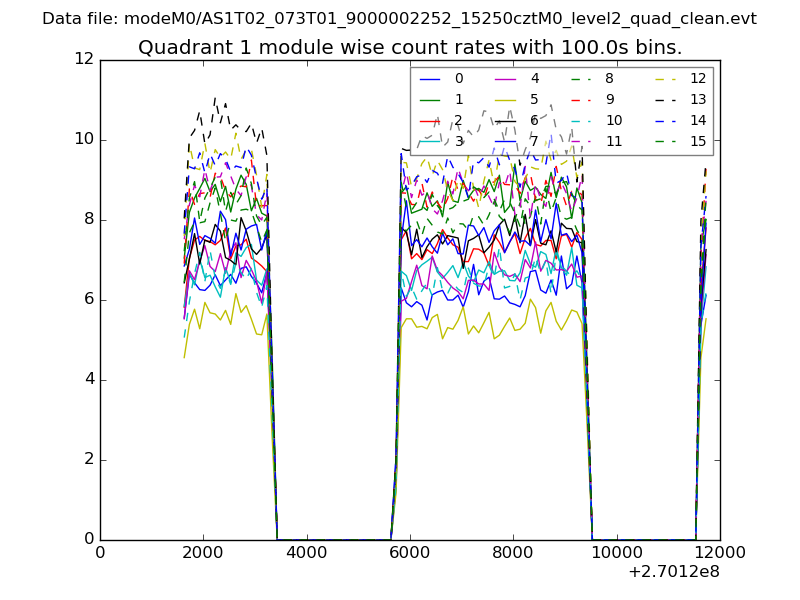
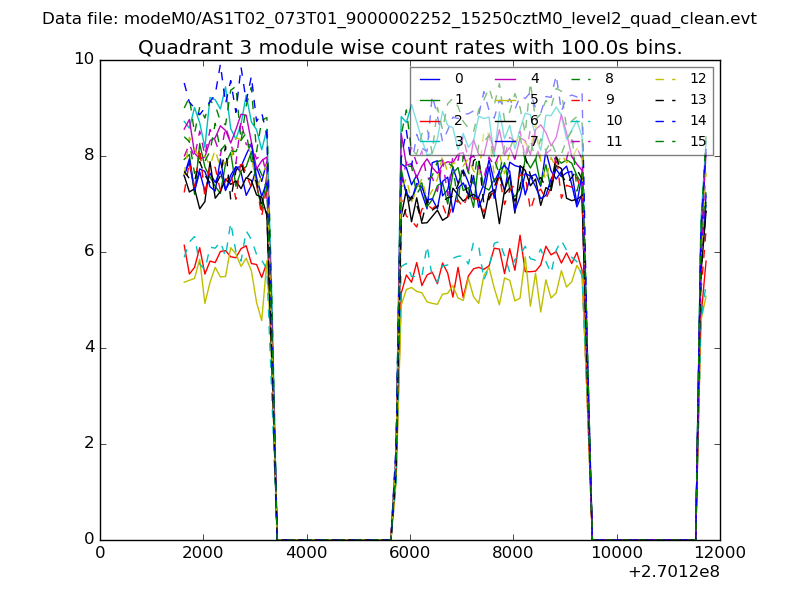
| Module-wise count rates for Quadrant A Data is divided into 100 sec bins |
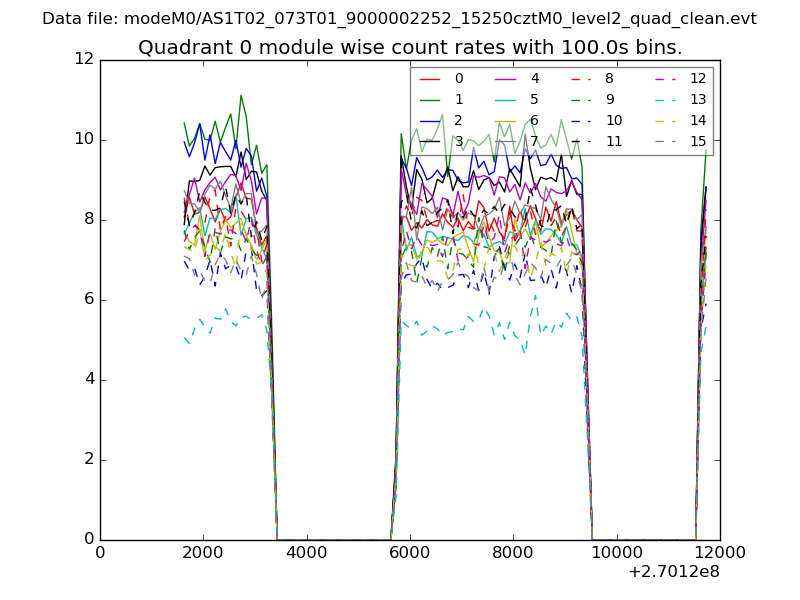 |
 |
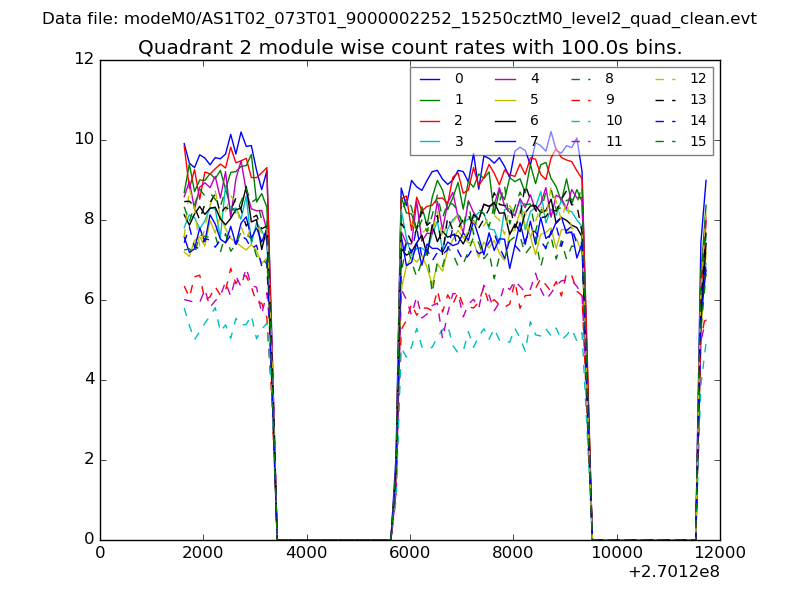
| Module-wise count rates for Quadrant B Data is divided into 100 sec bins |
 |
 |
| Module-wise count rates for Quadrant C Data is divided into 100 sec bins |
 |
 |
| Module-wise count rates for Quadrant D Data is divided into 100 sec bins |
 |
 |
| Parameter | Plot |
|---|---|
| CZT HV Monitor | 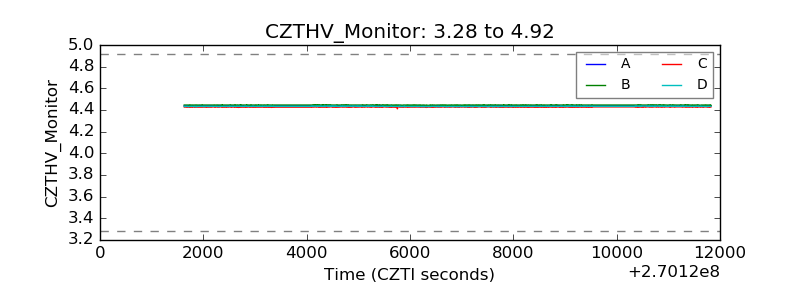 |
| D_VDD | 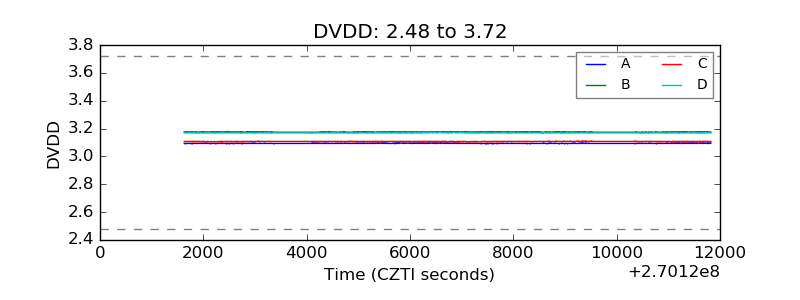 |
| Temperature 1 | 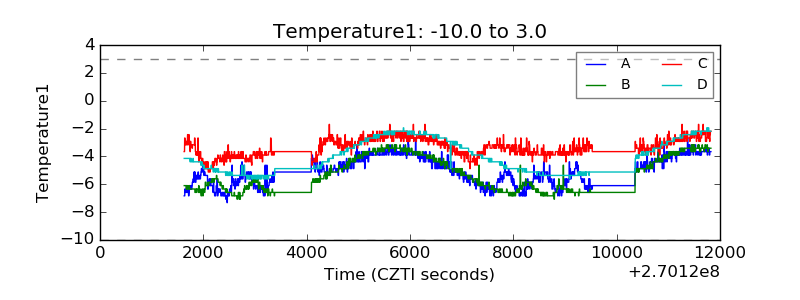 |
| Veto HV Monitor | 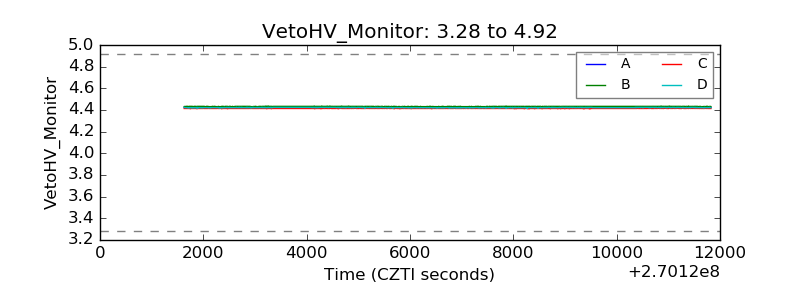 |
| Veto LLD | 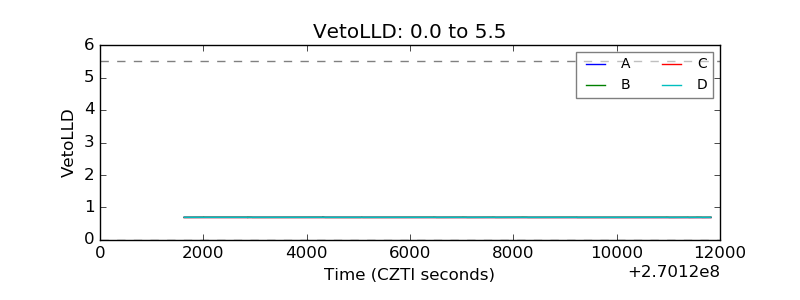 |
| Alpha Counter | 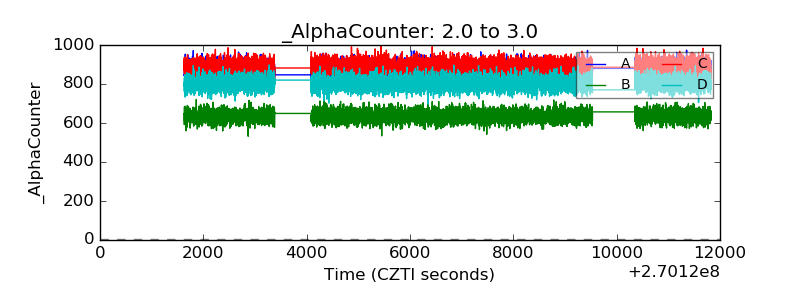 |
| _CPM_Rate | 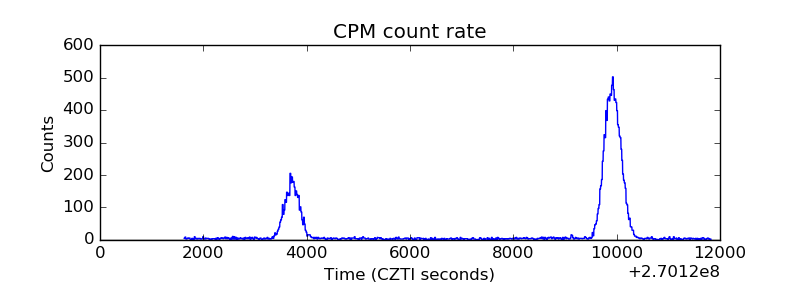 |
| CZT Counter | 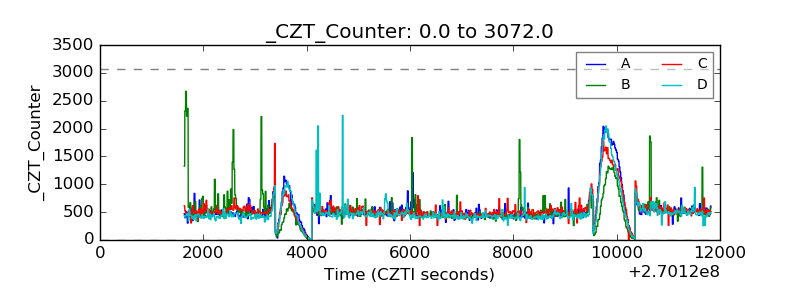 |
| +2.5 Volts monitor |  |
| +5 Volts monitor |  |
| _ROLL_ROT | 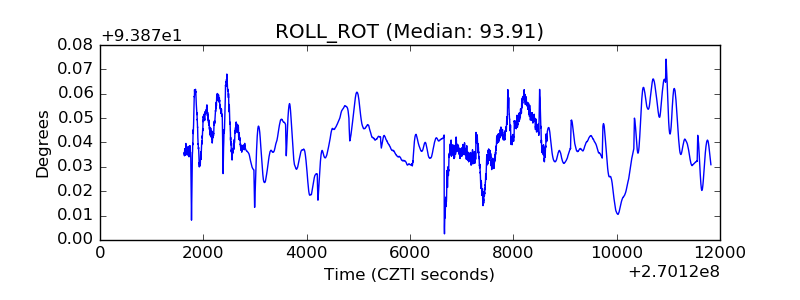 |
| _Roll_DEC | 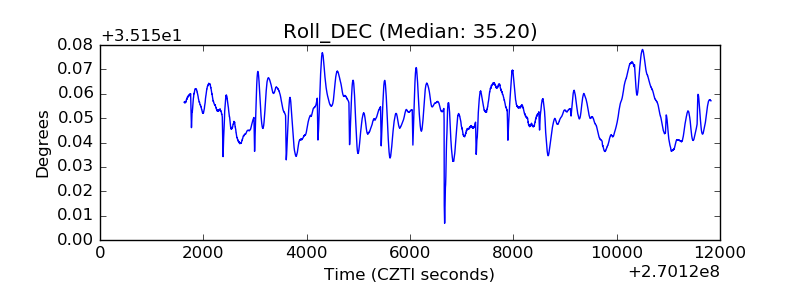 |
| _Roll_RA | 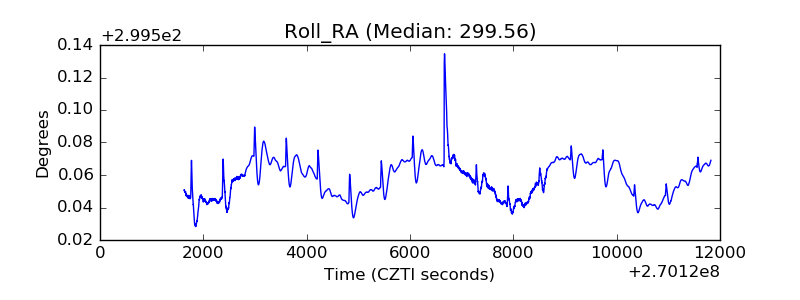 |
| Veto Counter | 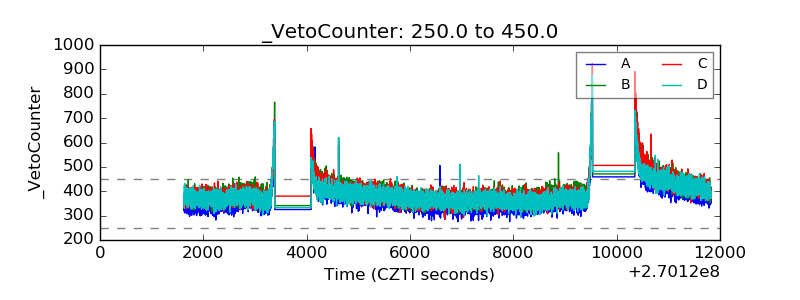 |