| Param | Original file | Final file |
|---|---|---|
| Filename | modeM0/AS1T02_073T01_9000002252_15254cztM0_level2.evt | modeM0/AS1T02_073T01_9000002252_15254cztM0_level2_quad_clean.evt |
| Size (bytes) | 440,066,880 | 107,939,520 |
| Size | 419.7 MB | 102.9 MB |
| Events in quadrant A | 3,033,881 | 716,950 |
| Events in quadrant B | 3,450,800 | 727,595 |
| Events in quadrant C | 3,347,858 | 717,232 |
| Events in quadrant D | 3,086,619 | 687,559 |
| Mode M9 | |||
|---|---|---|---|
| Quadrant | BADHDUFLAG | Total packets | Discarded packets |
| A | 0 | 13 | 0 |
| B | 0 | 13 | 0 |
| C | 0 | 13 | 0 |
| D | 0 | 13 | 0 |
| Mode SS | |||
|---|---|---|---|
| Quadrant | BADHDUFLAG | Total packets | Discarded packets |
| A | 0 | 120 | 0 |
| B | 0 | 120 | 0 |
| C | 0 | 120 | 0 |
| D | 0 | 120 | 0 |
| Mode M0 | |||
|---|---|---|---|
| Quadrant | BADHDUFLAG | Total packets | Discarded packets |
| A | 0 | 12988 | 2 |
| B | 0 | 14306 | 1 |
| C | 0 | 13829 | 1 |
| D | 0 | 13101 | 1 |
| Quadrant | Total seconds | Saturated seconds | Saturation percentage |
|---|---|---|---|
| A | 6016 | 69 | 1.146941% |
| B | 6016 | 162 | 2.692819% |
| C | 6016 | 89 | 1.479388% |
| D | 6016 | 82 | 1.363032% |
Noise dominated data is calculated using 1-second bins in cleaned event files. If a bin has >2000 counts, and if more than 50% of those come from <1% of pixels, then it is considered to be noise-dominated and hence unusable.
| Quadrant | # 1 sec bins | Bins with >0 counts | Bins with >2000 counts | High rate bins dominated by noise | Noise dominated (total time) | Noise dominated (detector-on time) | Marked lightcurve |
|---|---|---|---|---|---|---|---|
| A | 7262 | 6017 | 0 | 0 | 0.00% | 0.00% | 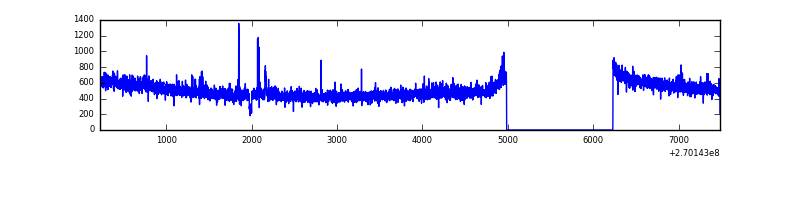 |
| B | 7262 | 6017 | 77 | 77 | 1.06% | 1.28% | 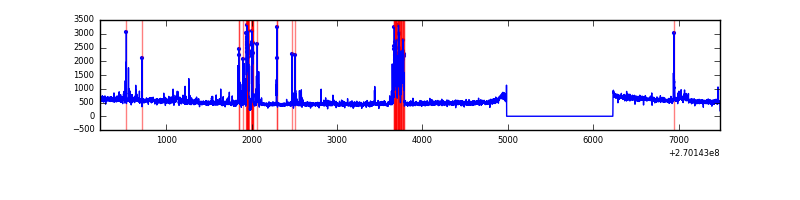 |
| C | 7262 | 6017 | 23 | 23 | 0.32% | 0.38% | 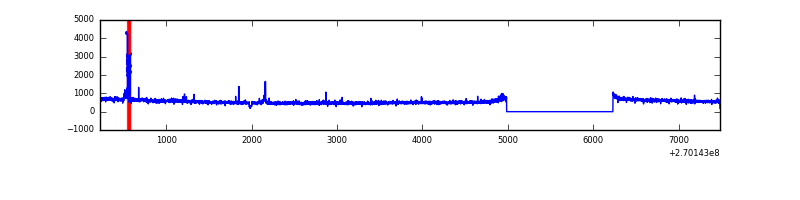 |
| D | 7262 | 6017 | 12 | 12 | 0.17% | 0.20% | 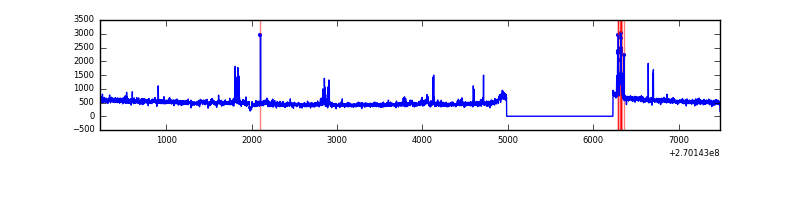 |
Top three noisy pixels from each quadrant. If the there are fewer than three noisy pixels in the level2.evt file, extra rows are filled as -1
| Pixel properties | Quadrant properties | ||||||
|---|---|---|---|---|---|---|---|
| Quadrant | DetID | PixID | Counts | Sigma | Mean | Median | Sigma |
| A | 12 | 189 | 53869 | 341.93 | 776 | 761 | 155.3 |
| A | 0 | 226 | 6783 | 38.77 | 776 | 761 | 155.3 |
| A | 12 | 194 | 5738 | 32.04 | 776 | 761 | 155.3 |
| B | 10 | 16 | 252386 | 1742.36 | 772 | 754 | 144.4 |
| B | 10 | 245 | 138127 | 951.2 | 772 | 754 | 144.4 |
| B | 0 | 214 | 20006 | 133.3 | 772 | 754 | 144.4 |
| C | 3 | 233 | 253911 | 1449.34 | 765 | 772 | 174.7 |
| C | 14 | 234 | 70947 | 401.79 | 765 | 772 | 174.7 |
| C | 4 | 254 | 41316 | 232.13 | 765 | 772 | 174.7 |
| D | 2 | 33 | 124678 | 679.44 | 763 | 742 | 182.4 |
| D | 13 | 122 | 39074 | 210.14 | 763 | 742 | 182.4 |
| D | 2 | 234 | 20420 | 107.88 | 763 | 742 | 182.4 |
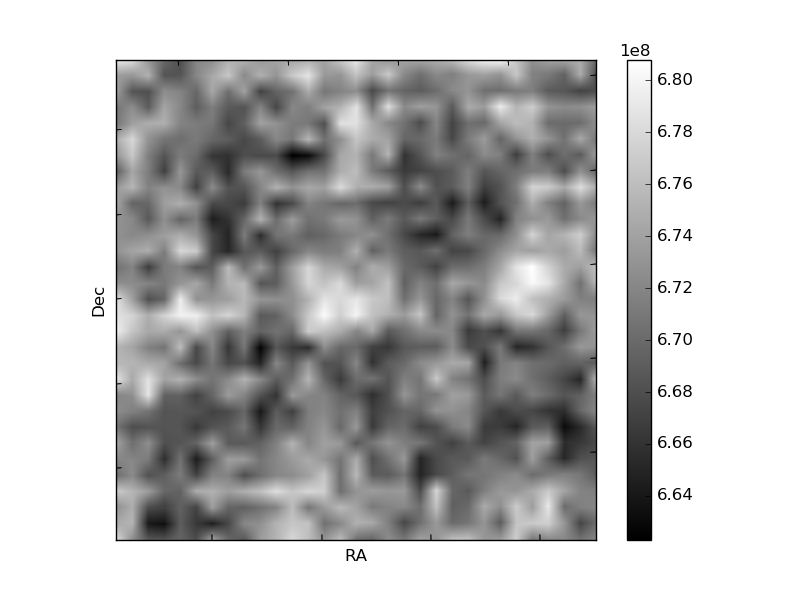
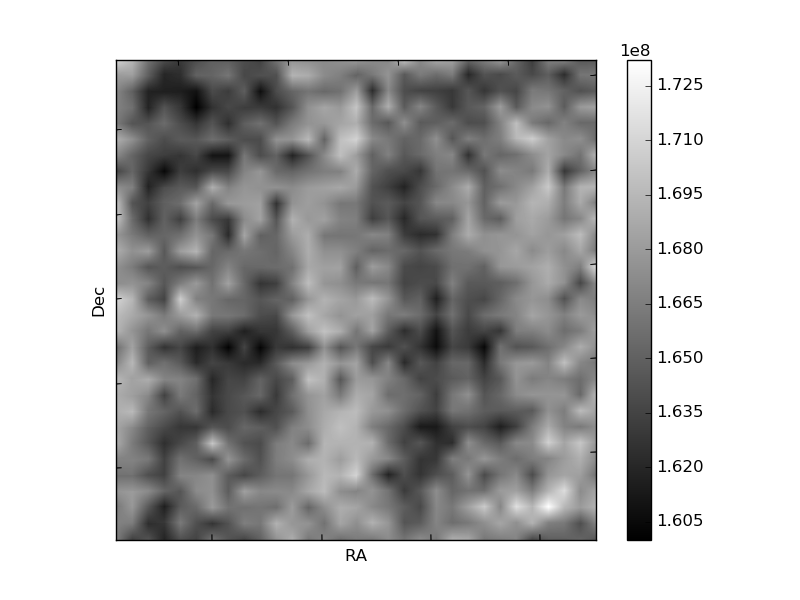
Histogram calculated using DETX and DETY for each event in the final _common_clean file
| Quadrant A | 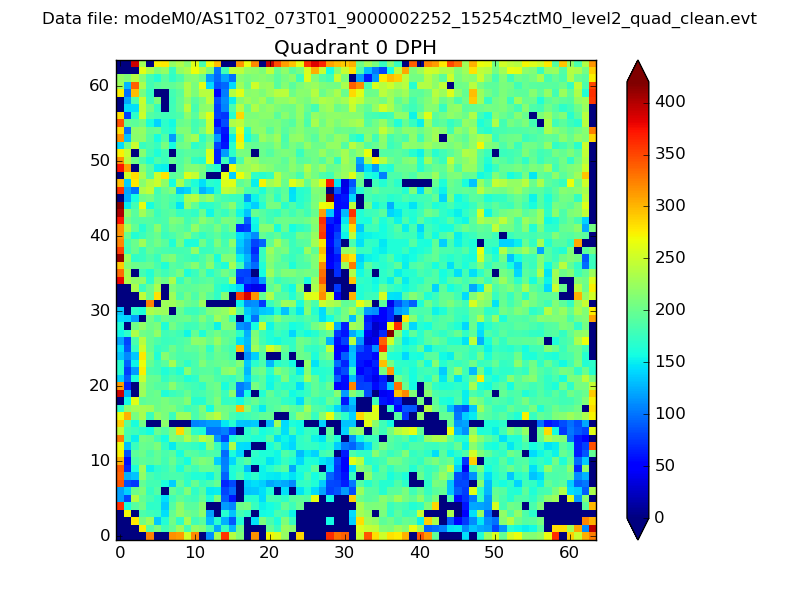 |
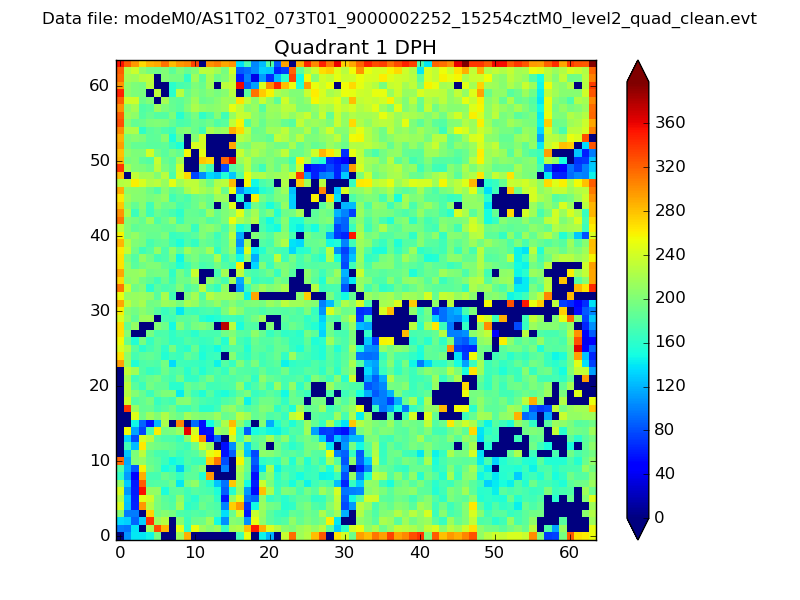 |
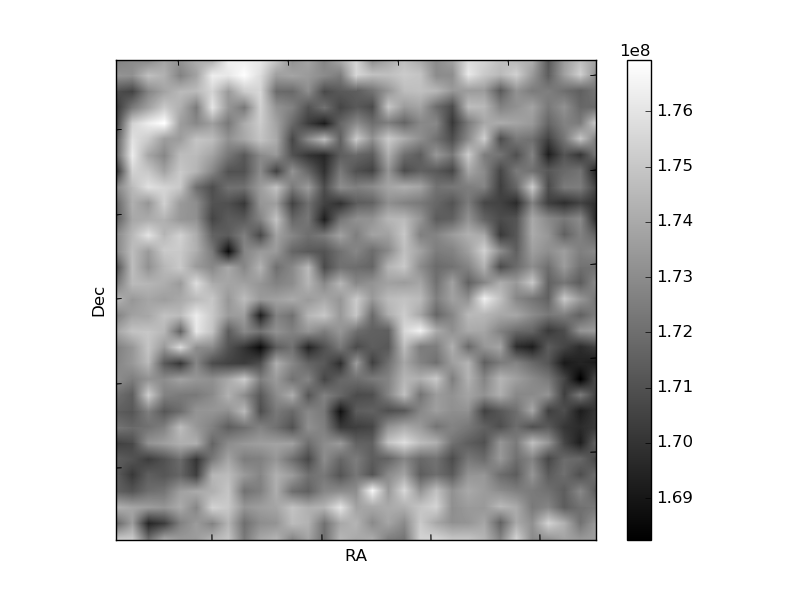
Quadrant B |
|---|---|---|---|
| Quadrant D | 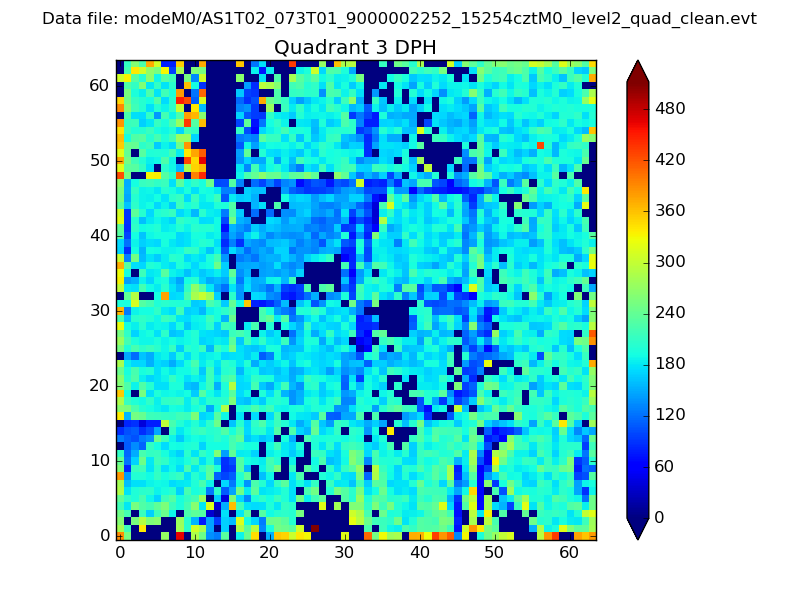 |
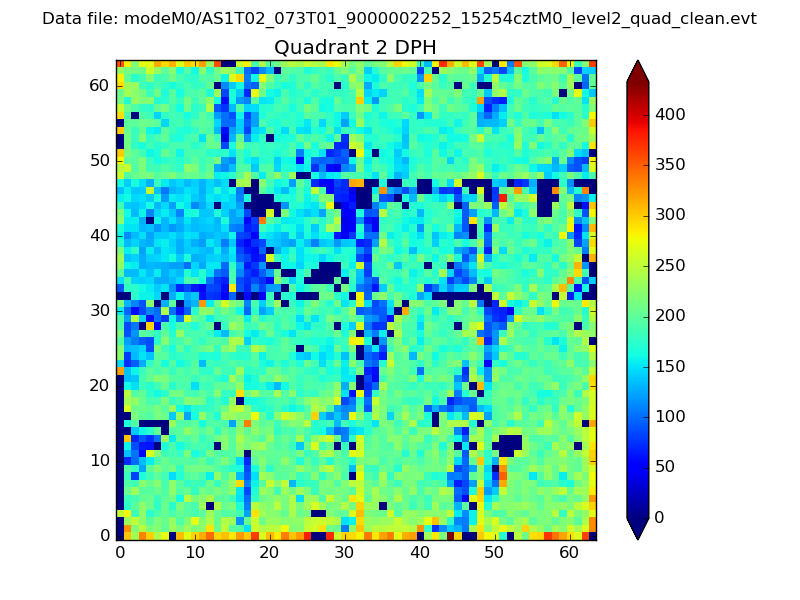 |
Quadrant C |
| Plot type | Count rate plots | Images |
|---|---|---|
| Comparison with Poisson distribution Blue bars denote a histogram of data divided into 1 sec bins. Red curve is a Poisson curve with rate = median count rate of data. |
 |
 |
| Quadrant-wise count rates Data is divided into 100 sec bins |
 |
|
| Module-wise count rates for Quadrant A Data is divided into 100 sec bins |
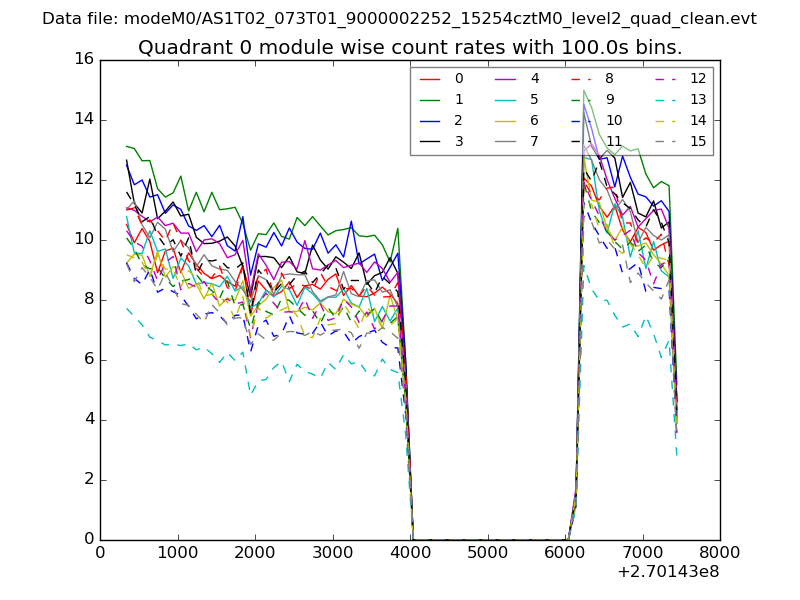 |
 |
| Module-wise count rates for Quadrant B Data is divided into 100 sec bins |
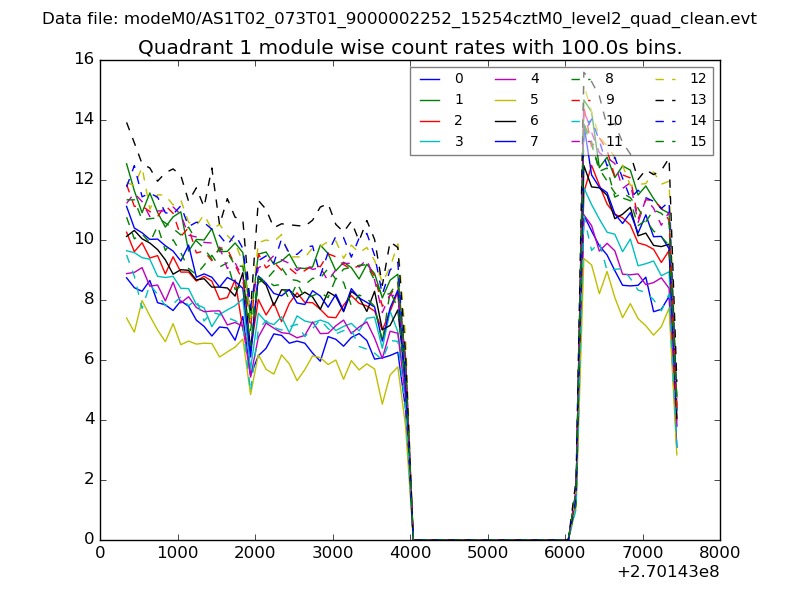 |
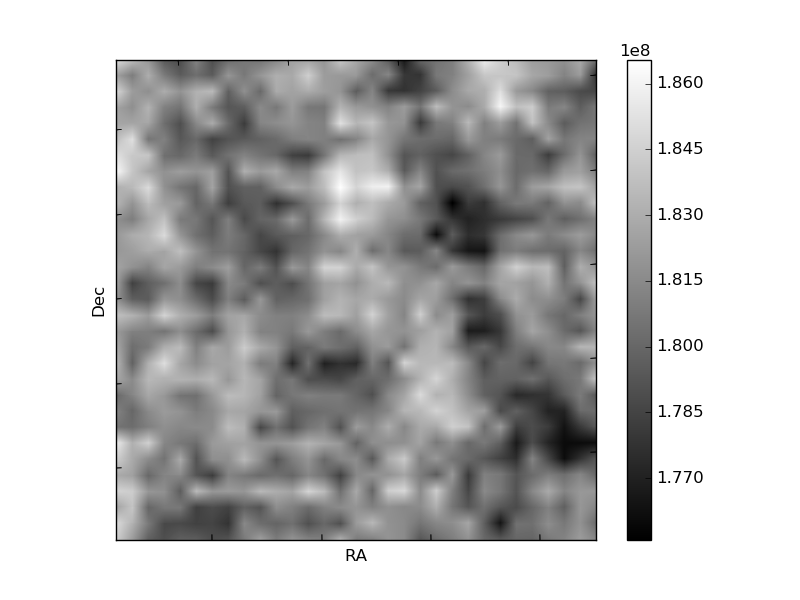 |
| Module-wise count rates for Quadrant C Data is divided into 100 sec bins |
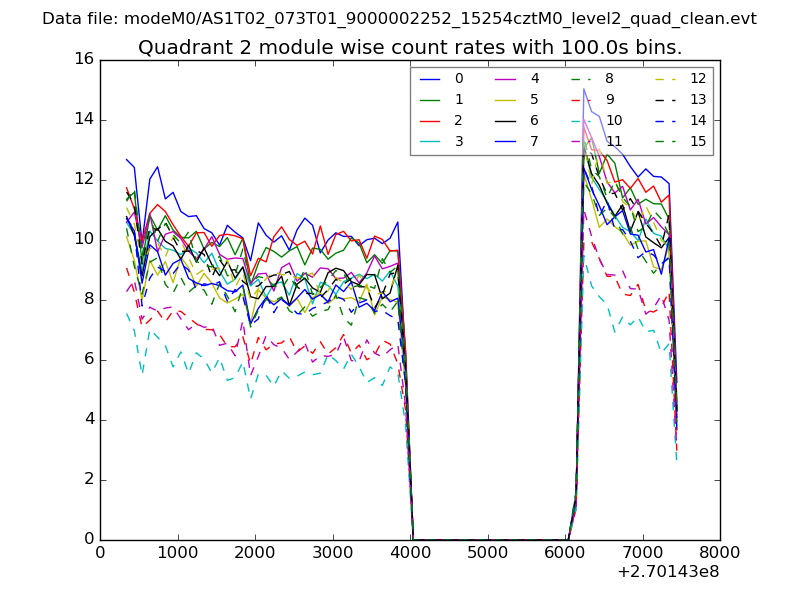 |
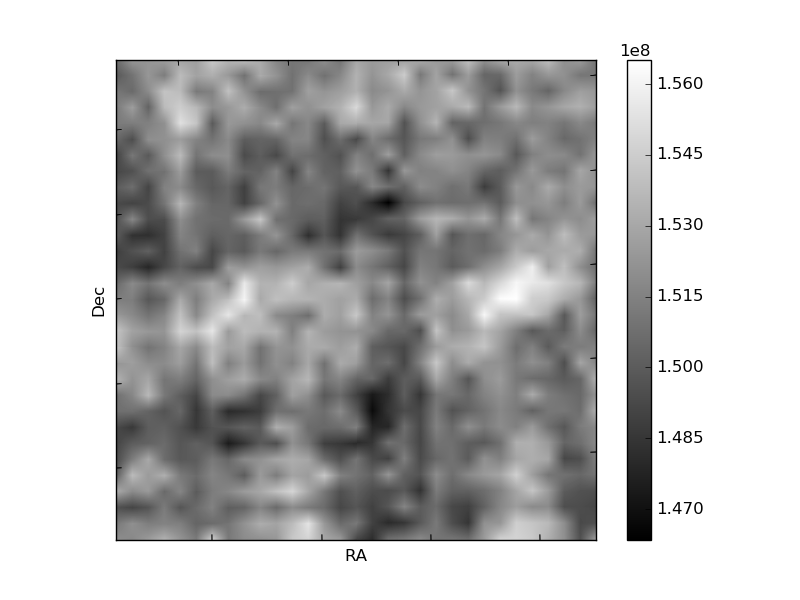 |
| Module-wise count rates for Quadrant D Data is divided into 100 sec bins |
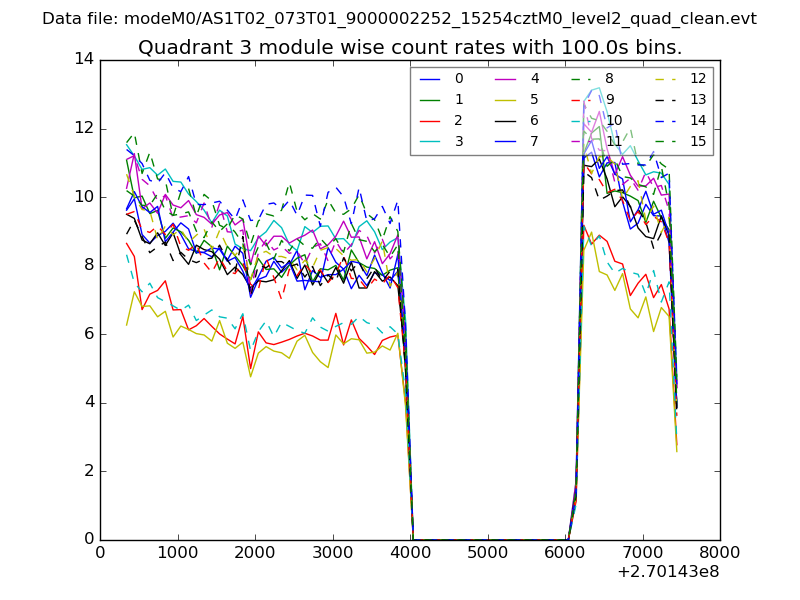 |
 |
| Parameter | Plot |
|---|---|
| CZT HV Monitor | 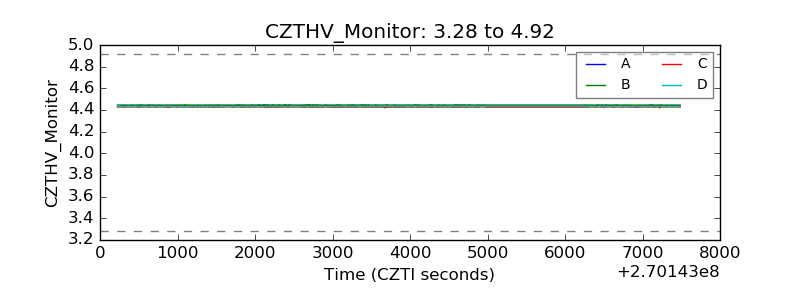 |
| D_VDD | 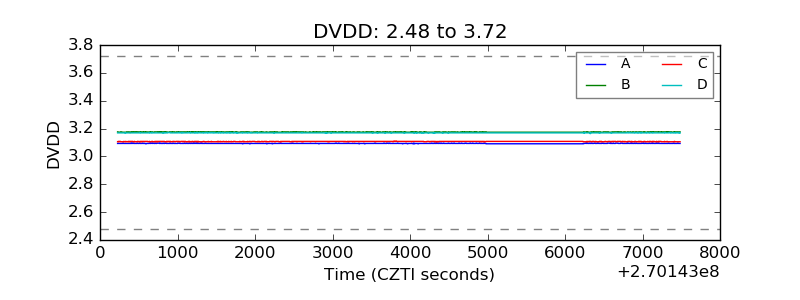 |
| Temperature 1 | 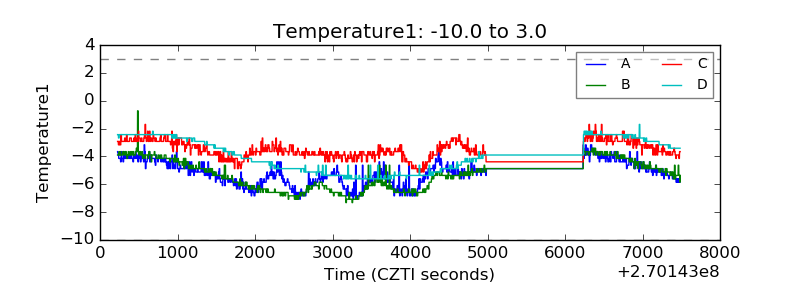 |
| Veto HV Monitor | 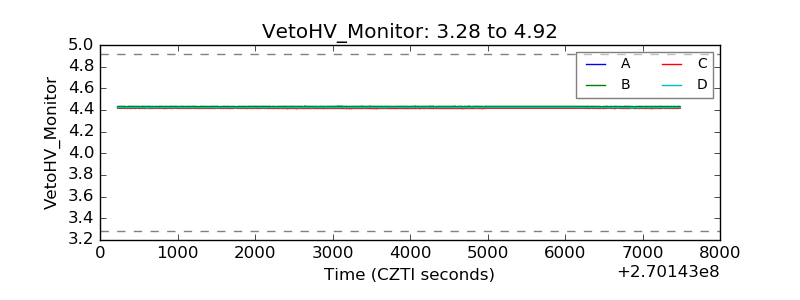 |
| Veto LLD | 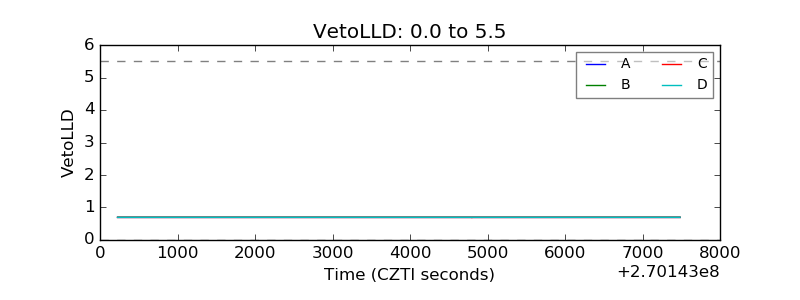 |
| Alpha Counter |  |
| _CPM_Rate | 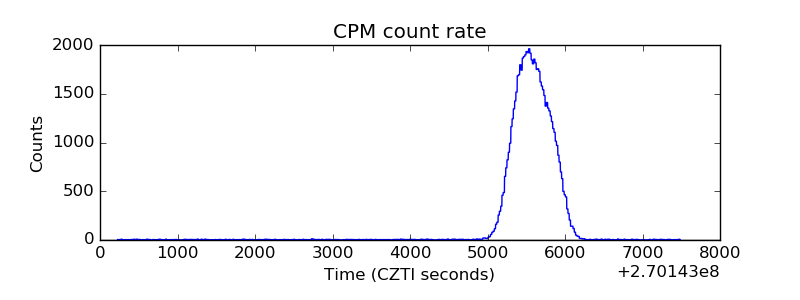 |
| CZT Counter | 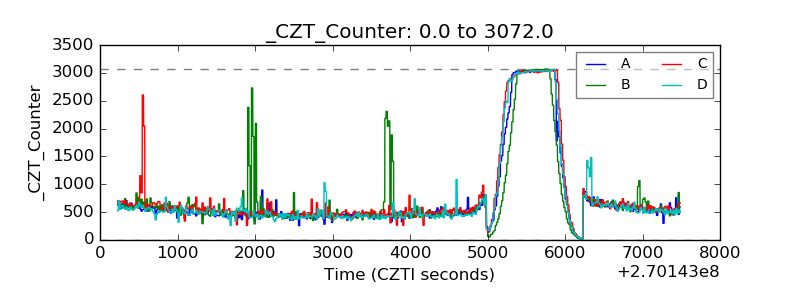 |
| +2.5 Volts monitor |  |
| +5 Volts monitor |  |
| _ROLL_ROT | 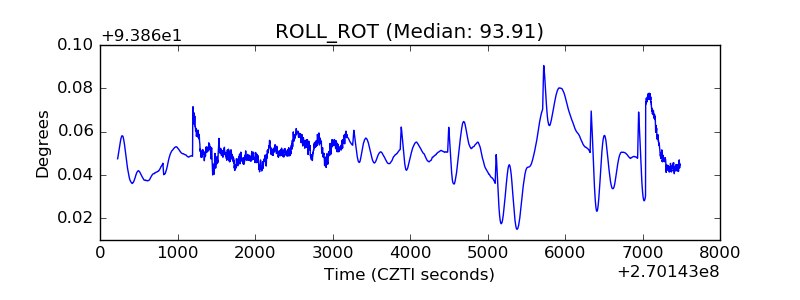 |
| _Roll_DEC | 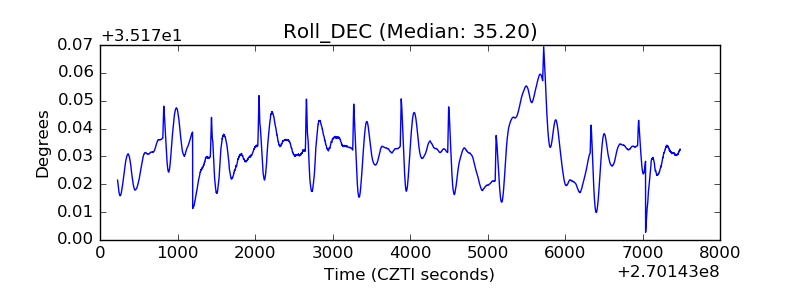 |
| _Roll_RA | 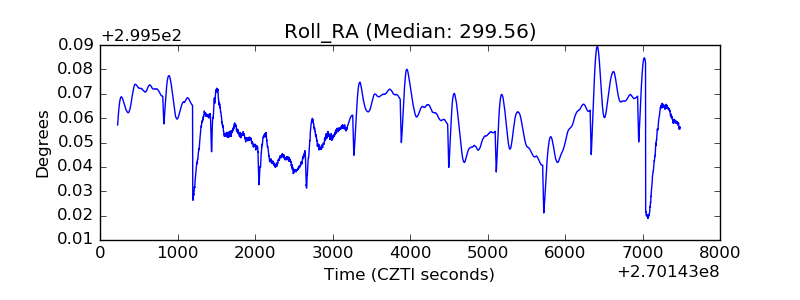 |
| Veto Counter | 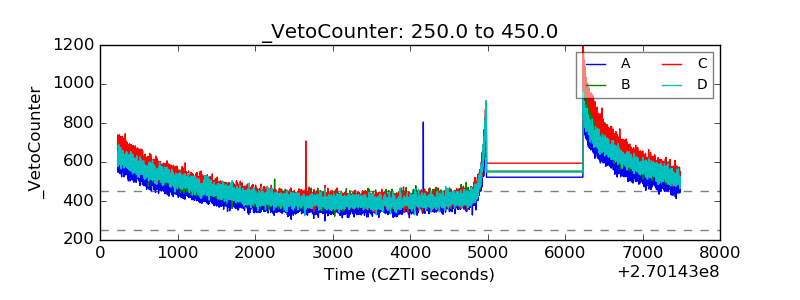 |