| Param | Original file | Final file |
|---|---|---|
| Filename | modeM0/AS1A04_207T01_9000002254cztM0_level2.fits | modeM0/AS1A04_207T01_9000002254cztM0_level2_quad_clean.evt |
| Size (bytes) | 896,158,080 | 838,569,600 |
| Size | 854.6 MB | 799.7 MB |
| Events in quadrant A | 5,446,638 | 4,935,683 |
| Events in quadrant B | 5,191,182 | 4,854,863 |
| Events in quadrant C | 5,337,856 | 4,754,020 |
| Events in quadrant D | 4,651,832 | 4,339,490 |
| Mode SS | |||
|---|---|---|---|
| Quadrant | BADHDUFLAG | Total packets | Discarded packets |
| A | 0 | 1936 | 0 |
| B | 0 | 1936 | 0 |
| C | 0 | 1936 | 0 |
| D | 0 | 1936 | 0 |
| Mode M0 | |||
|---|---|---|---|
| Quadrant | BADHDUFLAG | Total packets | Discarded packets |
| A | 0 | 201771 | 0 |
| B | 0 | 217834 | 0 |
| C | 0 | 213276 | 0 |
| D | 0 | 212018 | 0 |
| Mode M9 | |||
|---|---|---|---|
| Quadrant | BADHDUFLAG | Total packets | Discarded packets |
| A | 0 | 131 | 0 |
| B | 0 | 131 | 0 |
| C | 0 | 131 | 0 |
| D | 0 | 131 | 0 |
| Quadrant | Total seconds | Saturated seconds | Saturation percentage |
|---|---|---|---|
| A | 94998 | 966 | 1.016864% |
| B | 95001 | 2481 | 2.611551% |
| C | 95001 | 824 | 0.867359% |
| D | 95000 | 1848 | 1.945263% |
Noise dominated data is calculated using 1-second bins in cleaned event files. If a bin has >2000 counts, and if more than 50% of those come from <1% of pixels, then it is considered to be noise-dominated and hence unusable.
| Quadrant | # 1 sec bins | Bins with >0 counts | Bins with >2000 counts | High rate bins dominated by noise | Noise dominated (total time) | Noise dominated (detector-on time) | Marked lightcurve |
|---|---|---|---|---|---|---|---|
| A | 108203 | 94984 | 0 | 0 | 0.00% | 0.00% |  |
| B | 108203 | 94924 | 0 | 0 | 0.00% | 0.00% |  |
| C | 108203 | 94988 | 0 | 0 | 0.00% | 0.00% |  |
| D | 108203 | 94971 | 0 | 0 | 0.00% | 0.00% |  |
Top three noisy pixels from each quadrant. If the there are fewer than three noisy pixels in the level2.evt file, extra rows are filled as -1
| Pixel properties | Quadrant properties | ||||||
|---|---|---|---|---|---|---|---|
| Quadrant | DetID | PixID | Counts | Sigma | Mean | Median | Sigma |
| A | 0 | 29 | 5359 | 11.61 | 1417 | 1326 | 347.3 |
| A | 7 | 110 | 4527 | 9.22 | 1417 | 1326 | 347.3 |
| A | 0 | 30 | 4129 | 8.07 | 1417 | 1326 | 347.3 |
| B | 2 | 9 | 4061 | 10.25 | 1373 | 1308 | 268.7 |
| B | 3 | 17 | 3514 | 8.21 | 1373 | 1308 | 268.7 |
| B | 2 | 8 | 3462 | 8.02 | 1373 | 1308 | 268.7 |
| C | 12 | 241 | 3827 | 6.92 | 1410 | 1307 | 364.3 |
| C | 2 | 191 | 3590 | 6.27 | 1410 | 1307 | 364.3 |
| C | 3 | 126 | 3514 | 6.06 | 1410 | 1307 | 364.3 |
| D | 3 | 14 | 3454 | 6.31 | 1325 | 1200 | 356.9 |
| D | 6 | 231 | 3350 | 6.02 | 1325 | 1200 | 356.9 |
| D | 3 | 31 | 3273 | 5.81 | 1325 | 1200 | 356.9 |
Histogram calculated using DETX and DETY for each event in the final _common_clean file
| Quadrant A | 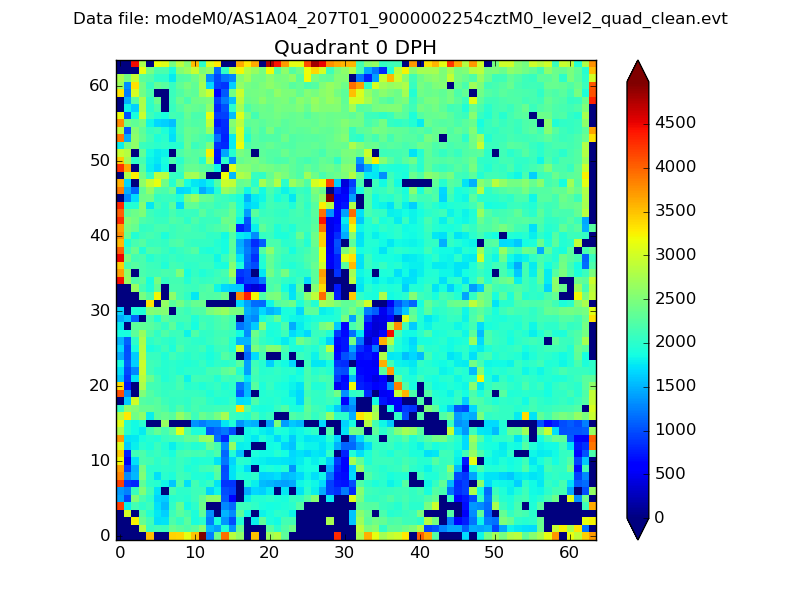 |
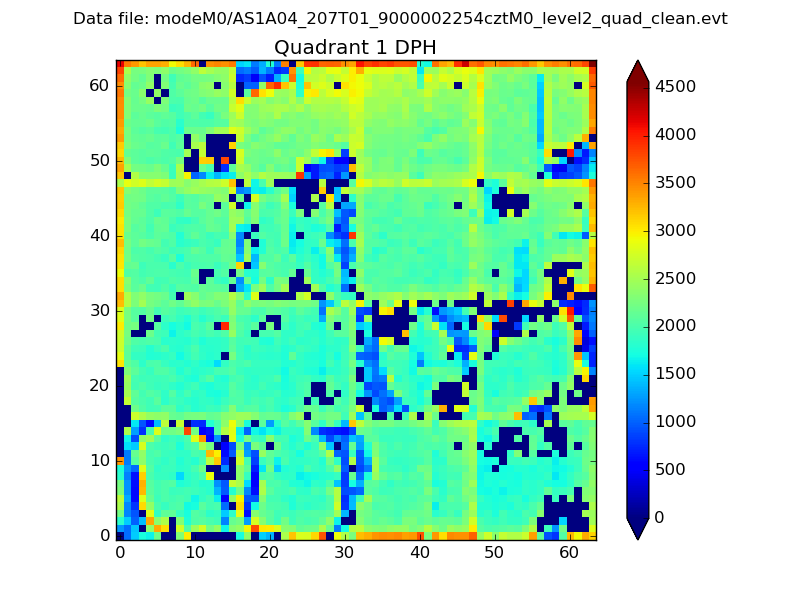 |
Quadrant B |
|---|---|---|---|
| Quadrant D | 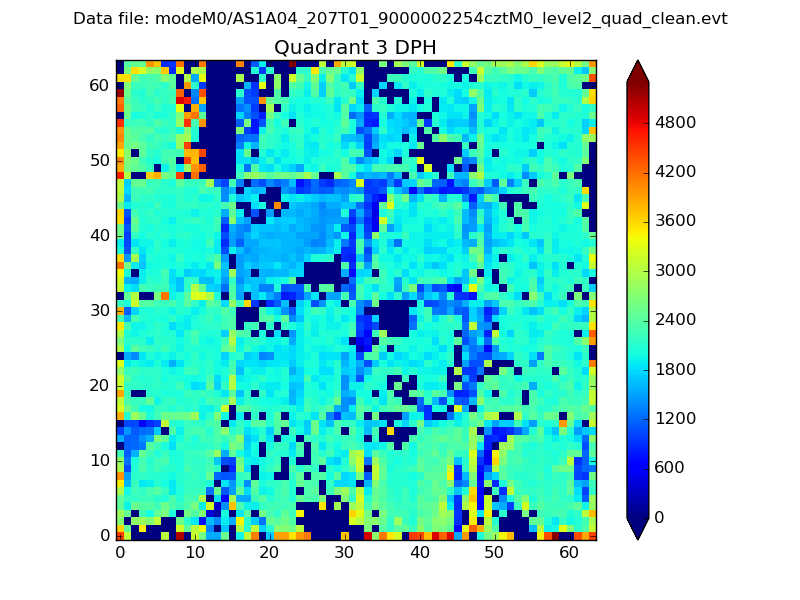 |
 |
Quadrant C |
| Plot type | Count rate plots | Images |
|---|---|---|
| Comparison with Poisson distribution Blue bars denote a histogram of data divided into 1 sec bins. Red curve is a Poisson curve with rate = median count rate of data. |
 |
 |
| Quadrant-wise count rates Data is divided into 100 sec bins |
 |
|
| Module-wise count rates for Quadrant A Data is divided into 100 sec bins |
 |
 |
| Module-wise count rates for Quadrant B Data is divided into 100 sec bins |
 |
 |
| Module-wise count rates for Quadrant C Data is divided into 100 sec bins |
 |
 |
| Module-wise count rates for Quadrant D Data is divided into 100 sec bins |
 |
 |
| Parameter | Plot |
|---|---|
| CZT HV Monitor |  |
| D_VDD |  |
| Temperature 1 |  |
| Veto HV Monitor |  |
| Veto LLD |  |
| Alpha Counter |  |
| _CPM_Rate | 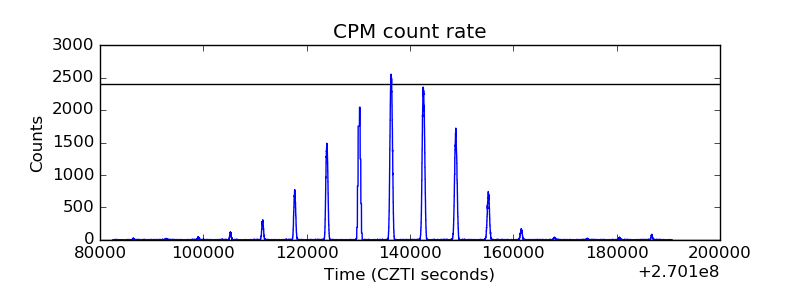 |
| CZT Counter |  |
| +2.5 Volts monitor |  |
| +5 Volts monitor |  |
| _ROLL_ROT |  |
| _Roll_DEC |  |
| _Roll_RA |  |
| Veto Counter |  |