| Param | Original file | Final file |
|---|---|---|
| Filename | modeM0/AS1A04_207T01_9000002254_15260cztM0_level2.evt | modeM0/AS1A04_207T01_9000002254_15260cztM0_level2_quad_clean.evt |
| Size (bytes) | 382,740,480 | 68,973,120 |
| Size | 365.0 MB | 65.8 MB |
| Events in quadrant A | 2,642,121 | 429,024 |
| Events in quadrant B | 3,000,847 | 430,461 |
| Events in quadrant C | 2,911,984 | 435,478 |
| Events in quadrant D | 2,666,729 | 413,435 |
| Mode SS | |||
|---|---|---|---|
| Quadrant | BADHDUFLAG | Total packets | Discarded packets |
| A | 0 | 112 | 0 |
| B | 0 | 112 | 0 |
| C | 0 | 112 | 0 |
| D | 0 | 112 | 0 |
| Mode M0 | |||
|---|---|---|---|
| Quadrant | BADHDUFLAG | Total packets | Discarded packets |
| A | 0 | 11393 | 2 |
| B | 0 | 12362 | 1 |
| C | 0 | 11969 | 1 |
| D | 0 | 11683 | 1 |
| Mode M9 | |||
|---|---|---|---|
| Quadrant | BADHDUFLAG | Total packets | Discarded packets |
| A | 0 | 3 | 0 |
| B | 0 | 3 | 0 |
| C | 0 | 3 | 0 |
| D | 0 | 3 | 0 |
| Quadrant | Total seconds | Saturated seconds | Saturation percentage |
|---|---|---|---|
| A | 5424 | 20 | 0.368732% |
| B | 5424 | 130 | 2.396755% |
| C | 5424 | 30 | 0.553097% |
| D | 5424 | 39 | 0.719027% |
Noise dominated data is calculated using 1-second bins in cleaned event files. If a bin has >2000 counts, and if more than 50% of those come from <1% of pixels, then it is considered to be noise-dominated and hence unusable.
| Quadrant | # 1 sec bins | Bins with >0 counts | Bins with >2000 counts | High rate bins dominated by noise | Noise dominated (total time) | Noise dominated (detector-on time) | Marked lightcurve |
|---|---|---|---|---|---|---|---|
| A | 5780 | 5426 | 1 | 1 | 0.02% | 0.02% | 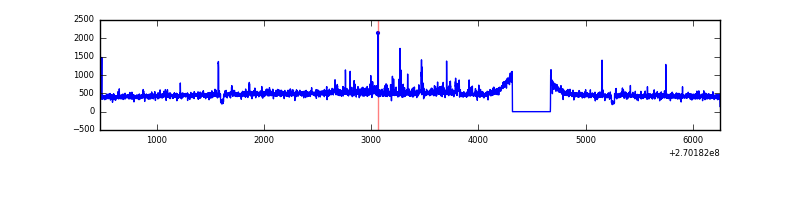 |
| B | 5780 | 5426 | 78 | 78 | 1.35% | 1.44% | 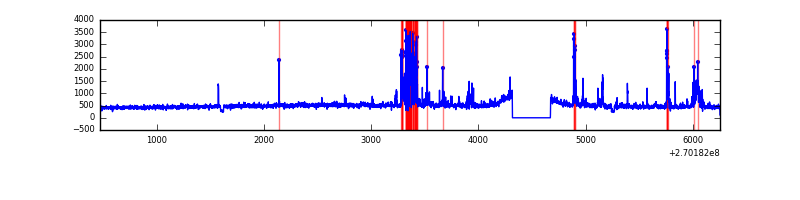 |
| C | 5780 | 5426 | 2 | 2 | 0.03% | 0.04% | 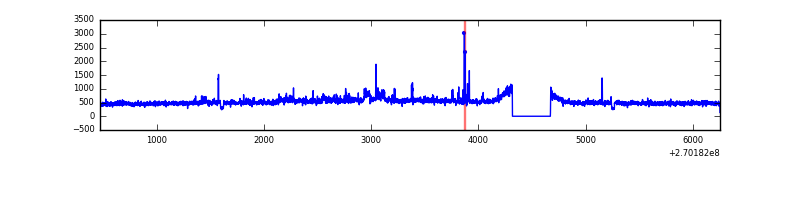 |
| D | 5780 | 5426 | 25 | 25 | 0.43% | 0.46% | 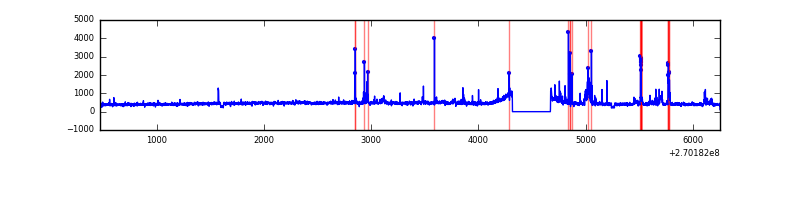 |
Top three noisy pixels from each quadrant. If the there are fewer than three noisy pixels in the level2.evt file, extra rows are filled as -1
| Pixel properties | Quadrant properties | ||||||
|---|---|---|---|---|---|---|---|
| Quadrant | DetID | PixID | Counts | Sigma | Mean | Median | Sigma |
| A | 12 | 189 | 90048 | 666.8 | 652 | 637 | 134.1 |
| A | 9 | 143 | 17671 | 127.03 | 652 | 637 | 134.1 |
| A | 0 | 253 | 15192 | 108.55 | 652 | 637 | 134.1 |
| B | 10 | 16 | 323741 | 2563.42 | 650 | 635 | 126.0 |
| B | 4 | 48 | 43614 | 340.98 | 650 | 635 | 126.0 |
| B | 0 | 190 | 21016 | 161.7 | 650 | 635 | 126.0 |
| C | 3 | 233 | 385866 | 2605.72 | 633 | 636 | 147.8 |
| C | 4 | 254 | 52745 | 352.47 | 633 | 636 | 147.8 |
| C | 13 | 61 | 4695 | 27.46 | 633 | 636 | 147.8 |
| D | 13 | 172 | 120442 | 770.4 | 631 | 611 | 155.5 |
| D | 2 | 33 | 95748 | 611.64 | 631 | 611 | 155.5 |
| D | 2 | 234 | 20443 | 127.5 | 631 | 611 | 155.5 |
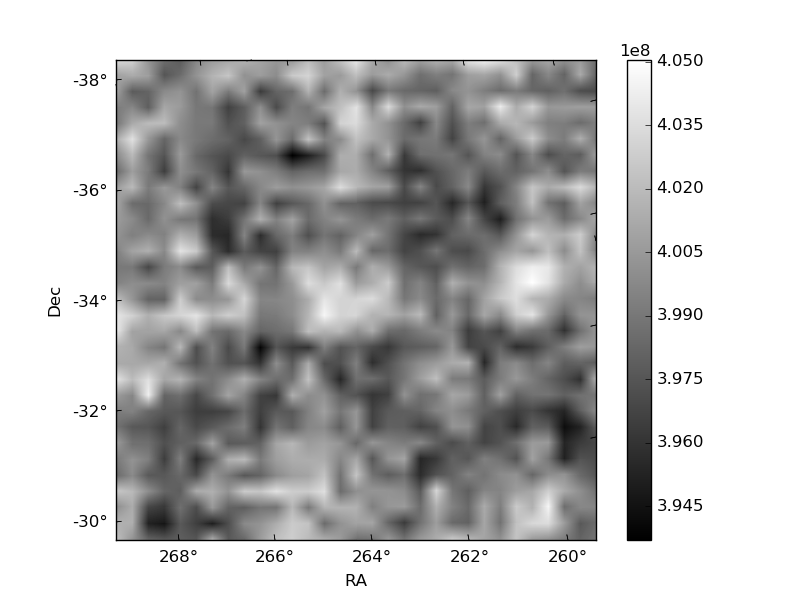
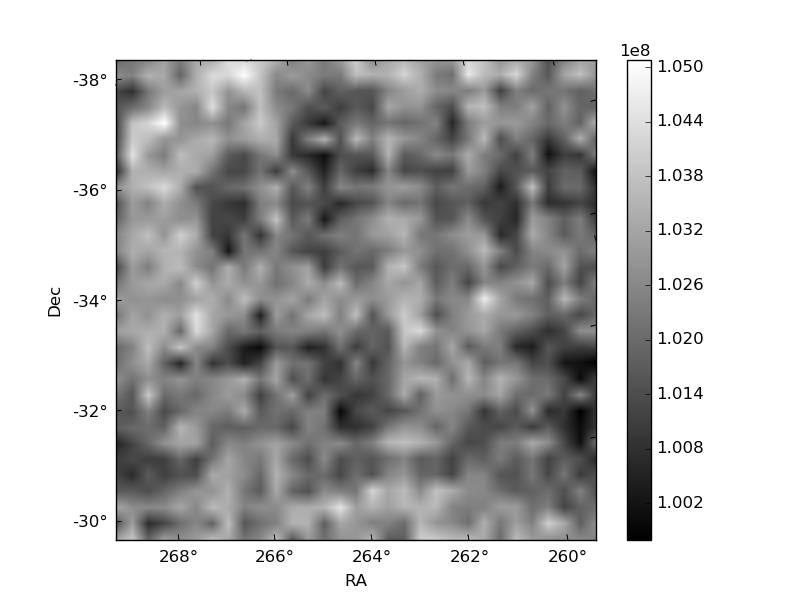
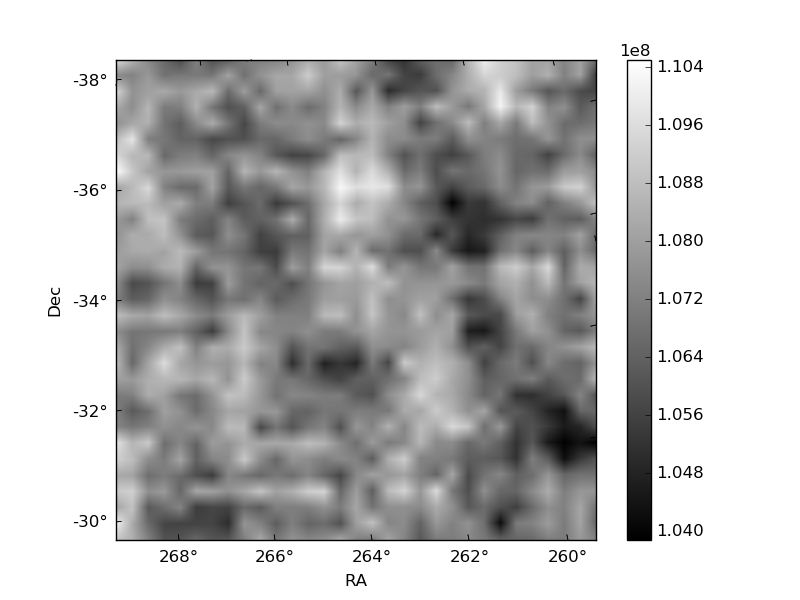
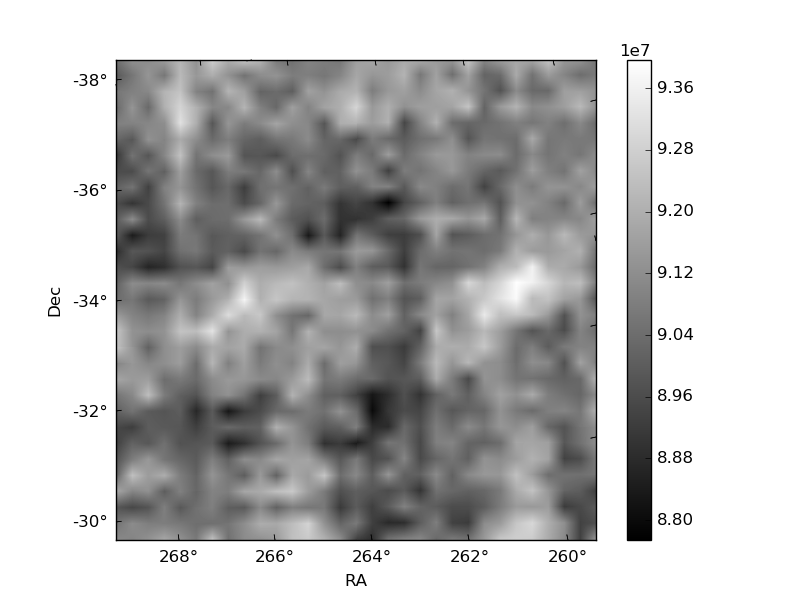
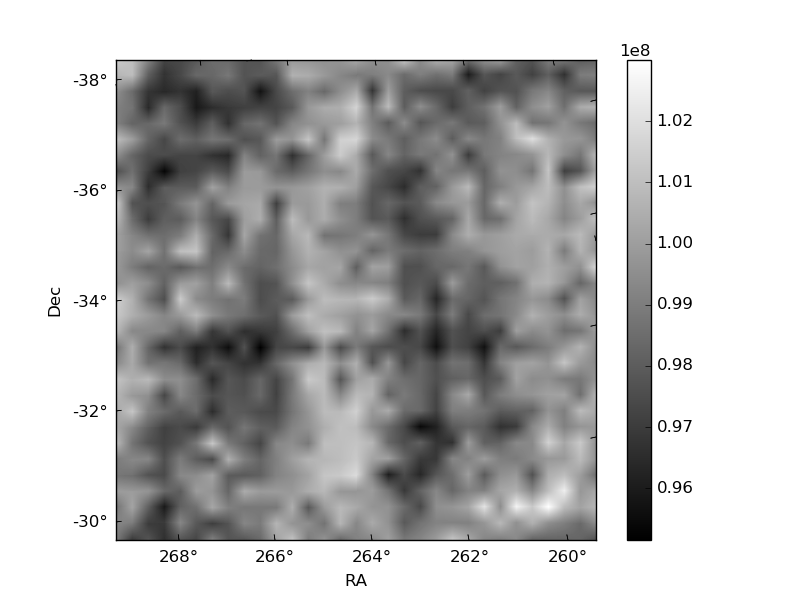
Histogram calculated using DETX and DETY for each event in the final _common_clean file
| Quadrant A | 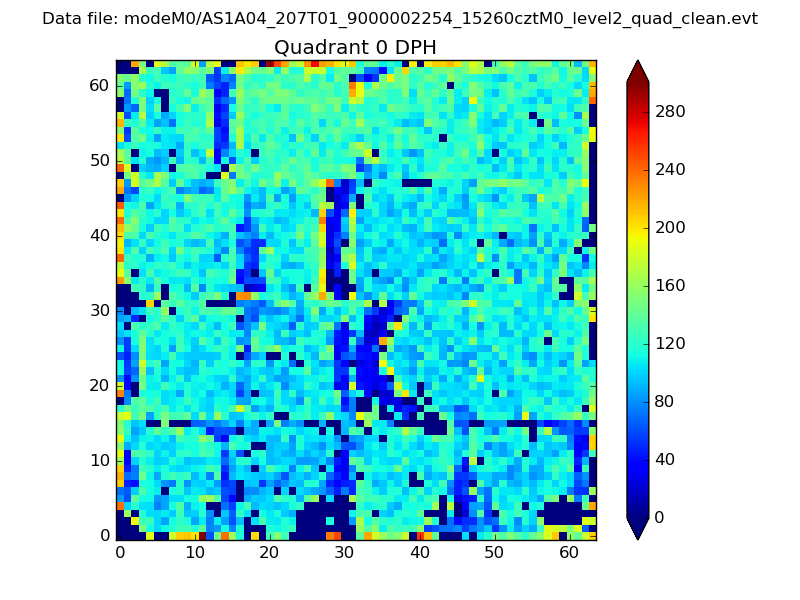 |
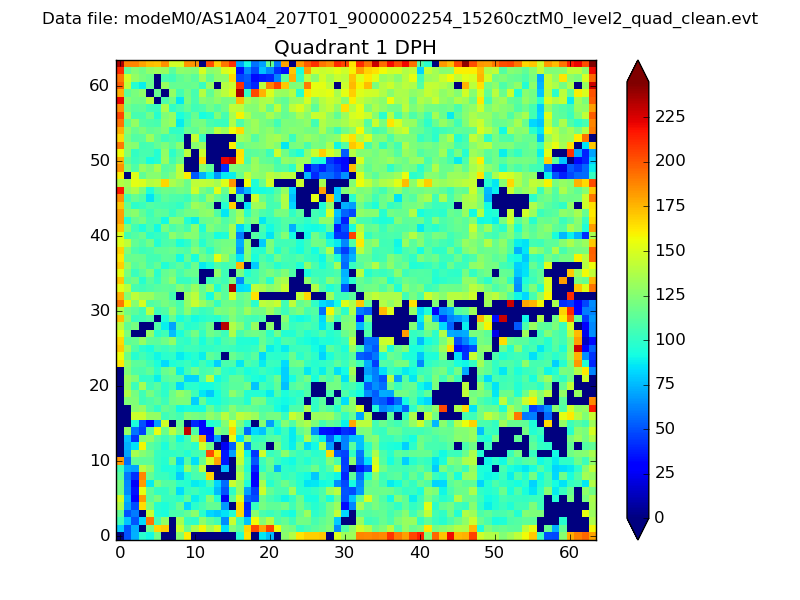 |
Quadrant B |
|---|---|---|---|
| Quadrant D | 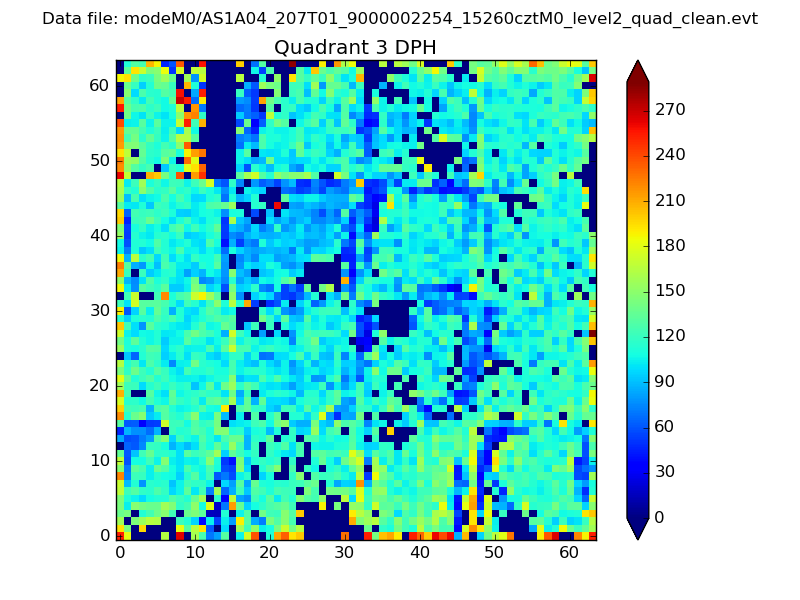 |
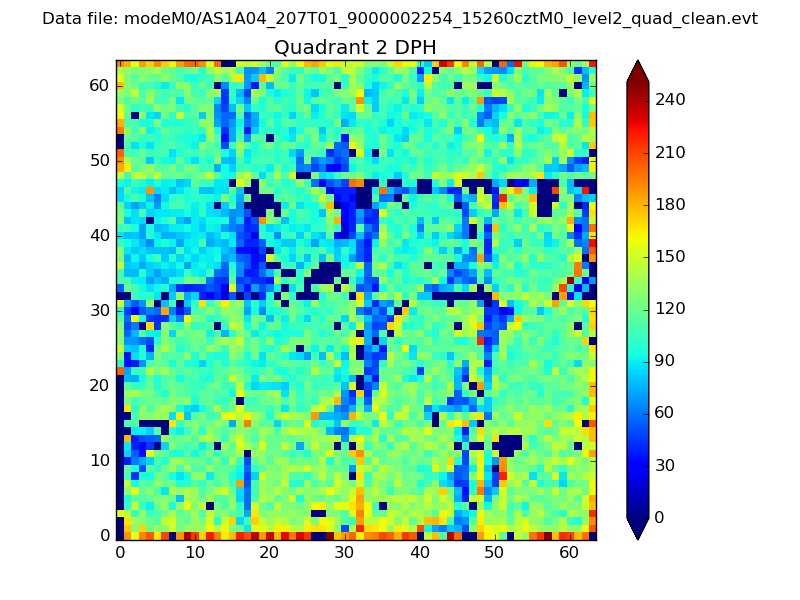 |
Quadrant C |
| Plot type | Count rate plots | Images |
|---|---|---|
| Comparison with Poisson distribution Blue bars denote a histogram of data divided into 1 sec bins. Red curve is a Poisson curve with rate = median count rate of data. |
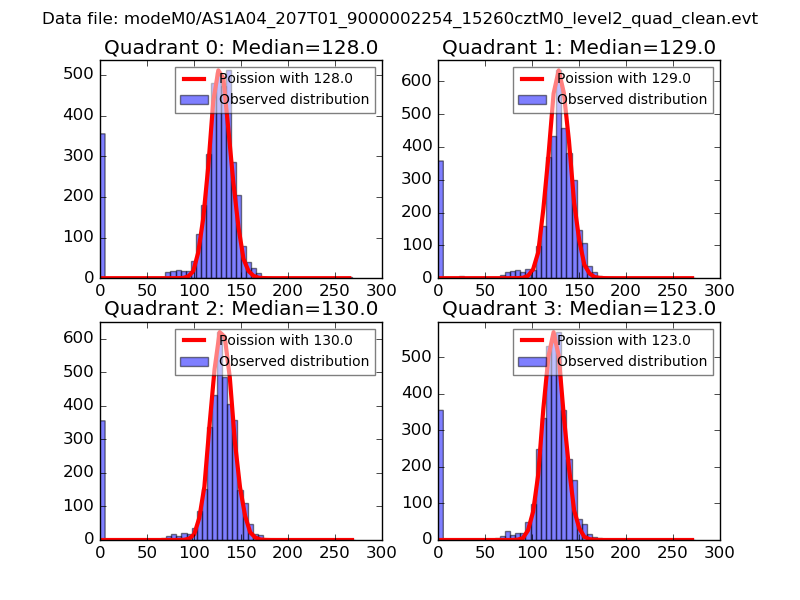 |
 |
| Quadrant-wise count rates Data is divided into 100 sec bins |
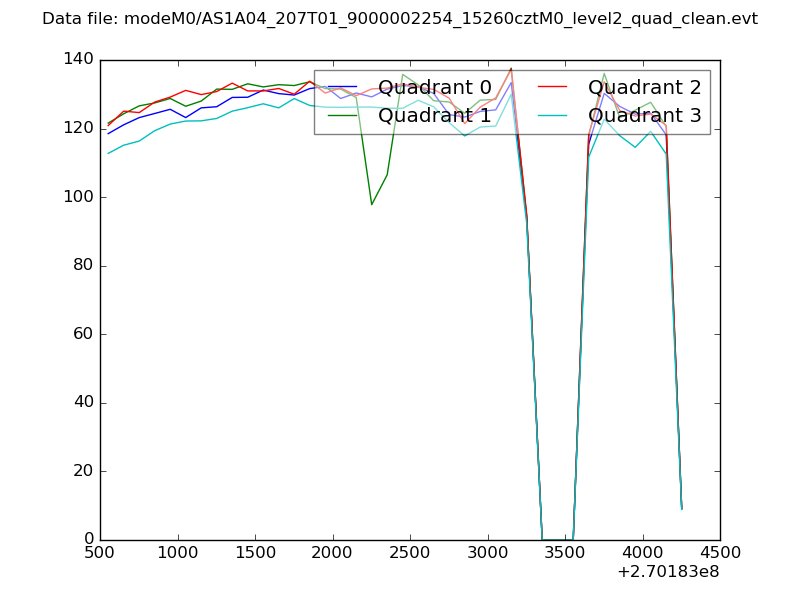 |
|
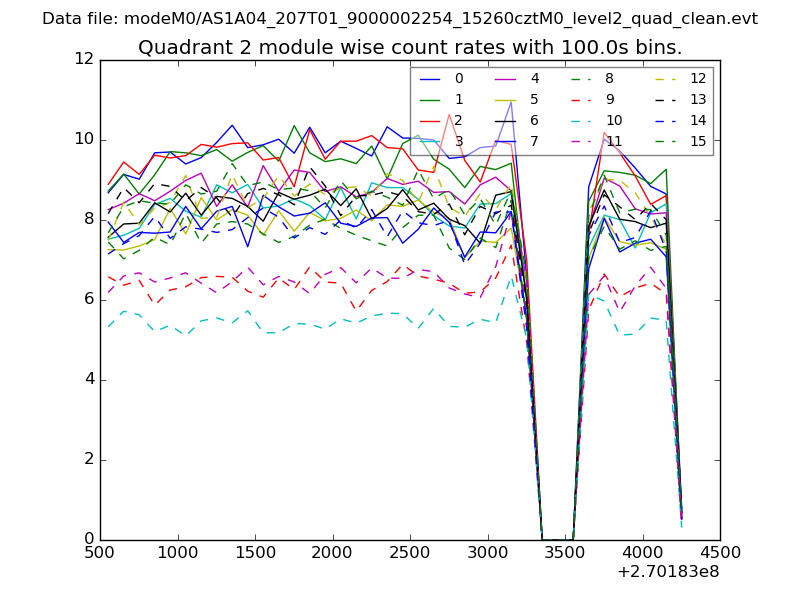
| Module-wise count rates for Quadrant A Data is divided into 100 sec bins |
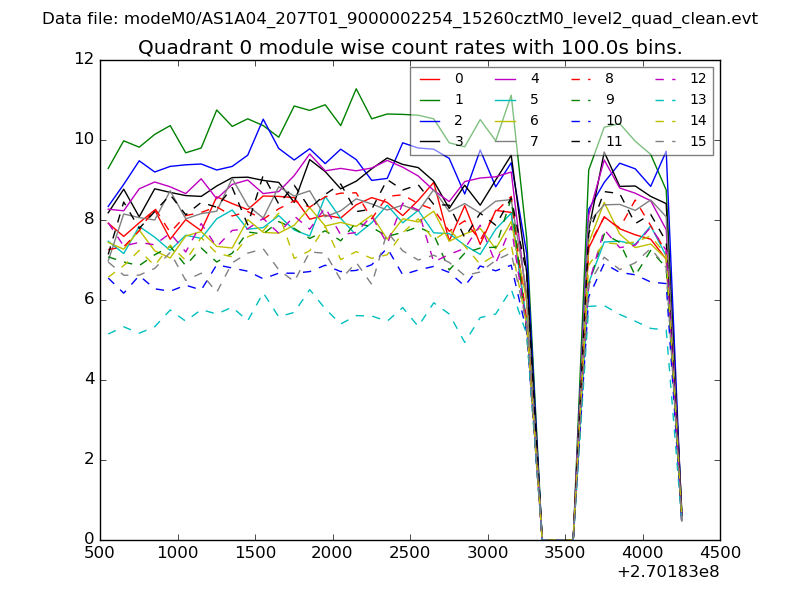 |
 |
| Module-wise count rates for Quadrant B Data is divided into 100 sec bins |
 |
 |
| Module-wise count rates for Quadrant C Data is divided into 100 sec bins |
 |
 |
| Module-wise count rates for Quadrant D Data is divided into 100 sec bins |
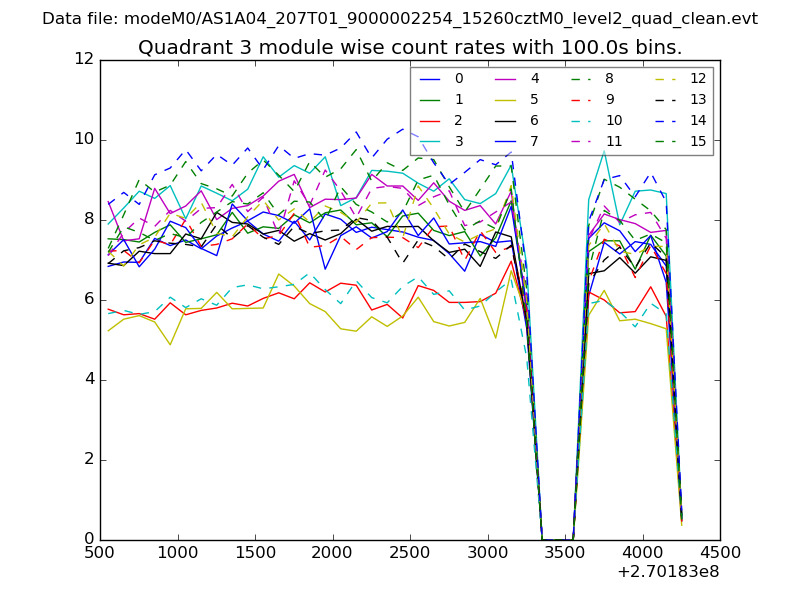 |
 |
| Parameter | Plot |
|---|---|
| CZT HV Monitor |  |
| D_VDD | 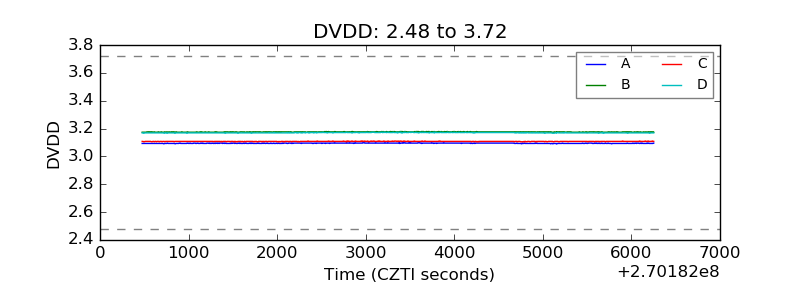 |
| Temperature 1 | 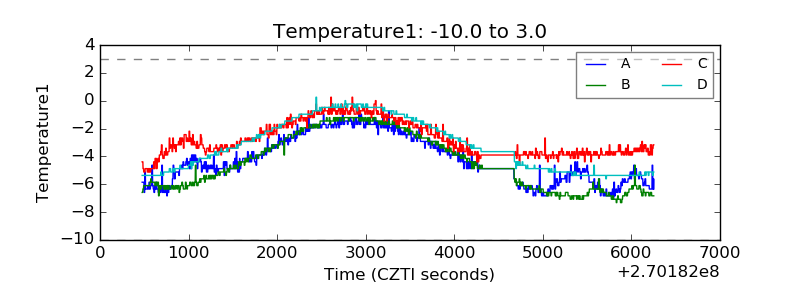 |
| Veto HV Monitor | 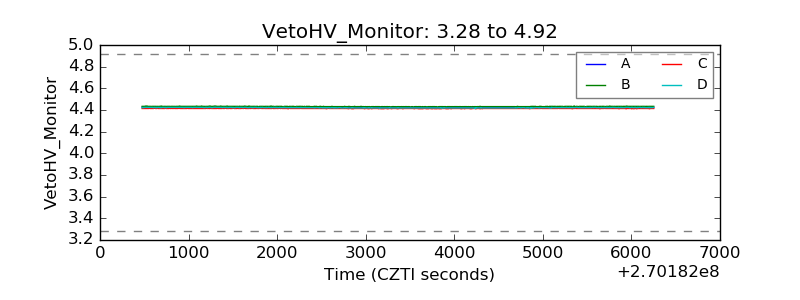 |
| Veto LLD | 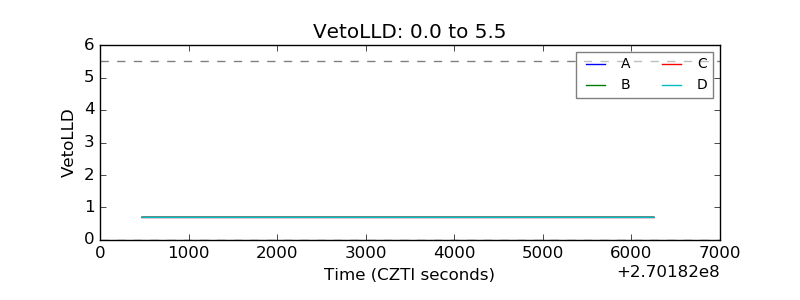 |
| Alpha Counter | 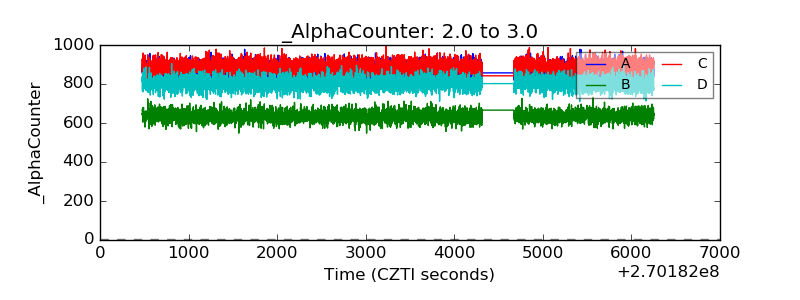 |
| _CPM_Rate | 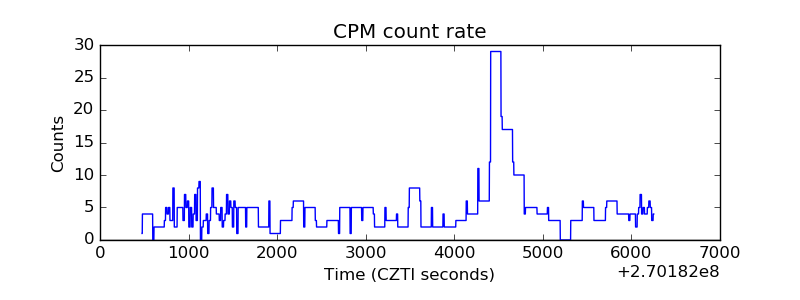 |
| CZT Counter | 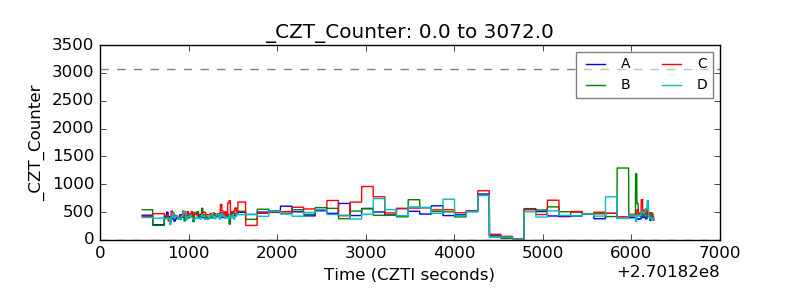 |
| +2.5 Volts monitor | 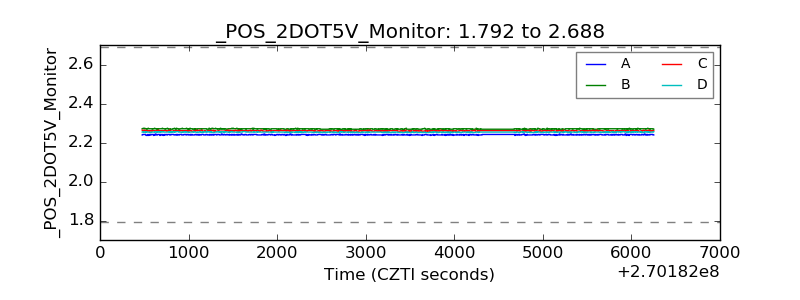 |
| +5 Volts monitor |  |
| _ROLL_ROT | 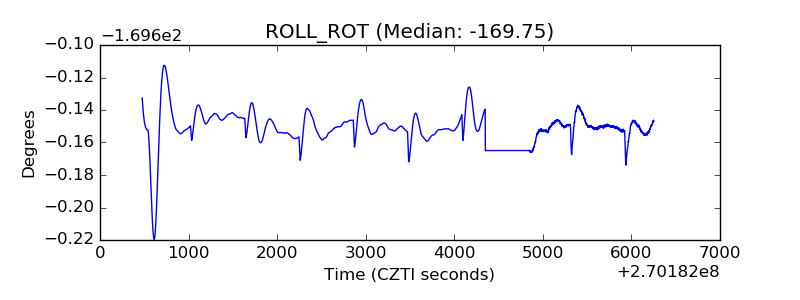 |
| _Roll_DEC | 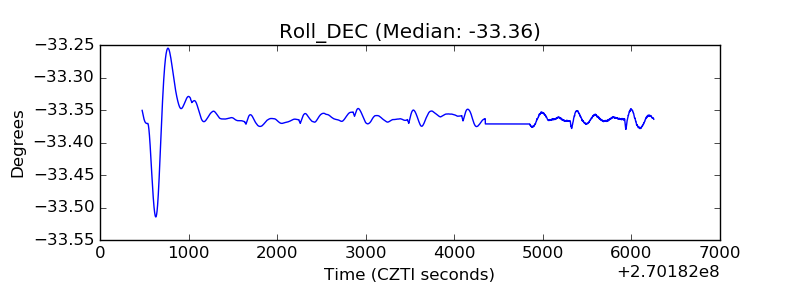 |
| _Roll_RA | 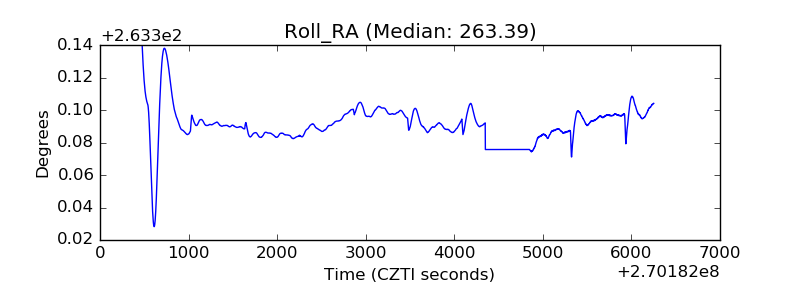 |
| Veto Counter | 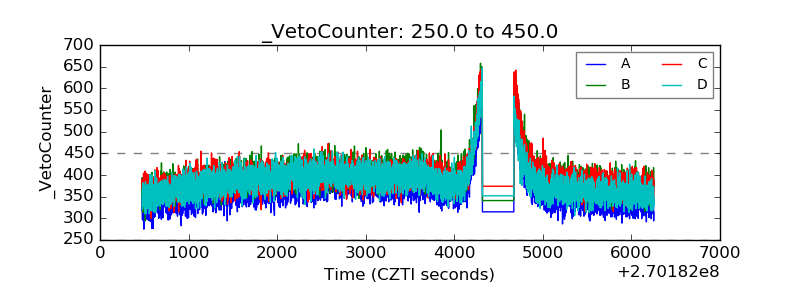 |