| Param | Original file | Final file |
|---|---|---|
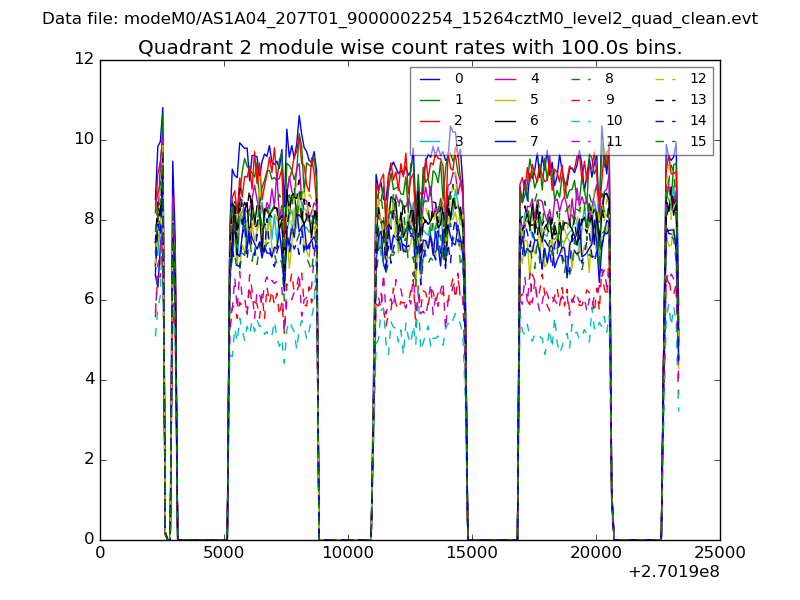
| Filename | modeM0/AS1A04_207T01_9000002254_15264cztM0_level2.evt | modeM0/AS1A04_207T01_9000002254_15264cztM0_level2_quad_clean.evt |
| Size (bytes) | 1,388,810,880 | 238,288,320 |
| Size | 1.3 GB | 227.2 MB |
| Events in quadrant A | 9,394,327 | 1,490,811 |
| Events in quadrant B | 11,370,713 | 1,472,457 |
| Events in quadrant C | 10,505,754 | 1,502,530 |
| Events in quadrant D | 9,497,292 | 1,433,623 |
| Mode SS | |||
|---|---|---|---|
| Quadrant | BADHDUFLAG | Total packets | Discarded packets |
| A | 0 | 392 | 0 |
| B | 0 | 392 | 0 |
| C | 0 | 392 | 0 |
| D | 0 | 392 | 0 |
| Mode M0 | |||
|---|---|---|---|
| Quadrant | BADHDUFLAG | Total packets | Discarded packets |
| A | 0 | 40451 | 5 |
| B | 0 | 45788 | 4 |
| C | 0 | 42305 | 4 |
| D | 0 | 41735 | 4 |
| Mode M9 | |||
|---|---|---|---|
| Quadrant | BADHDUFLAG | Total packets | Discarded packets |
| A | 0 | 20 | 0 |
| B | 0 | 20 | 0 |
| C | 0 | 20 | 0 |
| D | 0 | 20 | 0 |
| Quadrant | Total seconds | Saturated seconds | Saturation percentage |
|---|---|---|---|
| A | 19118 | 288 | 1.506434% |
| B | 19118 | 897 | 4.691913% |
| C | 19118 | 282 | 1.475050% |
| D | 19118 | 348 | 1.820274% |
Noise dominated data is calculated using 1-second bins in cleaned event files. If a bin has >2000 counts, and if more than 50% of those come from <1% of pixels, then it is considered to be noise-dominated and hence unusable.
| Quadrant | # 1 sec bins | Bins with >0 counts | Bins with >2000 counts | High rate bins dominated by noise | Noise dominated (total time) | Noise dominated (detector-on time) | Marked lightcurve |
|---|---|---|---|---|---|---|---|
| A | 21171 | 19115 | 7 | 7 | 0.03% | 0.04% | 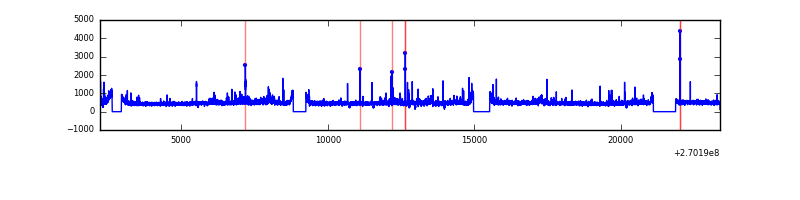 |
| B | 21171 | 19115 | 441 | 441 | 2.08% | 2.31% | 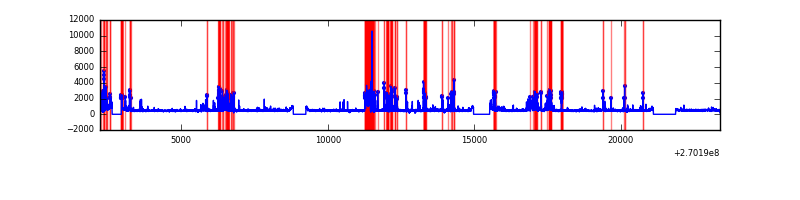 |
| C | 21171 | 19116 | 38 | 38 | 0.18% | 0.20% | 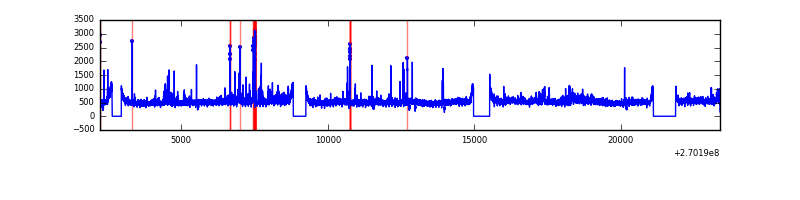 |
| D | 21171 | 19115 | 146 | 146 | 0.69% | 0.76% | 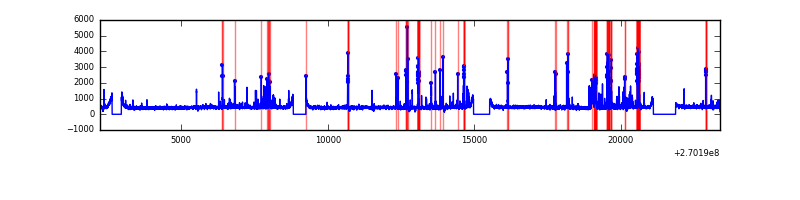 |
Top three noisy pixels from each quadrant. If the there are fewer than three noisy pixels in the level2.evt file, extra rows are filled as -1
| Pixel properties | Quadrant properties | ||||||
|---|---|---|---|---|---|---|---|
| Quadrant | DetID | PixID | Counts | Sigma | Mean | Median | Sigma |
| A | 12 | 189 | 410263 | 878.4 | 2296 | 2243 | 464.5 |
| A | 9 | 143 | 100957 | 212.51 | 2296 | 2243 | 464.5 |
| A | 0 | 253 | 37888 | 76.74 | 2296 | 2243 | 464.5 |
| B | 3 | 64 | 1871986 | 4302.53 | 2266 | 2206 | 434.6 |
| B | 10 | 16 | 131386 | 297.25 | 2266 | 2206 | 434.6 |
| B | 3 | 209 | 109829 | 247.65 | 2266 | 2206 | 434.6 |
| C | 3 | 233 | 1219514 | 2359.12 | 2233 | 2243 | 516.0 |
| C | 3 | 9 | 296376 | 570.04 | 2233 | 2243 | 516.0 |
| C | 4 | 254 | 263517 | 506.36 | 2233 | 2243 | 516.0 |
| D | 13 | 172 | 403352 | 739.17 | 2228 | 2164 | 542.8 |
| D | 1 | 52 | 248557 | 453.97 | 2228 | 2164 | 542.8 |
| D | 7 | 38 | 164809 | 299.67 | 2228 | 2164 | 542.8 |
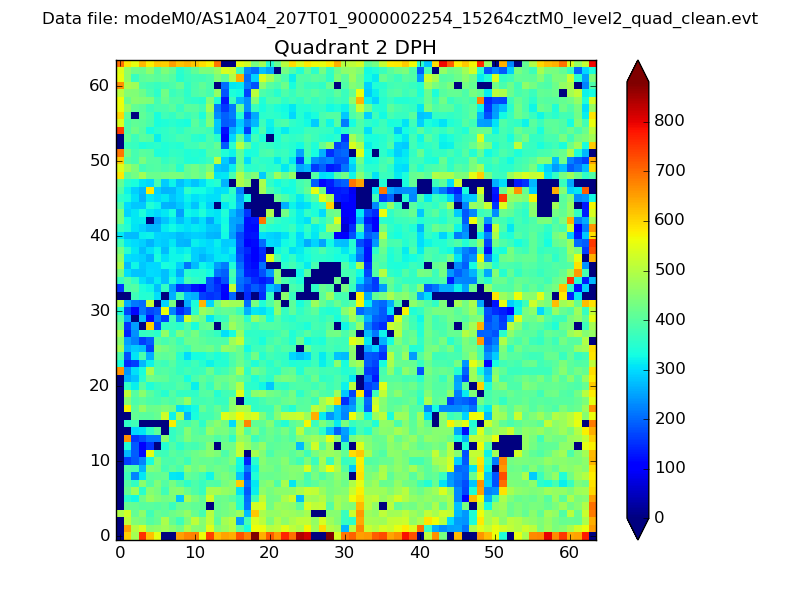
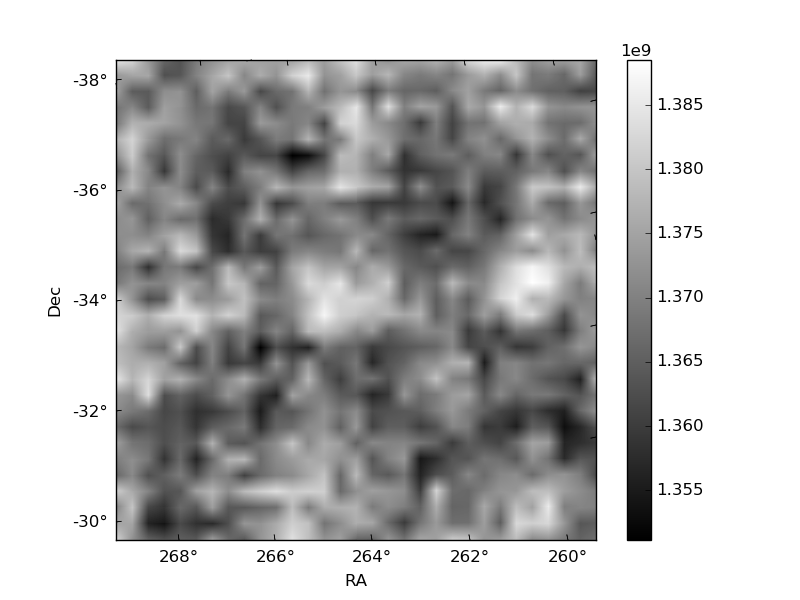
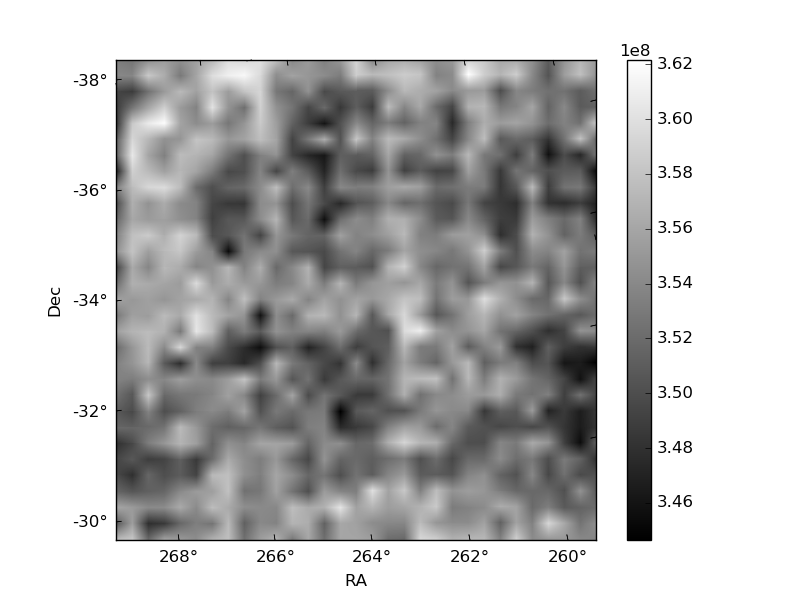
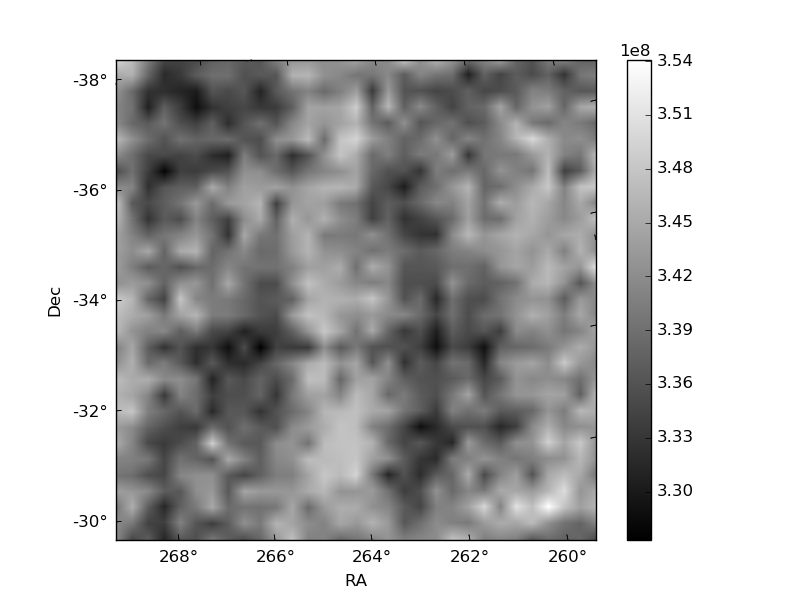
Histogram calculated using DETX and DETY for each event in the final _common_clean file
| Quadrant A | 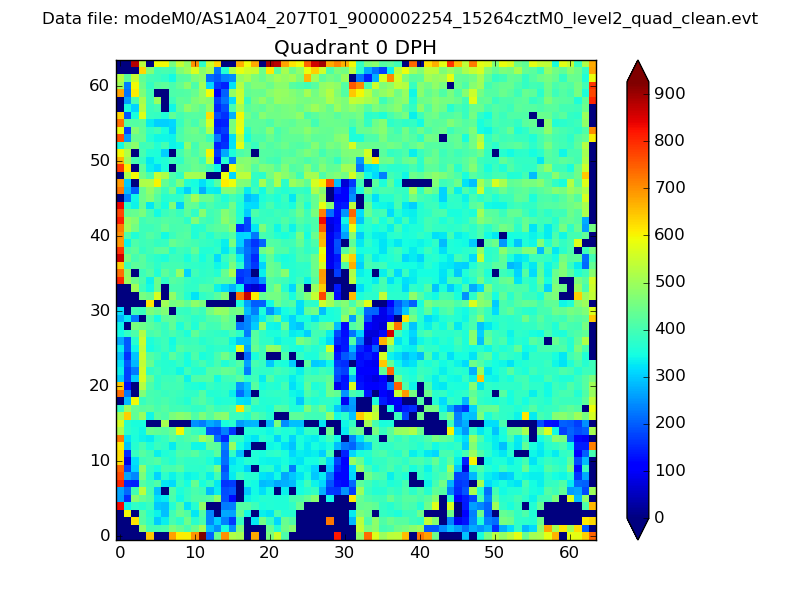 |
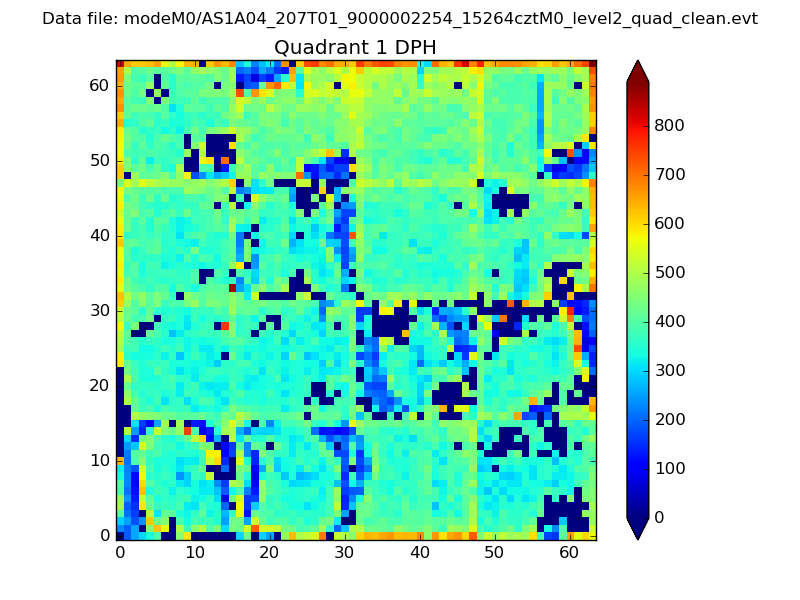 |
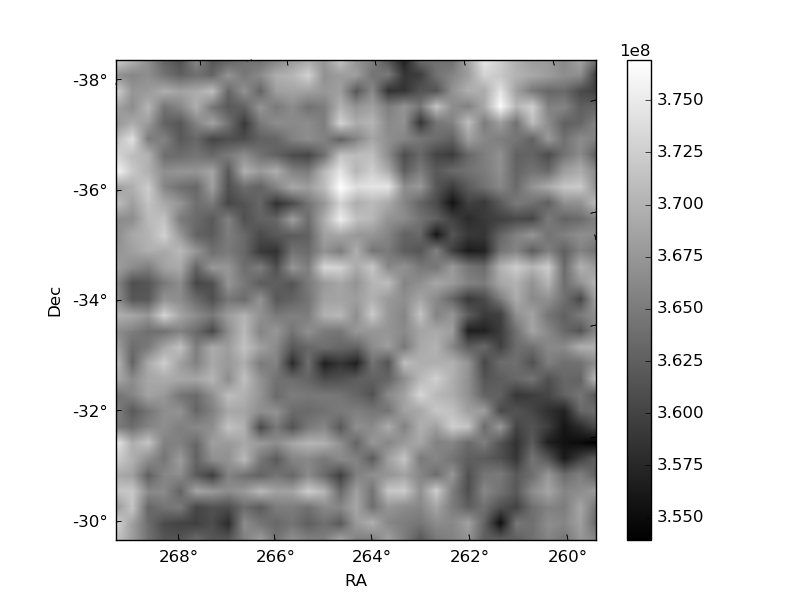
Quadrant B |
|---|---|---|---|
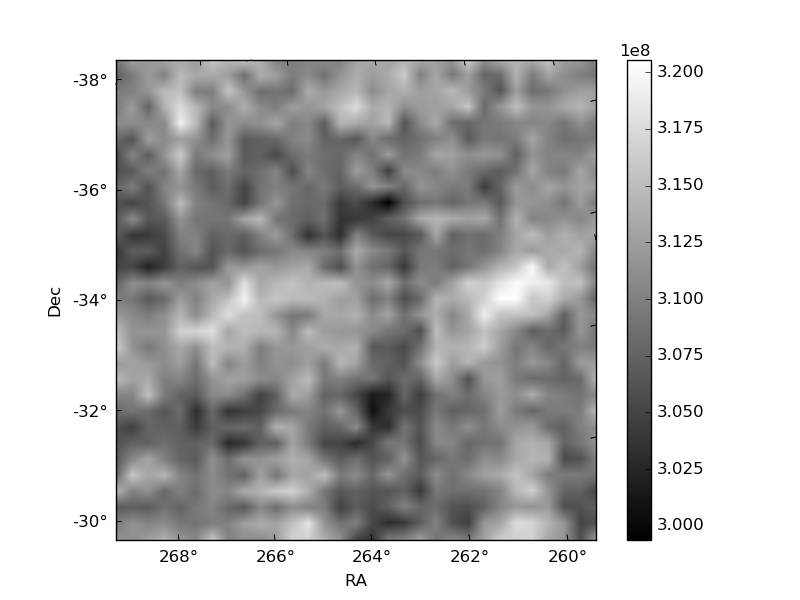
| Quadrant D | 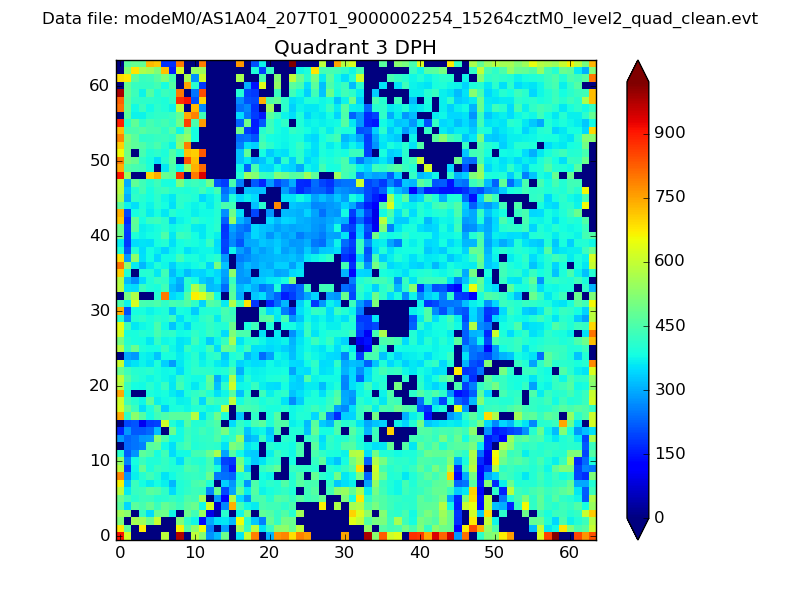 |
 |
Quadrant C |
| Plot type | Count rate plots | Images |
|---|---|---|
| Comparison with Poisson distribution Blue bars denote a histogram of data divided into 1 sec bins. Red curve is a Poisson curve with rate = median count rate of data. |
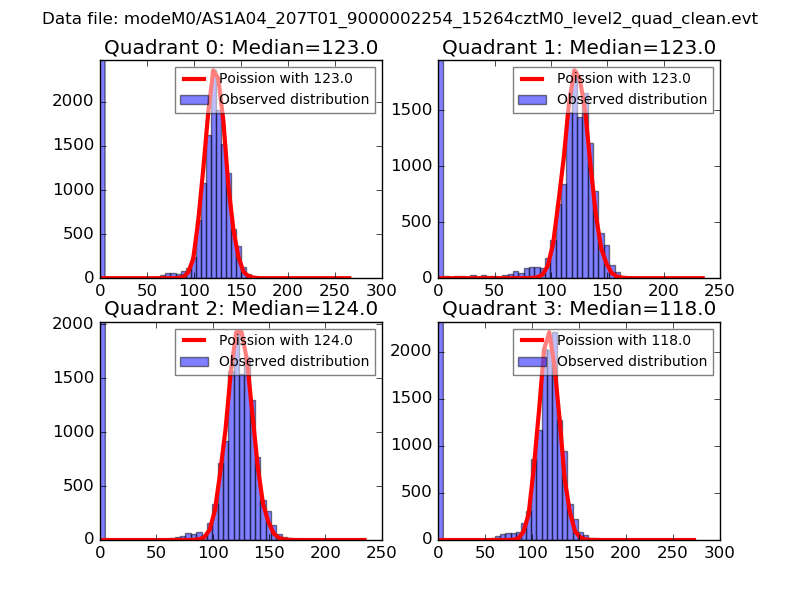 |
 |
| Quadrant-wise count rates Data is divided into 100 sec bins |
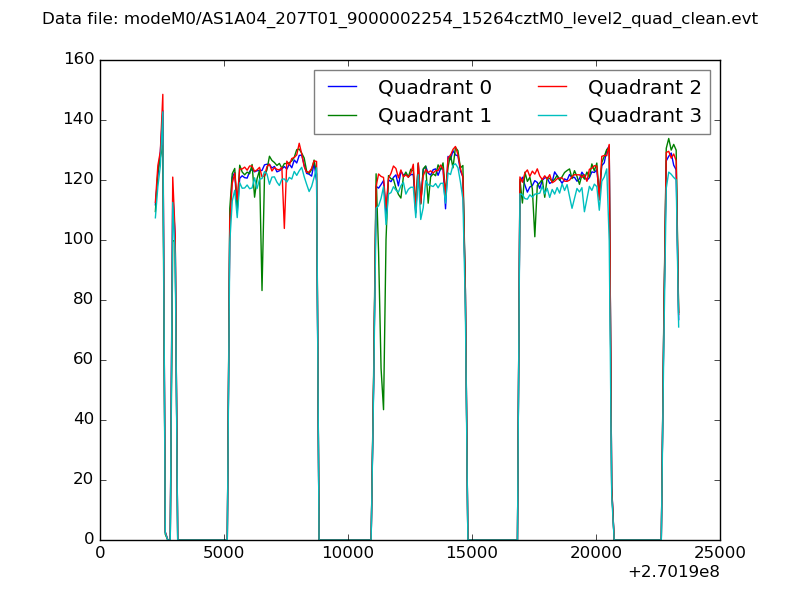 |
|
| Module-wise count rates for Quadrant A Data is divided into 100 sec bins |
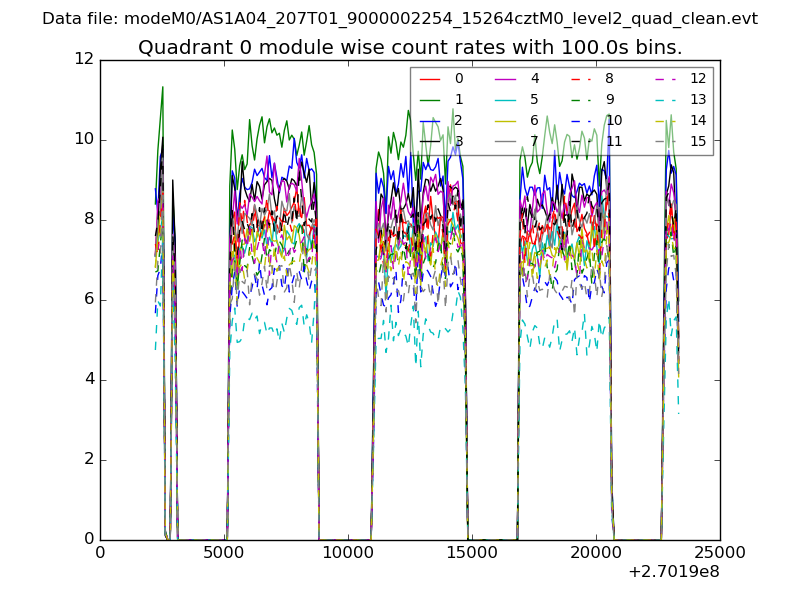 |
 |
| Module-wise count rates for Quadrant B Data is divided into 100 sec bins |
 |
 |
| Module-wise count rates for Quadrant C Data is divided into 100 sec bins |
 |
 |
| Module-wise count rates for Quadrant D Data is divided into 100 sec bins |
 |
 |
| Parameter | Plot |
|---|---|
| CZT HV Monitor | 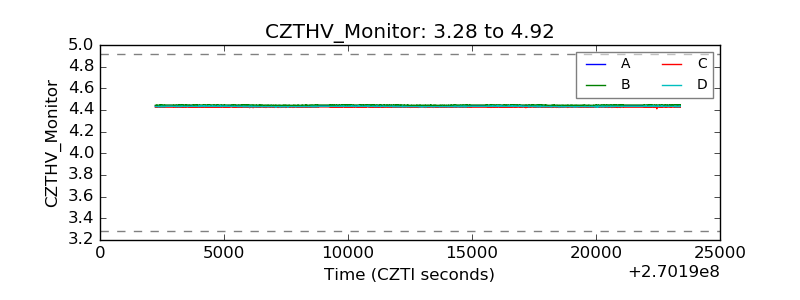 |
| D_VDD | 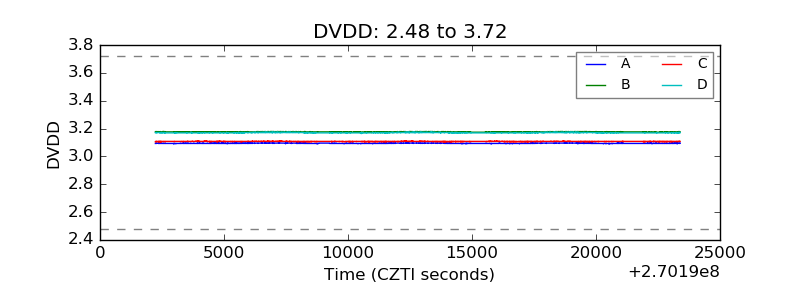 |
| Temperature 1 | 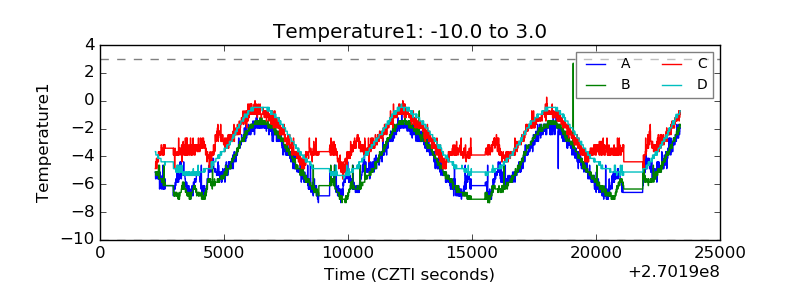 |
| Veto HV Monitor | 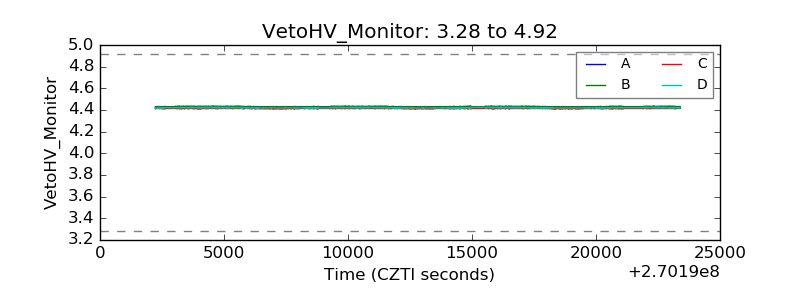 |
| Veto LLD |  |
| Alpha Counter | 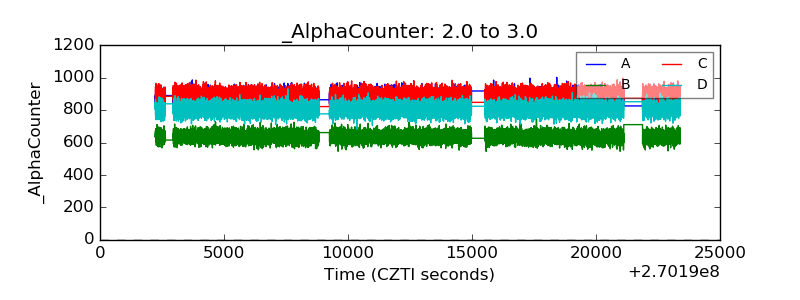 |
| _CPM_Rate | 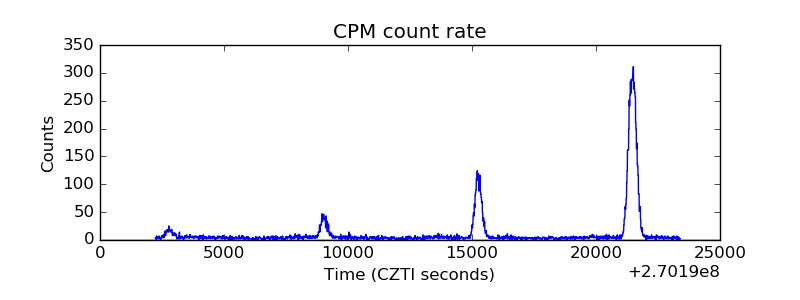 |
| CZT Counter | 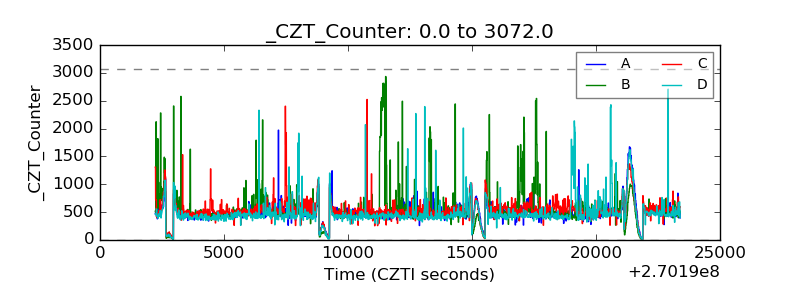 |
| +2.5 Volts monitor |  |
| +5 Volts monitor |  |
| _ROLL_ROT |  |
| _Roll_DEC | 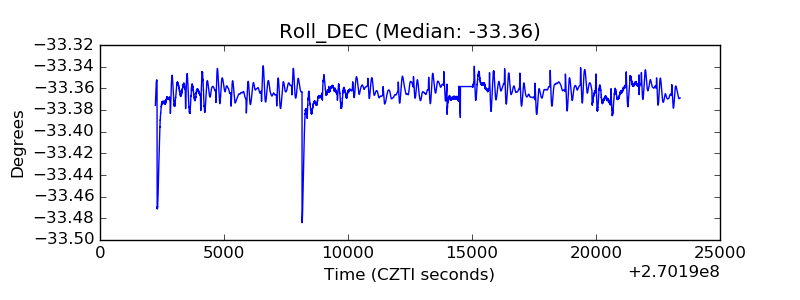 |
| _Roll_RA | 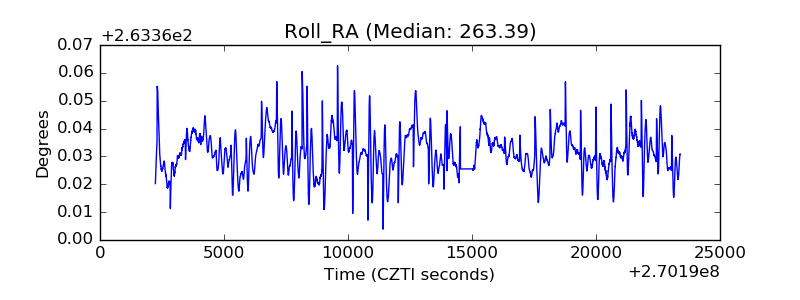 |
| Veto Counter |  |