| Param | Original file | Final file |
|---|---|---|
| Filename | modeM0/AS1A04_207T01_9000002254_15265cztM0_level2.evt | modeM0/AS1A04_207T01_9000002254_15265cztM0_level2_quad_clean.evt |
| Size (bytes) | 465,382,080 | 91,497,600 |
| Size | 443.8 MB | 87.3 MB |
| Events in quadrant A | 3,268,757 | 589,488 |
| Events in quadrant B | 3,674,793 | 579,574 |
| Events in quadrant C | 3,586,349 | 589,964 |
| Events in quadrant D | 3,128,849 | 564,669 |
| Mode SS | |||
|---|---|---|---|
| Quadrant | BADHDUFLAG | Total packets | Discarded packets |
| A | 0 | 132 | 0 |
| B | 0 | 132 | 0 |
| C | 0 | 132 | 0 |
| D | 0 | 132 | 0 |
| Mode M0 | |||
|---|---|---|---|
| Quadrant | BADHDUFLAG | Total packets | Discarded packets |
| A | 0 | 13698 | 34 |
| B | 0 | 14861 | 29 |
| C | 0 | 14691 | 15 |
| D | 0 | 13624 | 23 |
| Mode M9 | |||
|---|---|---|---|
| Quadrant | BADHDUFLAG | Total packets | Discarded packets |
| A | 0 | 9 | 0 |
| B | 0 | 9 | 0 |
| C | 0 | 9 | 0 |
| D | 0 | 9 | 0 |
| Quadrant | Total seconds | Saturated seconds | Saturation percentage |
|---|---|---|---|
| A | 6399 | 63 | 0.984529% |
| B | 6404 | 247 | 3.856964% |
| C | 6405 | 58 | 0.905543% |
| D | 6401 | 77 | 1.202937% |
Noise dominated data is calculated using 1-second bins in cleaned event files. If a bin has >2000 counts, and if more than 50% of those come from <1% of pixels, then it is considered to be noise-dominated and hence unusable.
| Quadrant | # 1 sec bins | Bins with >0 counts | Bins with >2000 counts | High rate bins dominated by noise | Noise dominated (total time) | Noise dominated (detector-on time) | Marked lightcurve |
|---|---|---|---|---|---|---|---|
| A | 7348 | 6413 | 3 | 3 | 0.04% | 0.05% | 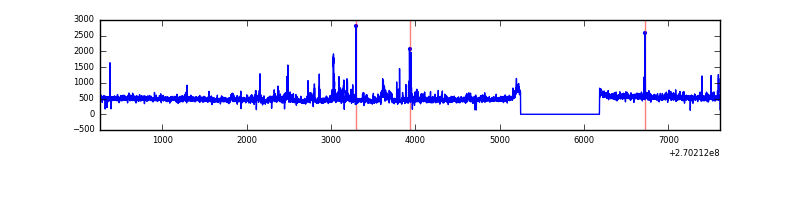 |
| B | 7348 | 6413 | 159 | 159 | 2.16% | 2.48% | 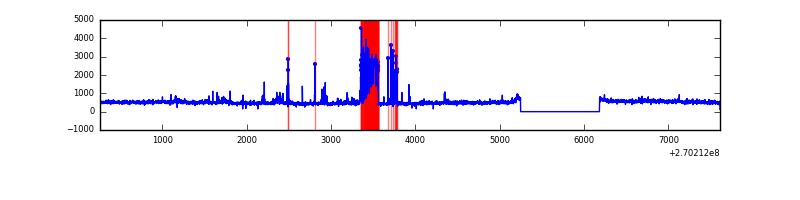 |
| C | 7348 | 6413 | 0 | 0 | 0.00% | 0.00% | 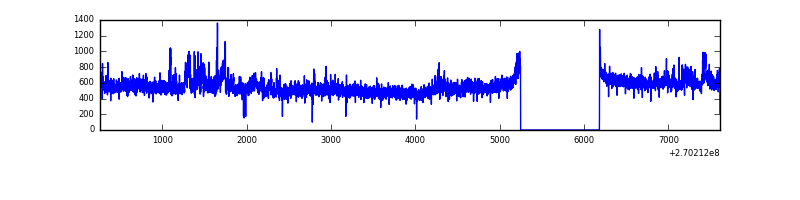 |
| D | 7348 | 6413 | 19 | 19 | 0.26% | 0.30% | 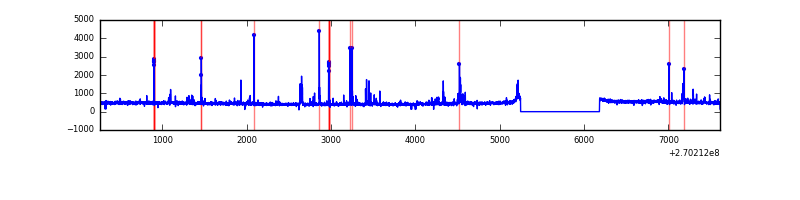 |
Top three noisy pixels from each quadrant. If the there are fewer than three noisy pixels in the level2.evt file, extra rows are filled as -1
| Pixel properties | Quadrant properties | ||||||
|---|---|---|---|---|---|---|---|
| Quadrant | DetID | PixID | Counts | Sigma | Mean | Median | Sigma |
| A | 12 | 189 | 191245 | 1193.24 | 786 | 768 | 159.6 |
| A | 9 | 143 | 46014 | 283.44 | 786 | 768 | 159.6 |
| A | 15 | 69 | 7435 | 41.77 | 786 | 768 | 159.6 |
| B | 3 | 64 | 510898 | 3401.39 | 769 | 749 | 150.0 |
| B | 0 | 205 | 32220 | 209.83 | 769 | 749 | 150.0 |
| B | 0 | 190 | 25235 | 163.26 | 769 | 749 | 150.0 |
| C | 3 | 233 | 507638 | 2892.9 | 758 | 762 | 175.2 |
| C | 3 | 9 | 120474 | 683.23 | 758 | 762 | 175.2 |
| C | 13 | 61 | 5315 | 25.99 | 758 | 762 | 175.2 |
| D | 13 | 172 | 77877 | 417.61 | 760 | 738 | 184.7 |
| D | 2 | 33 | 62618 | 335.0 | 760 | 738 | 184.7 |
| D | 7 | 38 | 35684 | 189.19 | 760 | 738 | 184.7 |
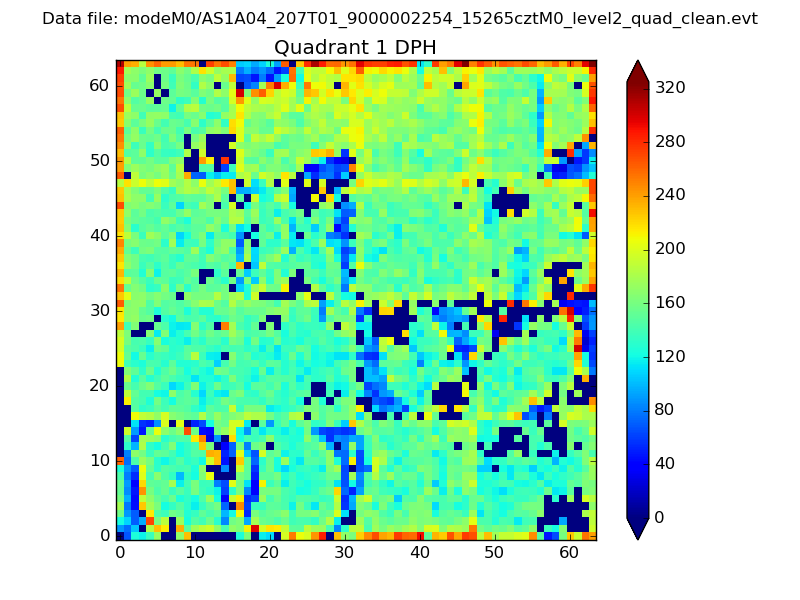
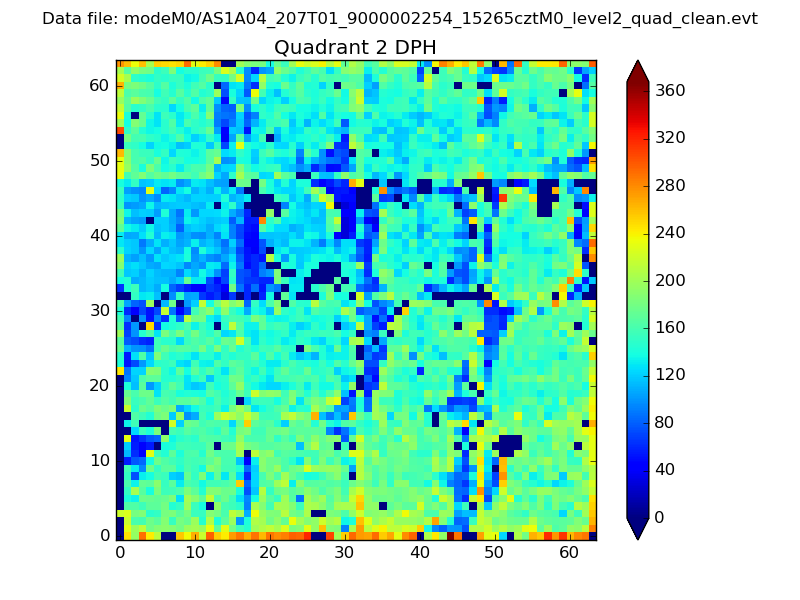
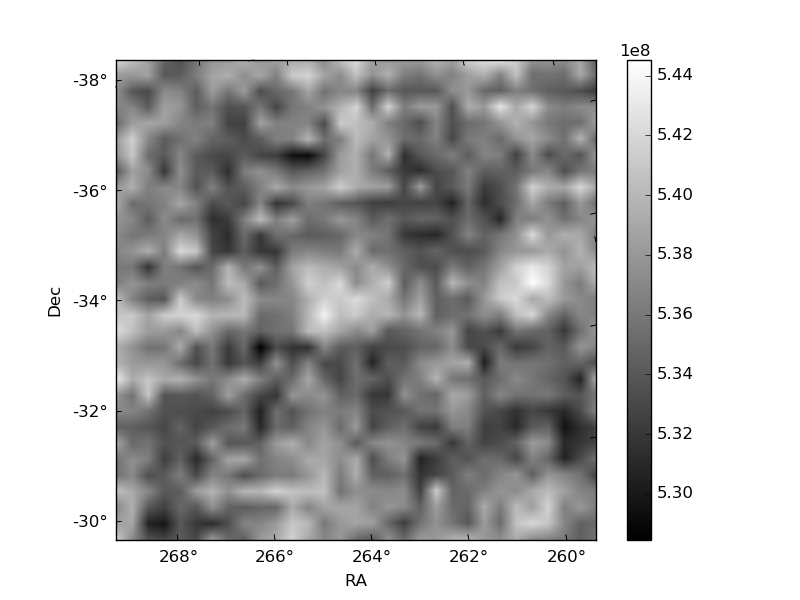
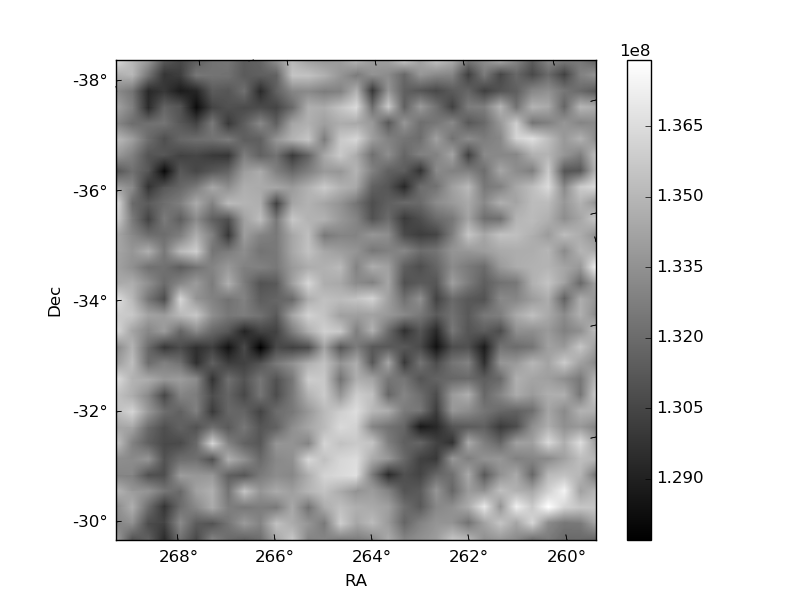
Histogram calculated using DETX and DETY for each event in the final _common_clean file
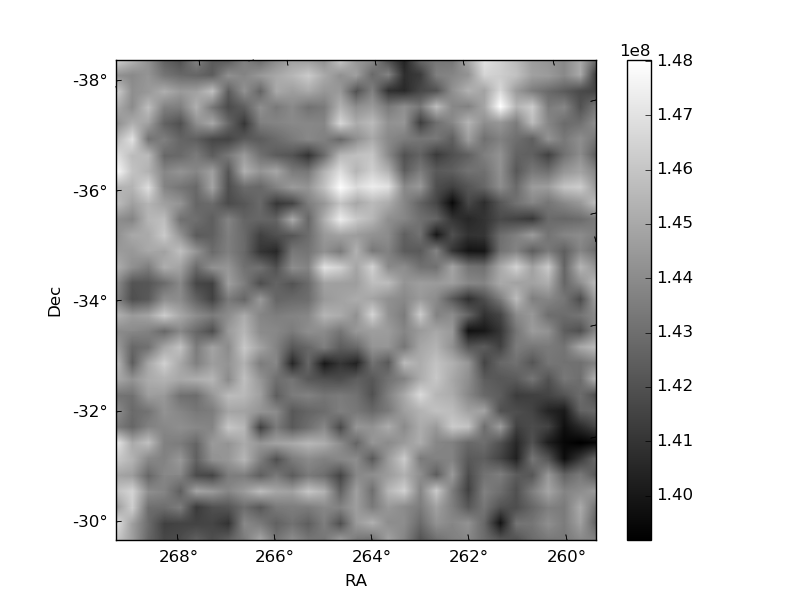
| Quadrant A |  |
 |
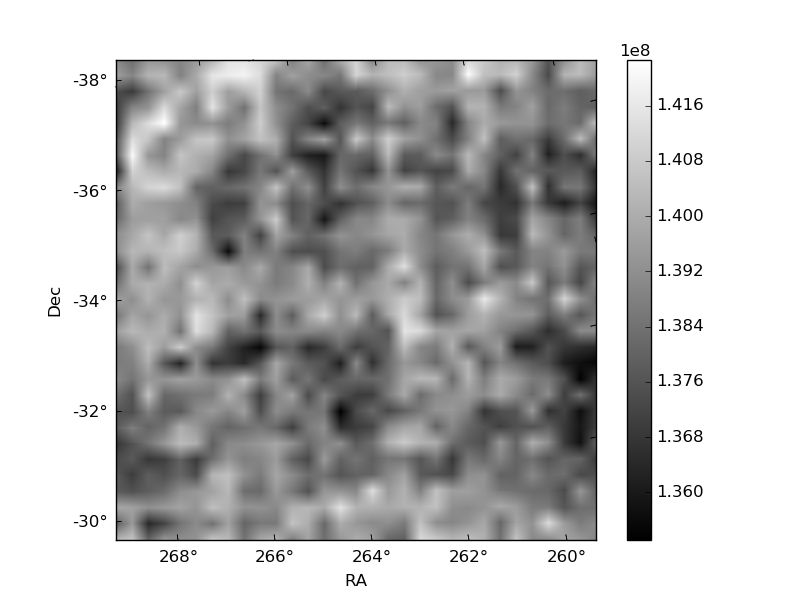
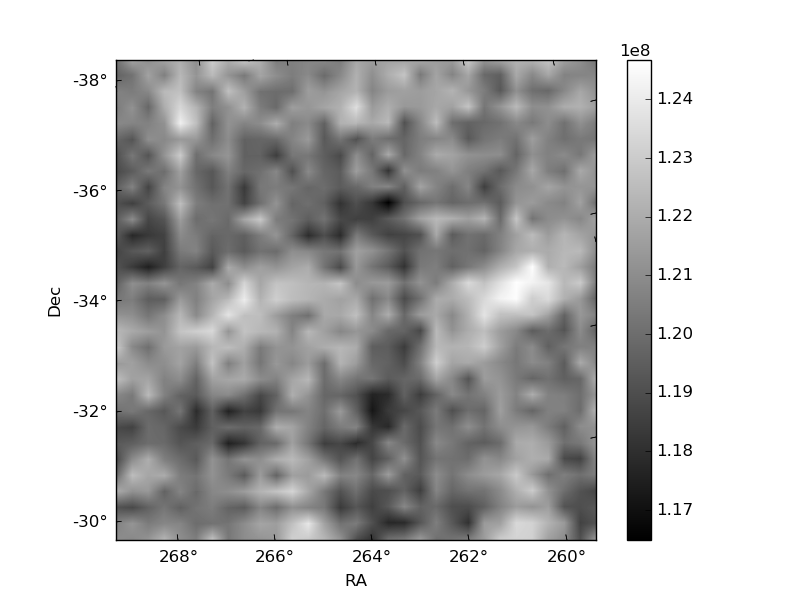
Quadrant B |
|---|---|---|---|
| Quadrant D | 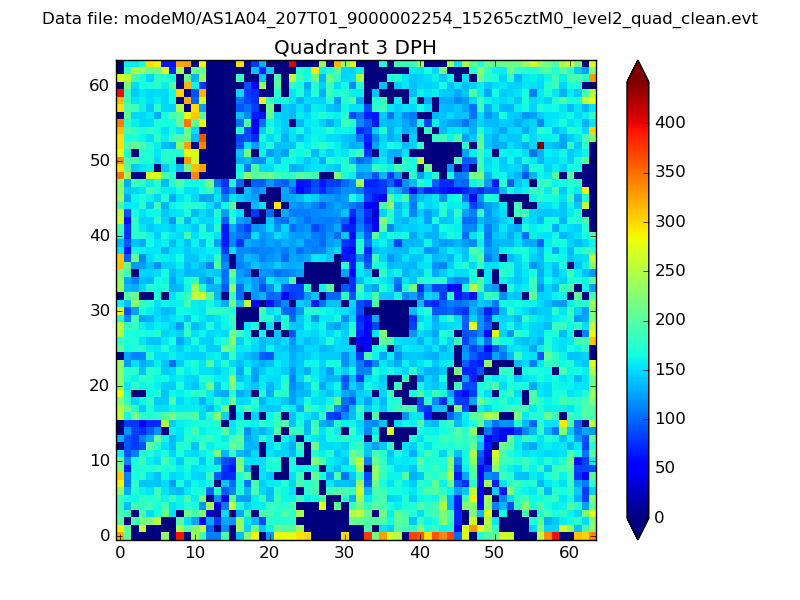 |
 |
Quadrant C |
| Plot type | Count rate plots | Images |
|---|---|---|
| Comparison with Poisson distribution Blue bars denote a histogram of data divided into 1 sec bins. Red curve is a Poisson curve with rate = median count rate of data. |
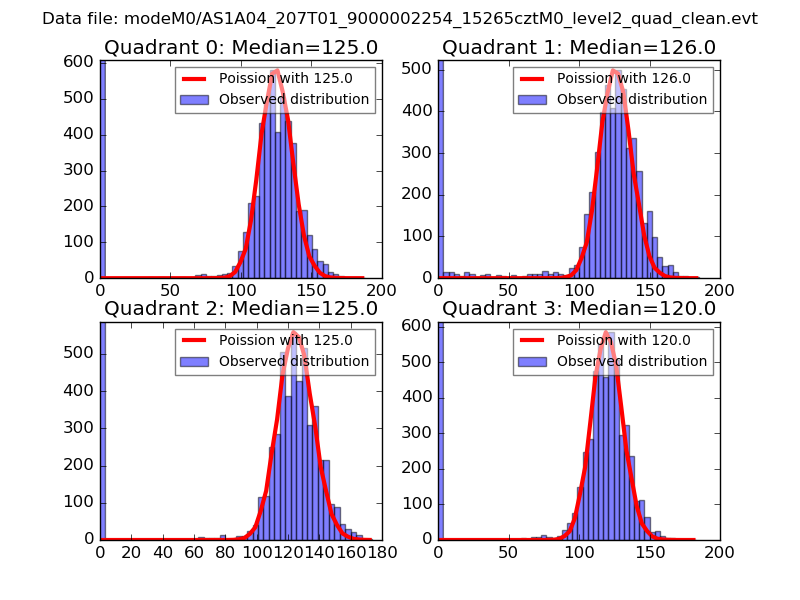 |
 |
| Quadrant-wise count rates Data is divided into 100 sec bins |
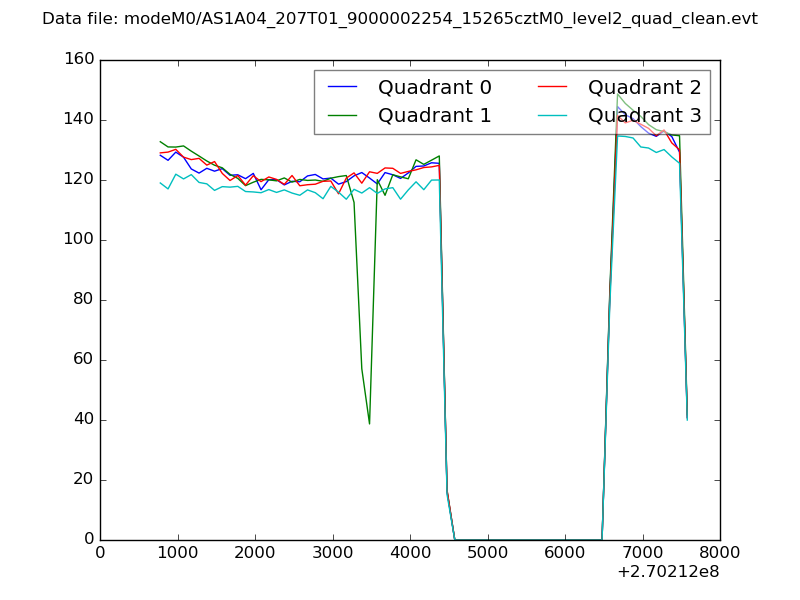 |
|
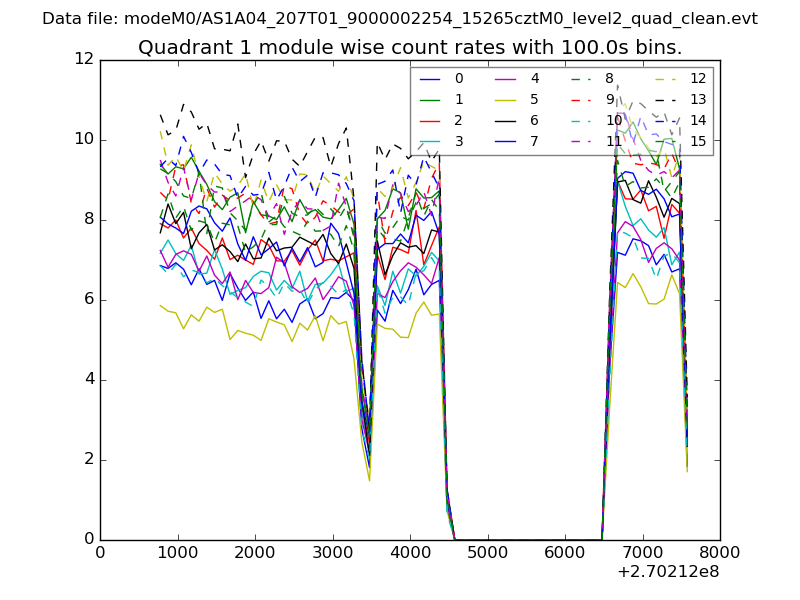
| Module-wise count rates for Quadrant A Data is divided into 100 sec bins |
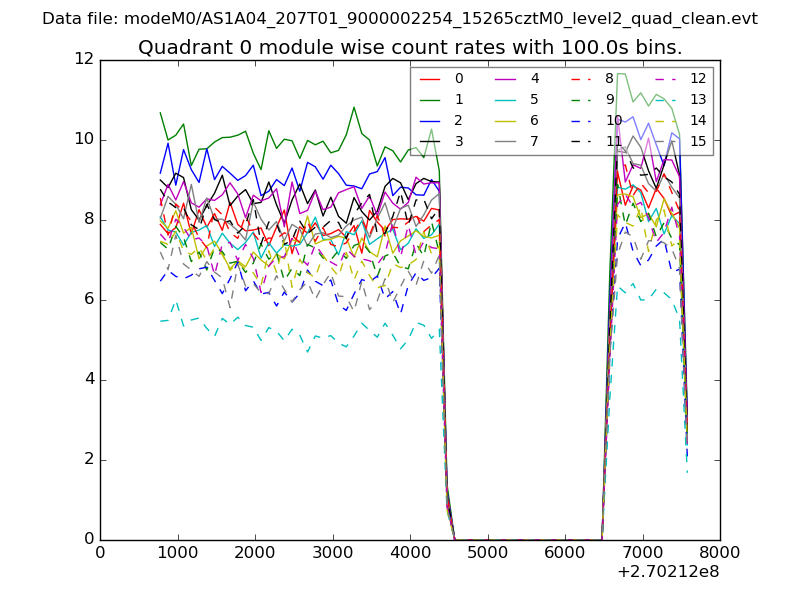 |
 |
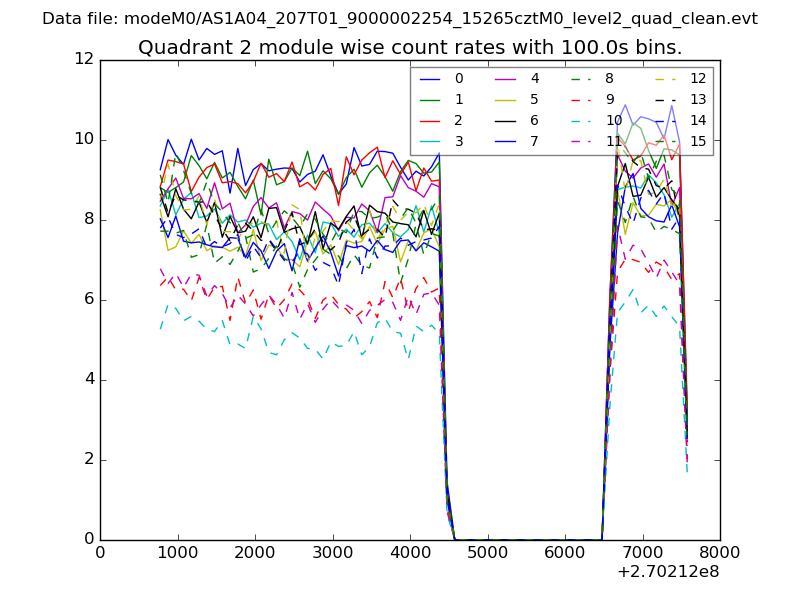
| Module-wise count rates for Quadrant B Data is divided into 100 sec bins |
 |
 |
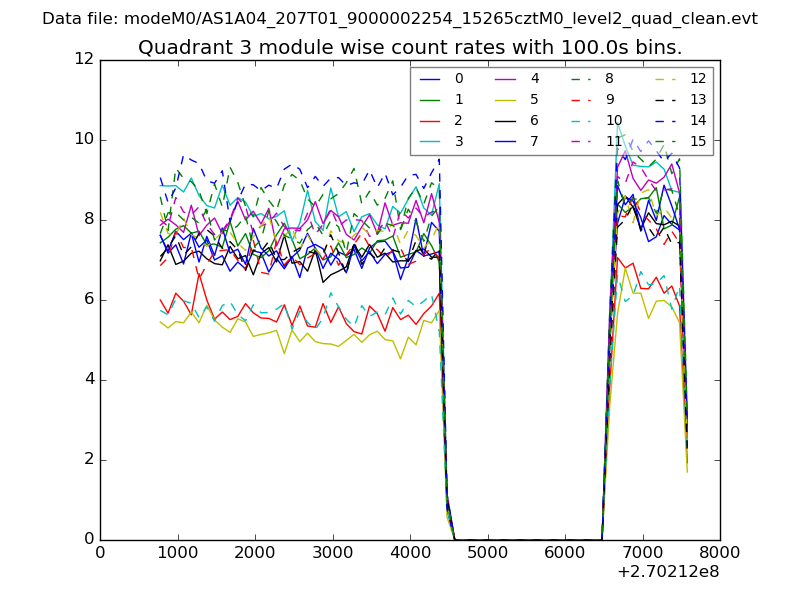
| Module-wise count rates for Quadrant C Data is divided into 100 sec bins |
 |
 |
| Module-wise count rates for Quadrant D Data is divided into 100 sec bins |
 |
 |
| Parameter | Plot |
|---|---|
| CZT HV Monitor |  |
| D_VDD | 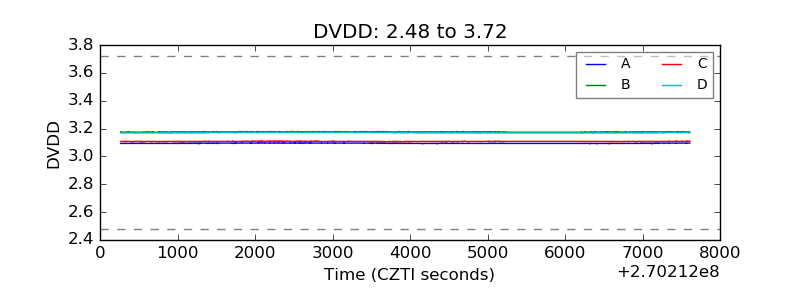 |
| Temperature 1 | 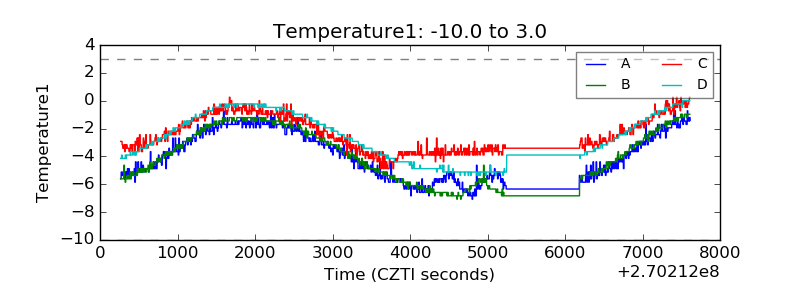 |
| Veto HV Monitor | 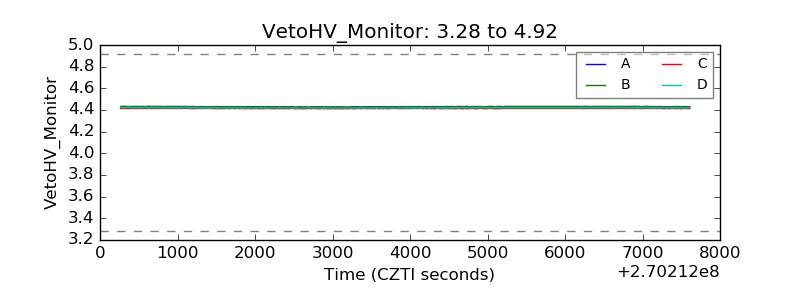 |
| Veto LLD | 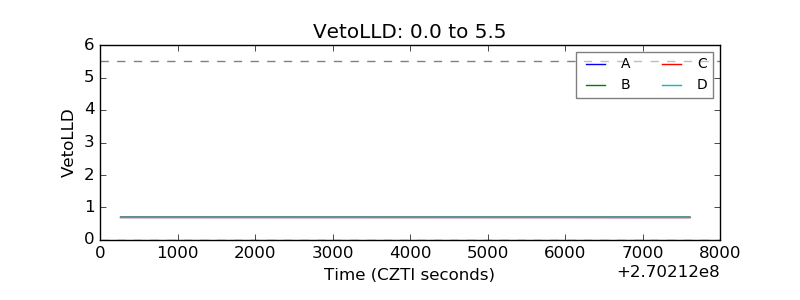 |
| Alpha Counter | 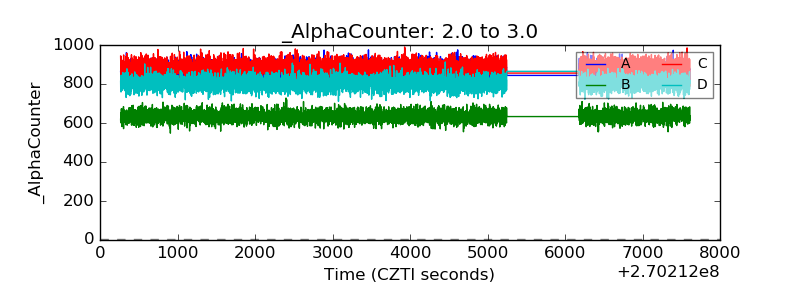 |
| _CPM_Rate | 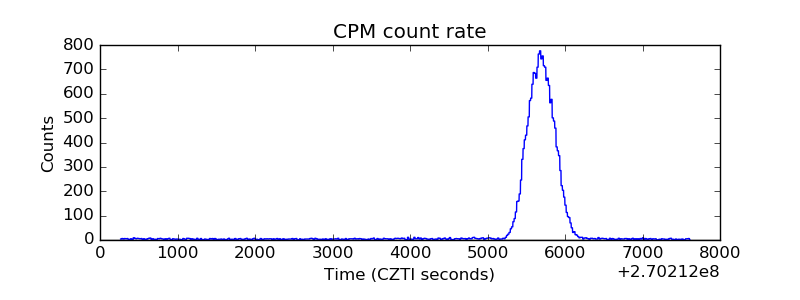 |
| CZT Counter | 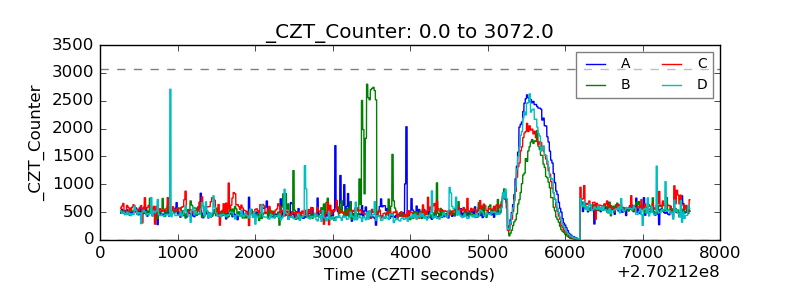 |
| +2.5 Volts monitor |  |
| +5 Volts monitor |  |
| _ROLL_ROT | 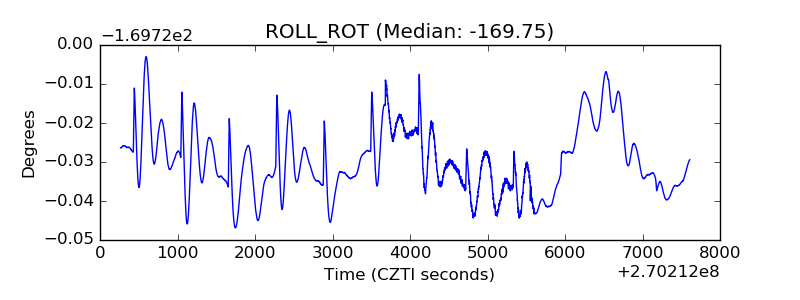 |
| _Roll_DEC | 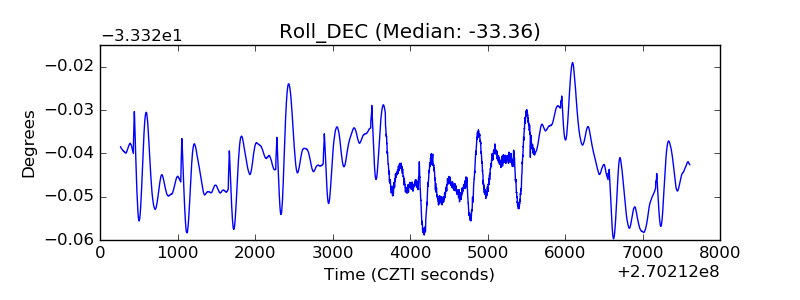 |
| _Roll_RA | 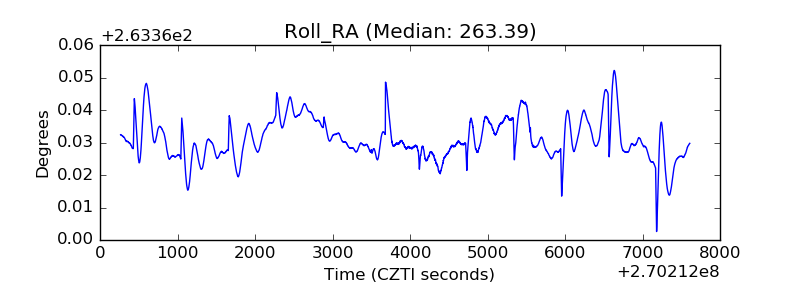 |
| Veto Counter | 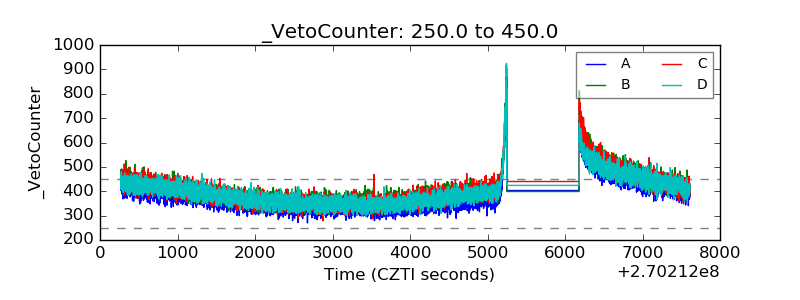 |