| Param | Original file | Final file |
|---|---|---|
| Filename | modeM0/AS1A04_207T01_9000002254_15266cztM0_level2.evt | modeM0/AS1A04_207T01_9000002254_15266cztM0_level2_quad_clean.evt |
| Size (bytes) | 417,913,920 | 95,457,600 |
| Size | 398.6 MB | 91.0 MB |
| Events in quadrant A | 2,862,536 | 629,324 |
| Events in quadrant B | 3,066,802 | 635,107 |
| Events in quadrant C | 3,376,127 | 624,696 |
| Events in quadrant D | 2,961,207 | 600,641 |
| Mode SS | |||
|---|---|---|---|
| Quadrant | BADHDUFLAG | Total packets | Discarded packets |
| A | 0 | 118 | 0 |
| B | 0 | 118 | 0 |
| C | 0 | 118 | 0 |
| D | 0 | 118 | 0 |
| Mode M0 | |||
|---|---|---|---|
| Quadrant | BADHDUFLAG | Total packets | Discarded packets |
| A | 0 | 12314 | 2 |
| B | 0 | 12909 | 1 |
| C | 0 | 13857 | 1 |
| D | 0 | 12735 | 1 |
| Mode M9 | |||
|---|---|---|---|
| Quadrant | BADHDUFLAG | Total packets | Discarded packets |
| A | 0 | 11 | 0 |
| B | 0 | 11 | 0 |
| C | 0 | 11 | 0 |
| D | 0 | 11 | 0 |
| Quadrant | Total seconds | Saturated seconds | Saturation percentage |
|---|---|---|---|
| A | 5734 | 43 | 0.749913% |
| B | 5734 | 43 | 0.749913% |
| C | 5734 | 25 | 0.435996% |
| D | 5734 | 71 | 1.238228% |
Noise dominated data is calculated using 1-second bins in cleaned event files. If a bin has >2000 counts, and if more than 50% of those come from <1% of pixels, then it is considered to be noise-dominated and hence unusable.
| Quadrant | # 1 sec bins | Bins with >0 counts | Bins with >2000 counts | High rate bins dominated by noise | Noise dominated (total time) | Noise dominated (detector-on time) | Marked lightcurve |
|---|---|---|---|---|---|---|---|
| A | 6845 | 5735 | 1 | 1 | 0.01% | 0.02% | 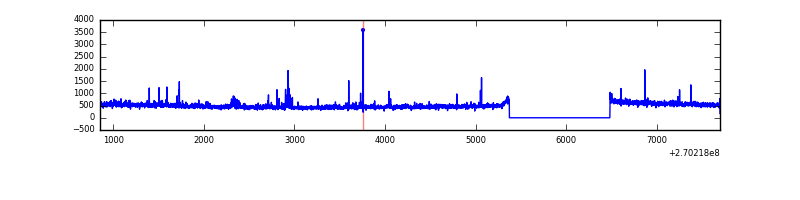 |
| B | 6845 | 5736 | 2 | 2 | 0.03% | 0.03% | 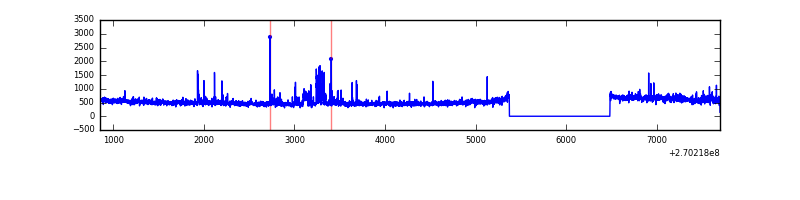 |
| C | 6845 | 5736 | 0 | 0 | 0.00% | 0.00% | 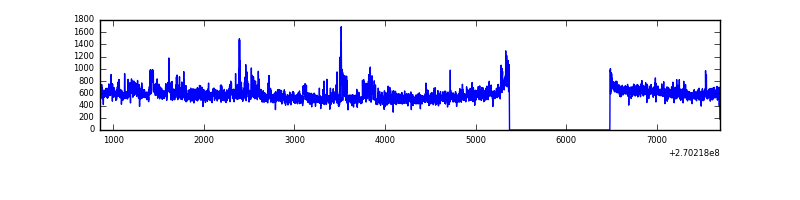 |
| D | 6845 | 5735 | 38 | 38 | 0.56% | 0.66% | 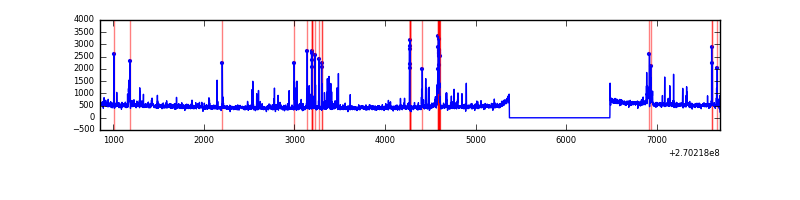 |
Top three noisy pixels from each quadrant. If the there are fewer than three noisy pixels in the level2.evt file, extra rows are filled as -1
| Pixel properties | Quadrant properties | ||||||
|---|---|---|---|---|---|---|---|
| Quadrant | DetID | PixID | Counts | Sigma | Mean | Median | Sigma |
| A | 9 | 143 | 51925 | 356.15 | 710 | 695 | 143.8 |
| A | 12 | 189 | 47954 | 328.54 | 710 | 695 | 143.8 |
| A | 13 | 248 | 22773 | 153.48 | 710 | 695 | 143.8 |
| B | 0 | 219 | 63233 | 464.44 | 707 | 690 | 134.7 |
| B | 0 | 197 | 55843 | 409.56 | 707 | 690 | 134.7 |
| B | 0 | 205 | 44534 | 325.58 | 707 | 690 | 134.7 |
| C | 3 | 233 | 644753 | 4107.66 | 680 | 682 | 156.8 |
| C | 3 | 9 | 79007 | 499.53 | 680 | 682 | 156.8 |
| C | 13 | 61 | 4772 | 26.08 | 680 | 682 | 156.8 |
| D | 2 | 33 | 163546 | 972.41 | 684 | 663 | 167.5 |
| D | 13 | 172 | 70456 | 416.66 | 684 | 663 | 167.5 |
| D | 7 | 38 | 65933 | 389.66 | 684 | 663 | 167.5 |
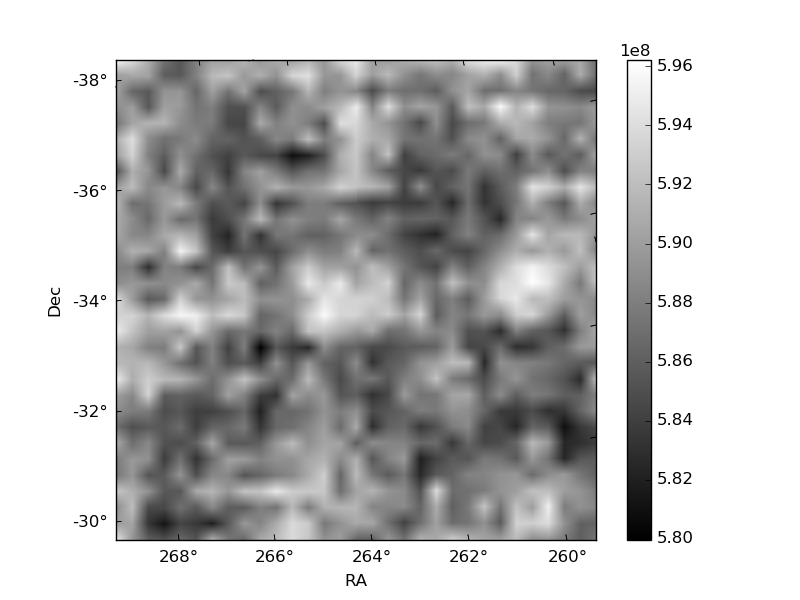
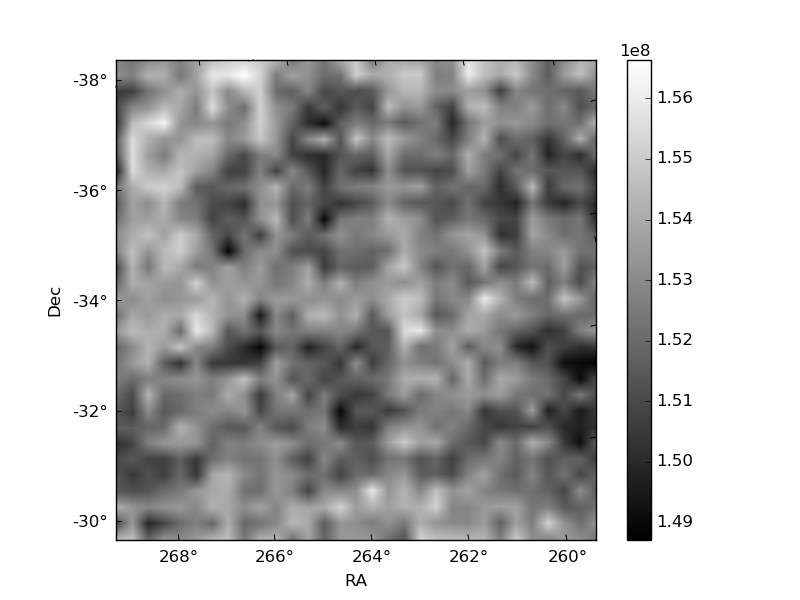
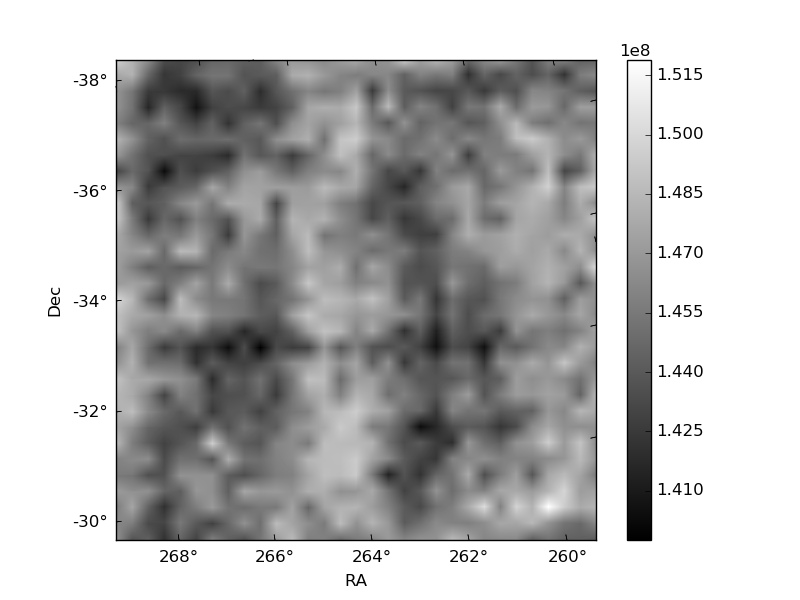
Histogram calculated using DETX and DETY for each event in the final _common_clean file
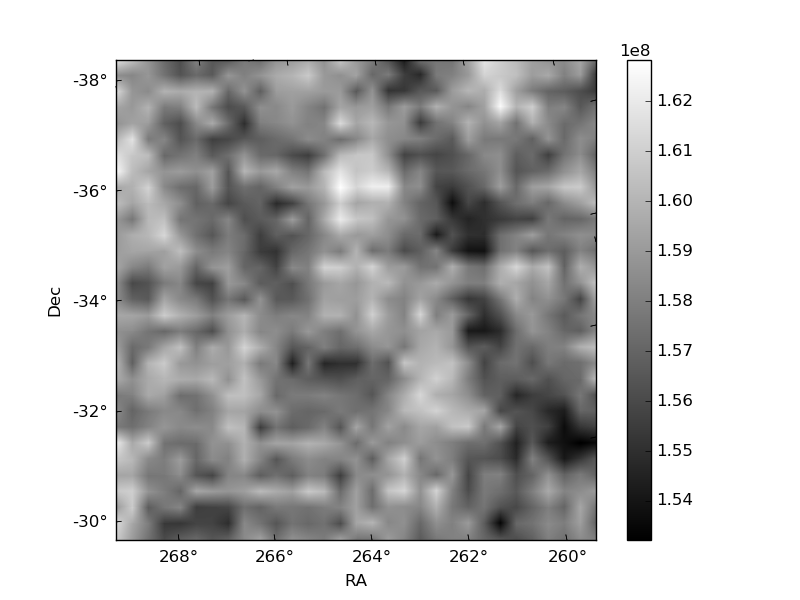
| Quadrant A | 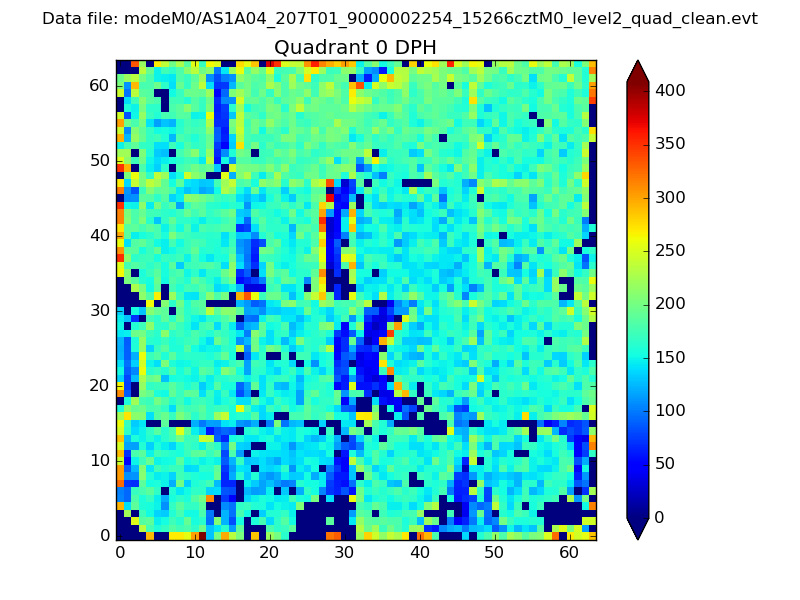 |
 |
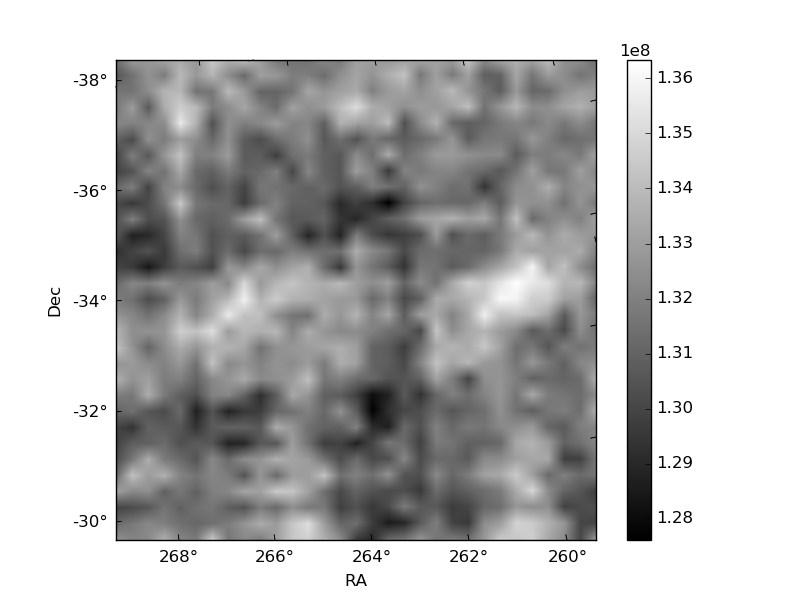
Quadrant B |
|---|---|---|---|
| Quadrant D | 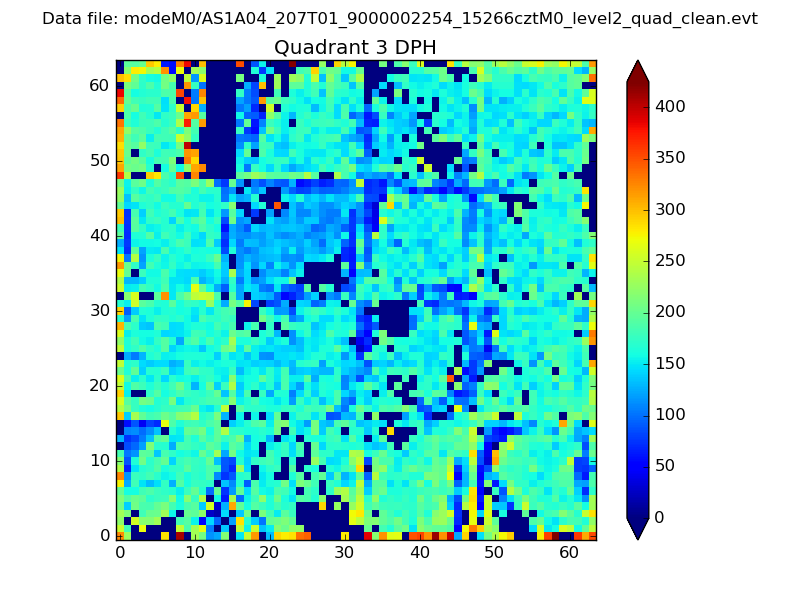 |
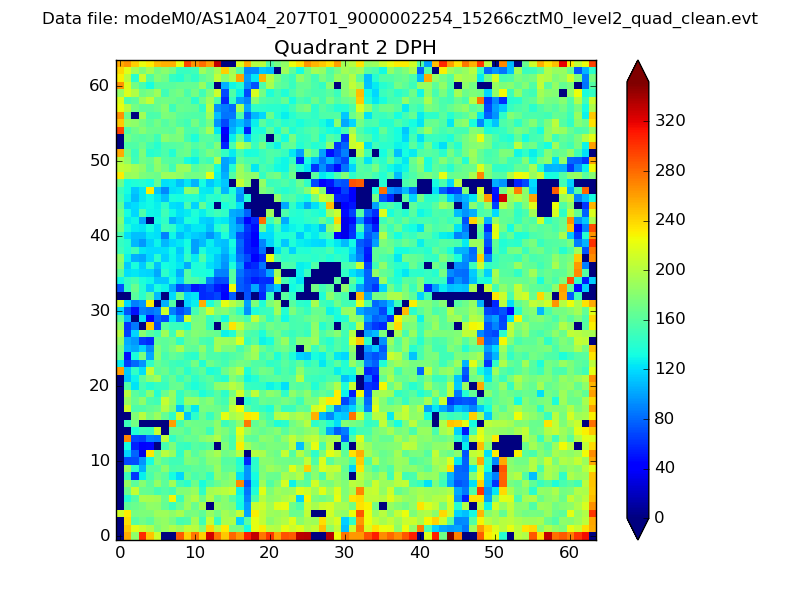 |
Quadrant C |
| Plot type | Count rate plots | Images |
|---|---|---|
| Comparison with Poisson distribution Blue bars denote a histogram of data divided into 1 sec bins. Red curve is a Poisson curve with rate = median count rate of data. |
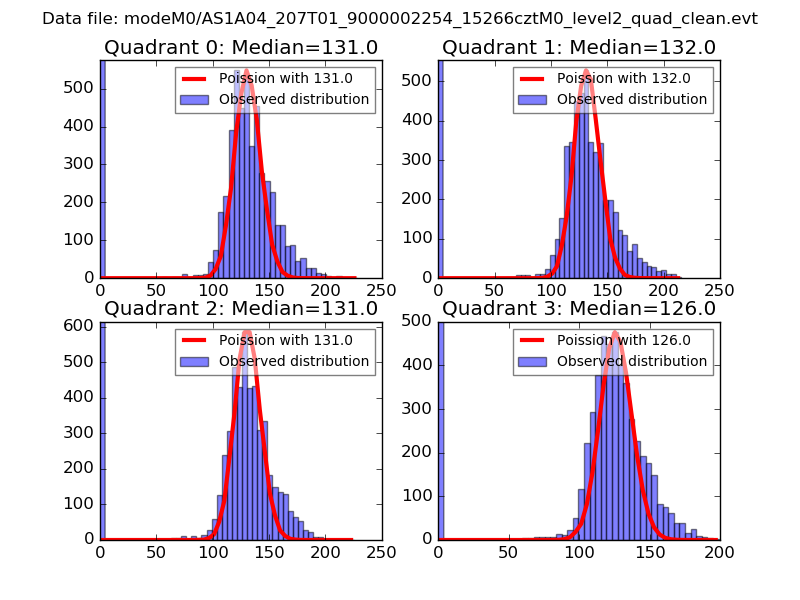 |
 |
| Quadrant-wise count rates Data is divided into 100 sec bins |
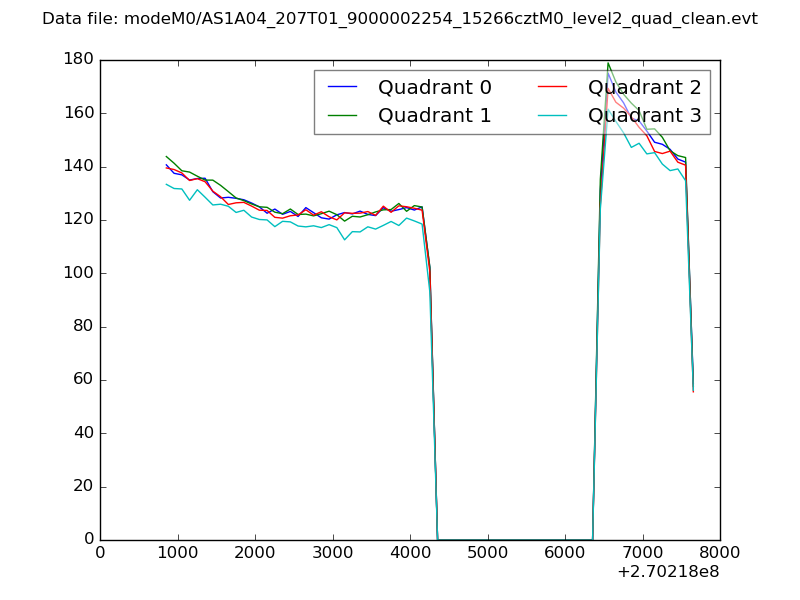 |
|
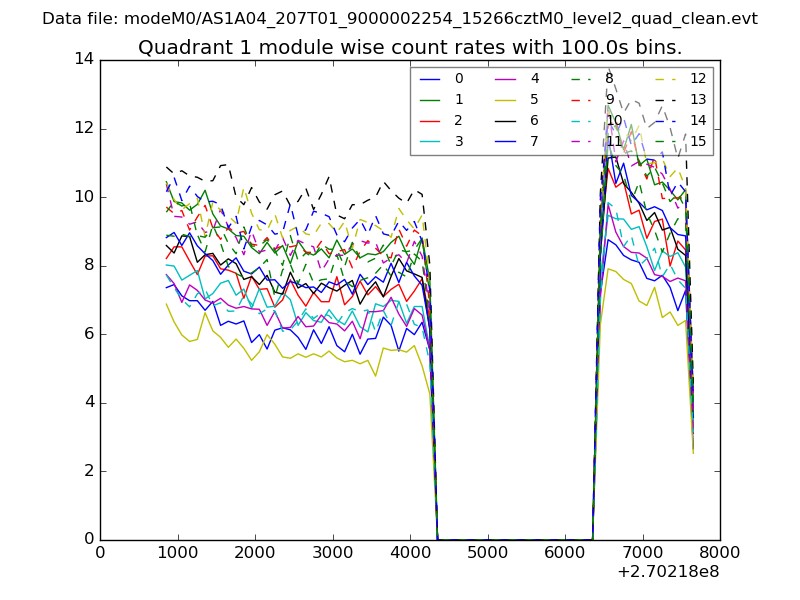
| Module-wise count rates for Quadrant A Data is divided into 100 sec bins |
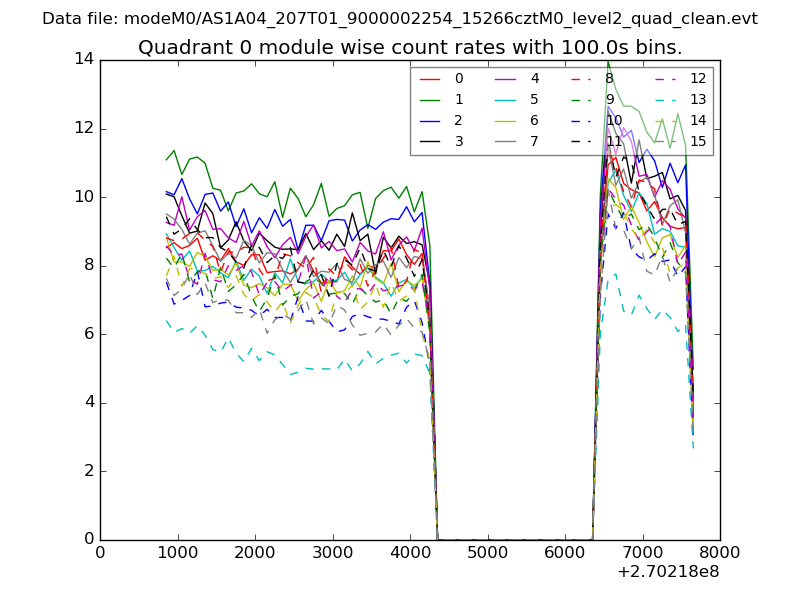 |
 |
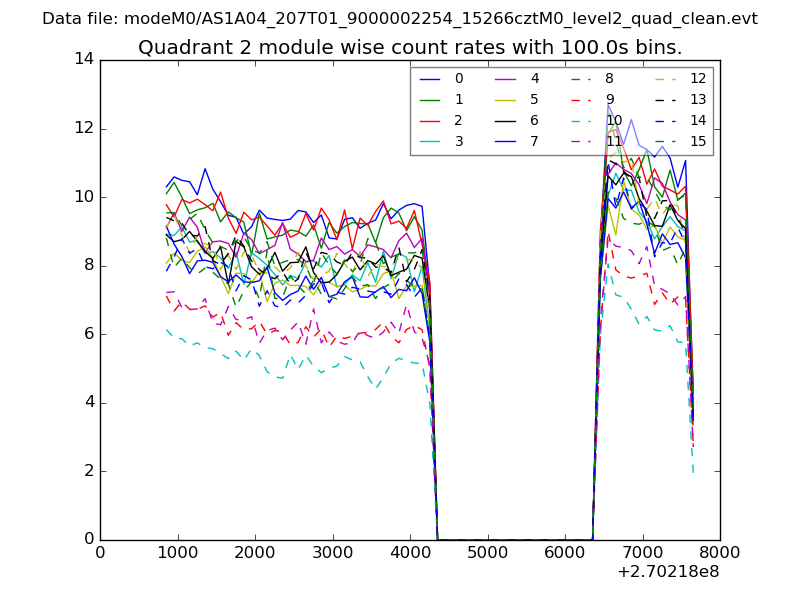
| Module-wise count rates for Quadrant B Data is divided into 100 sec bins |
 |
 |
| Module-wise count rates for Quadrant C Data is divided into 100 sec bins |
 |
 |
| Module-wise count rates for Quadrant D Data is divided into 100 sec bins |
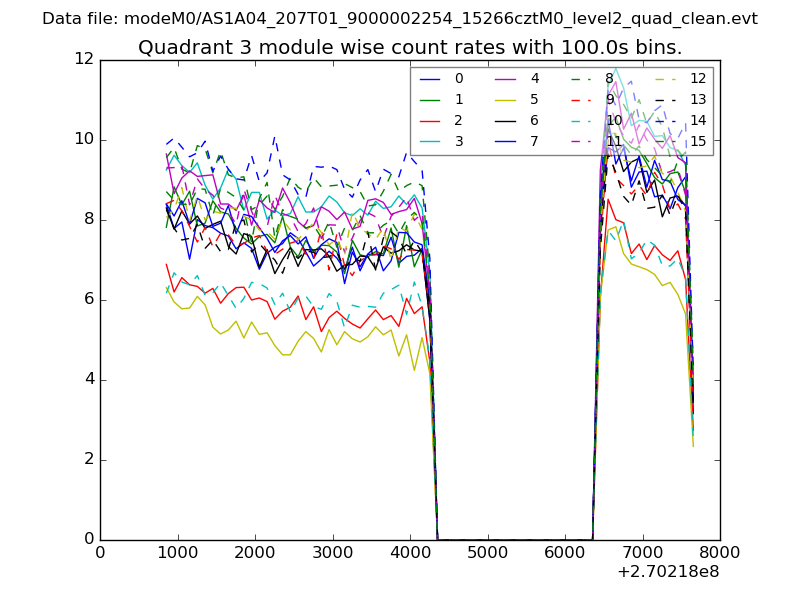 |
 |
| Parameter | Plot |
|---|---|
| CZT HV Monitor | 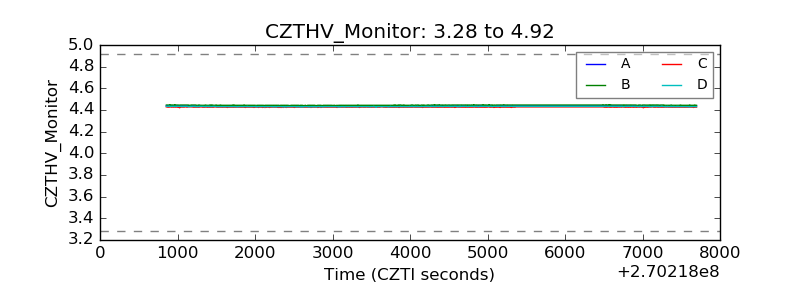 |
| D_VDD | 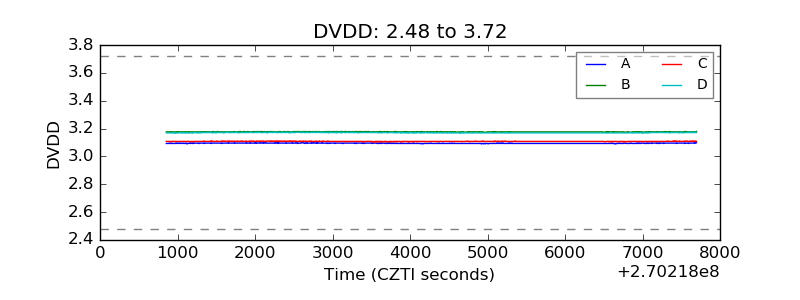 |
| Temperature 1 | 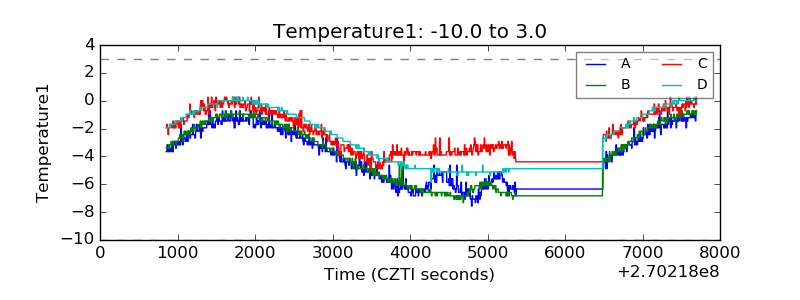 |
| Veto HV Monitor |  |
| Veto LLD | 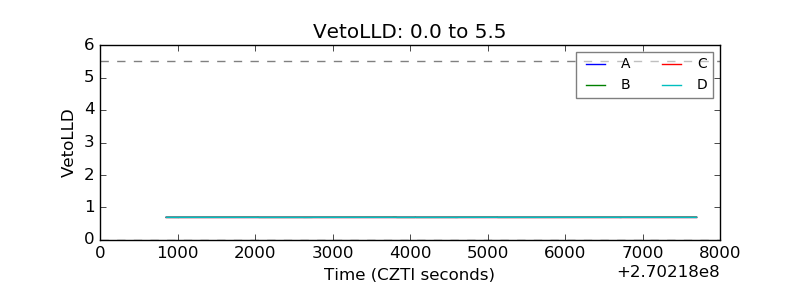 |
| Alpha Counter | 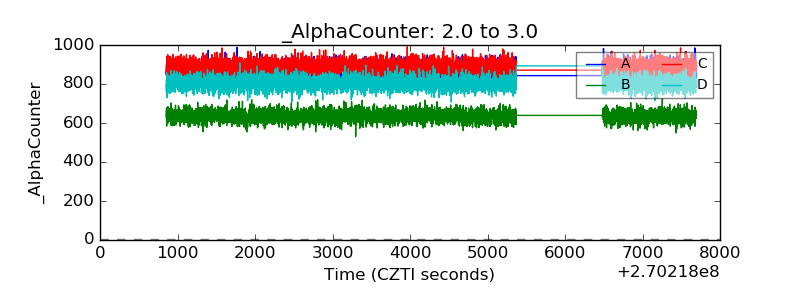 |
| _CPM_Rate | 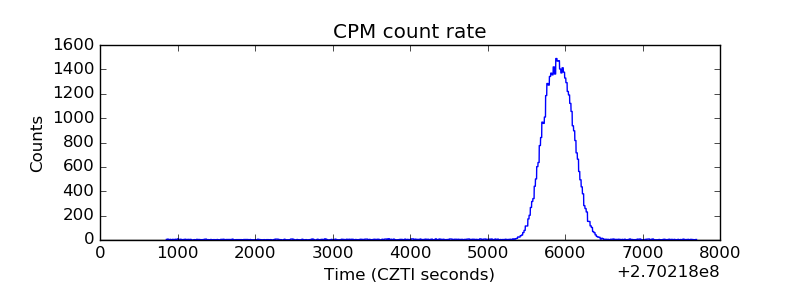 |
| CZT Counter | 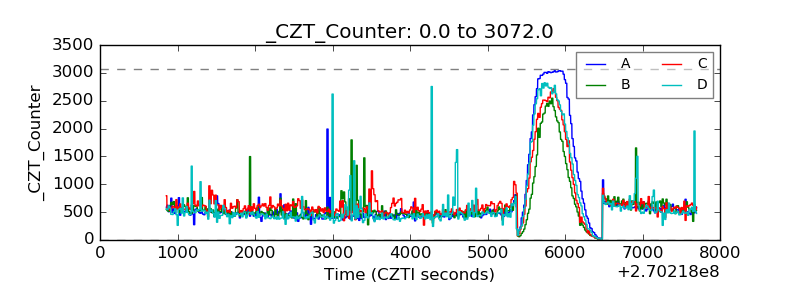 |
| +2.5 Volts monitor |  |
| +5 Volts monitor |  |
| _ROLL_ROT | 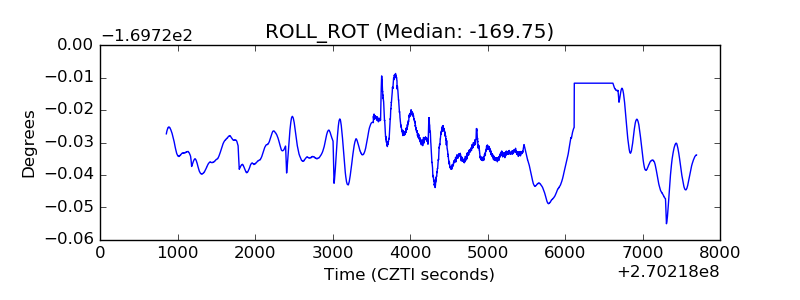 |
| _Roll_DEC | 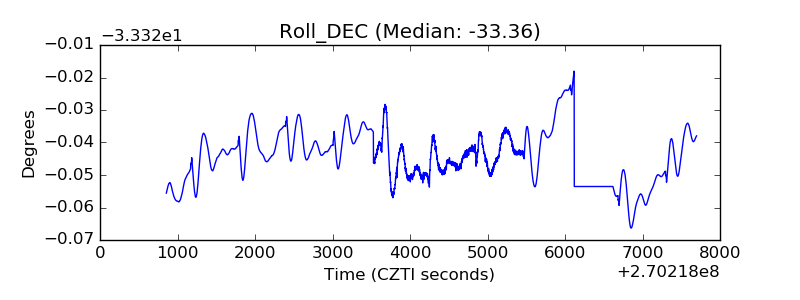 |
| _Roll_RA | 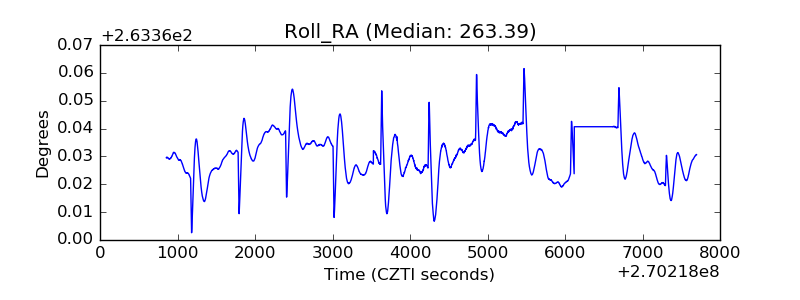 |
| Veto Counter | 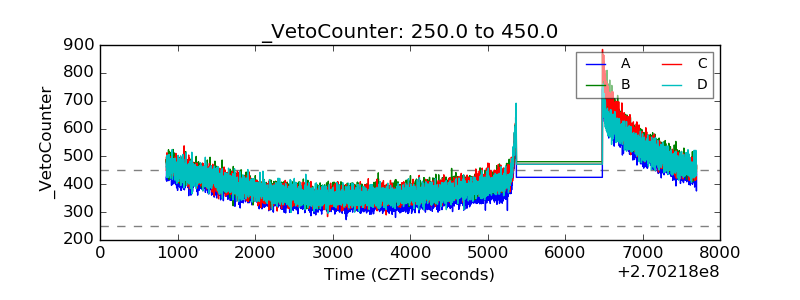 |