| Param | Original file | Final file |
|---|---|---|
| Filename | modeM0/AS1A04_207T01_9000002254_15268cztM0_level2.evt | modeM0/AS1A04_207T01_9000002254_15268cztM0_level2_quad_clean.evt |
| Size (bytes) | 499,728,960 | 112,063,680 |
| Size | 476.6 MB | 106.9 MB |
| Events in quadrant A | 3,466,884 | 748,149 |
| Events in quadrant B | 3,568,388 | 754,122 |
| Events in quadrant C | 3,918,875 | 731,282 |
| Events in quadrant D | 3,736,795 | 704,722 |
| Mode SS | |||
|---|---|---|---|
| Quadrant | BADHDUFLAG | Total packets | Discarded packets |
| A | 0 | 134 | 0 |
| B | 0 | 134 | 0 |
| C | 0 | 134 | 0 |
| D | 0 | 134 | 0 |
| Mode M0 | |||
|---|---|---|---|
| Quadrant | BADHDUFLAG | Total packets | Discarded packets |
| A | 0 | 14635 | 70 |
| B | 0 | 15006 | 61 |
| C | 0 | 16262 | 53 |
| D | 0 | 15502 | 64 |
| Mode M9 | |||
|---|---|---|---|
| Quadrant | BADHDUFLAG | Total packets | Discarded packets |
| A | 0 | 12 | 0 |
| B | 0 | 12 | 0 |
| C | 0 | 12 | 0 |
| D | 0 | 12 | 0 |
| Quadrant | Total seconds | Saturated seconds | Saturation percentage |
|---|---|---|---|
| A | 6529 | 80 | 1.225302% |
| B | 6533 | 81 | 1.239859% |
| C | 6535 | 61 | 0.933435% |
| D | 6530 | 167 | 2.557427% |
Noise dominated data is calculated using 1-second bins in cleaned event files. If a bin has >2000 counts, and if more than 50% of those come from <1% of pixels, then it is considered to be noise-dominated and hence unusable.
| Quadrant | # 1 sec bins | Bins with >0 counts | Bins with >2000 counts | High rate bins dominated by noise | Noise dominated (total time) | Noise dominated (detector-on time) | Marked lightcurve |
|---|---|---|---|---|---|---|---|
| A | 7734 | 6537 | 3 | 3 | 0.04% | 0.05% | 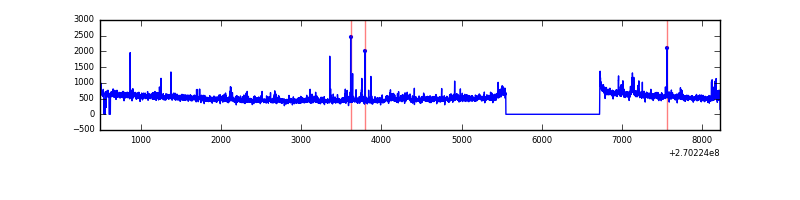 |
| B | 7734 | 6539 | 3 | 3 | 0.04% | 0.05% | 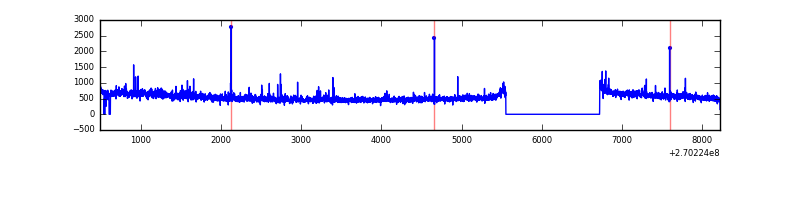 |
| C | 7734 | 6541 | 2 | 2 | 0.03% | 0.03% | 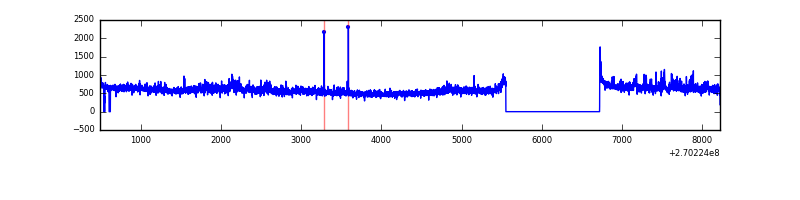 |
| D | 7734 | 6535 | 101 | 101 | 1.31% | 1.55% | 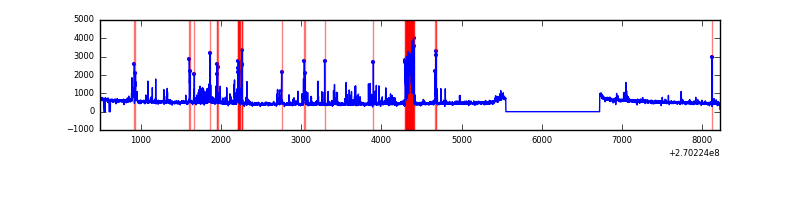 |
Top three noisy pixels from each quadrant. If the there are fewer than three noisy pixels in the level2.evt file, extra rows are filled as -1
| Pixel properties | Quadrant properties | ||||||
|---|---|---|---|---|---|---|---|
| Quadrant | DetID | PixID | Counts | Sigma | Mean | Median | Sigma |
| A | 12 | 189 | 123705 | 709.73 | 851 | 833 | 173.1 |
| A | 3 | 1 | 27370 | 153.28 | 851 | 833 | 173.1 |
| A | 9 | 143 | 24961 | 139.37 | 851 | 833 | 173.1 |
| B | 0 | 219 | 76284 | 472.57 | 843 | 824 | 159.7 |
| B | 0 | 205 | 48363 | 297.71 | 843 | 824 | 159.7 |
| B | 0 | 189 | 34655 | 211.87 | 843 | 824 | 159.7 |
| C | 3 | 233 | 641606 | 3463.69 | 806 | 812 | 185.0 |
| C | 3 | 9 | 121832 | 654.15 | 806 | 812 | 185.0 |
| C | 4 | 254 | 9778 | 48.46 | 806 | 812 | 185.0 |
| D | 13 | 172 | 299790 | 1510.33 | 812 | 790 | 198.0 |
| D | 2 | 33 | 127977 | 642.46 | 812 | 790 | 198.0 |
| D | 8 | 195 | 107862 | 540.85 | 812 | 790 | 198.0 |
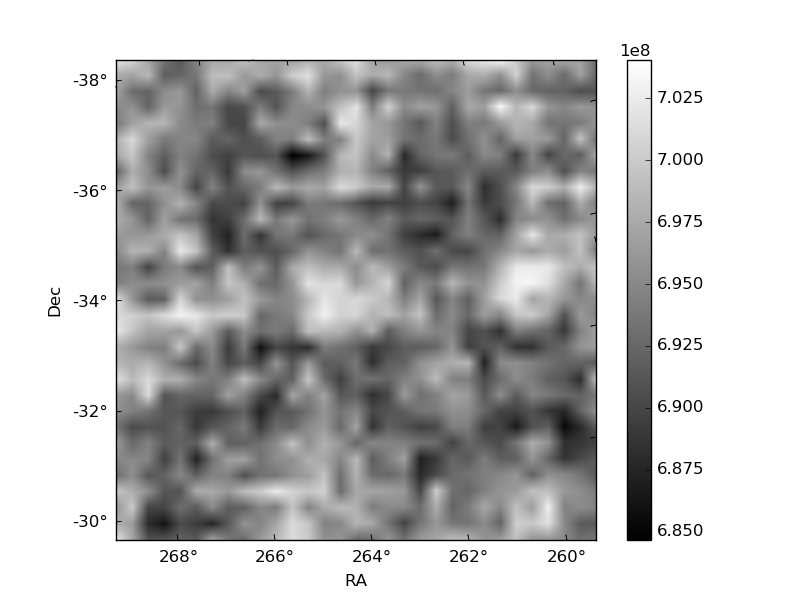
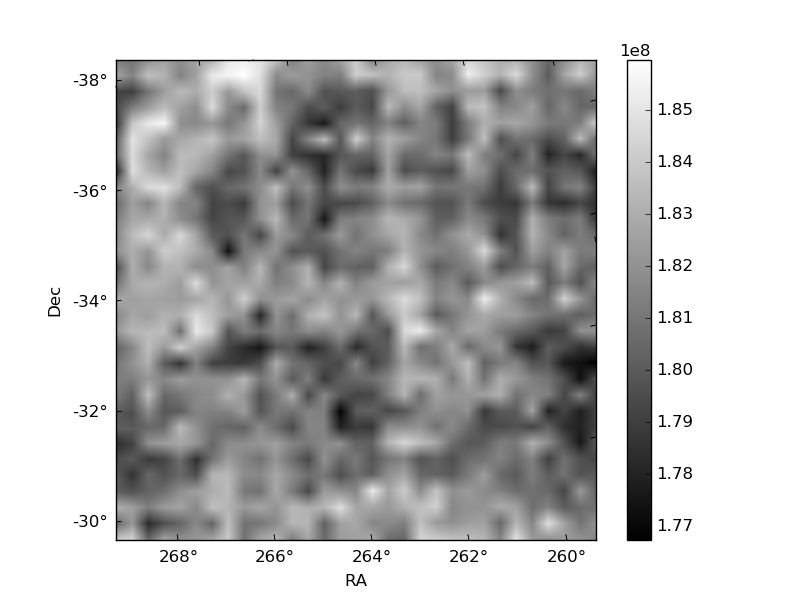
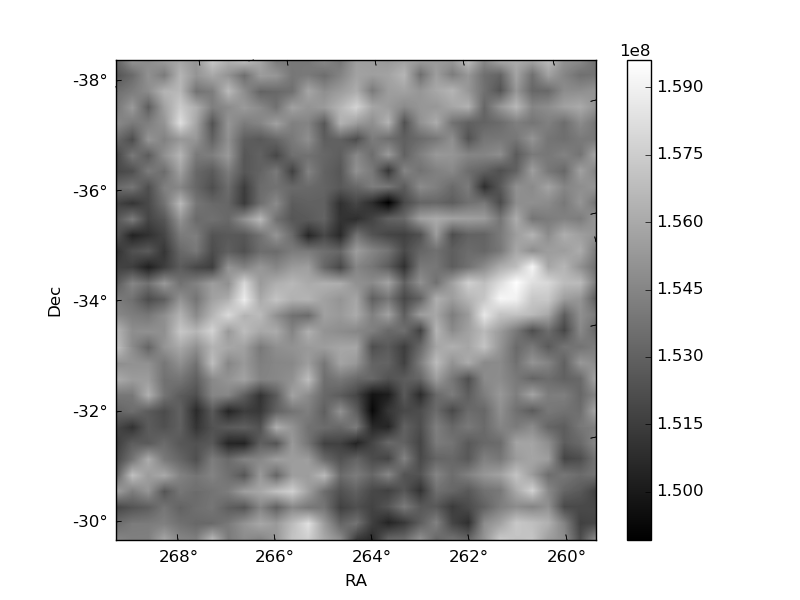
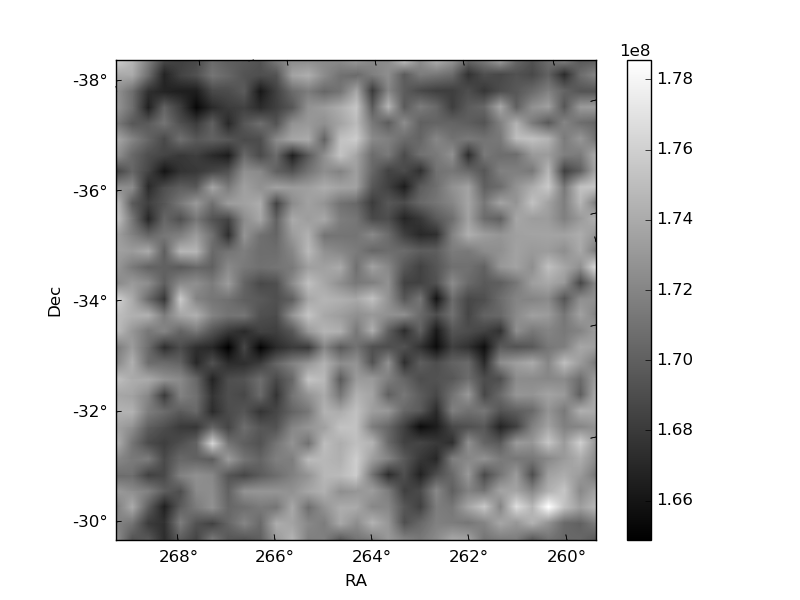
Histogram calculated using DETX and DETY for each event in the final _common_clean file
| Quadrant A | 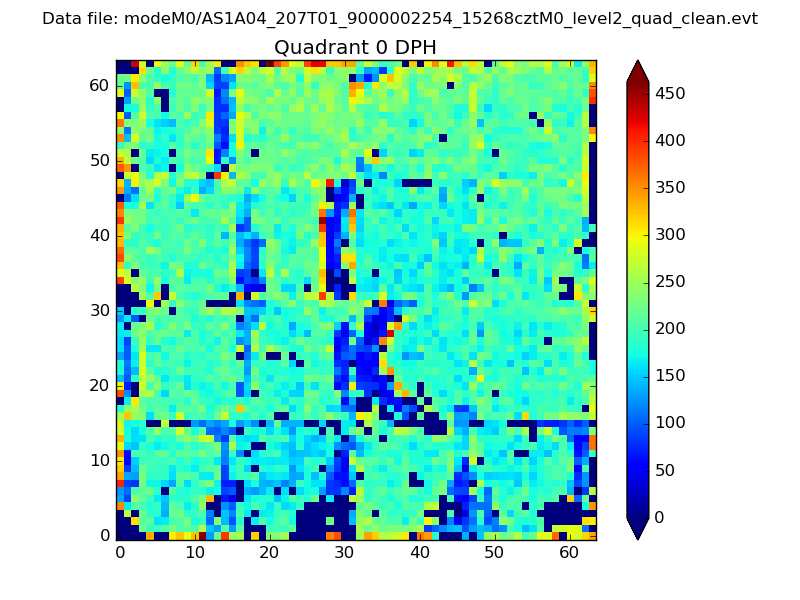 |
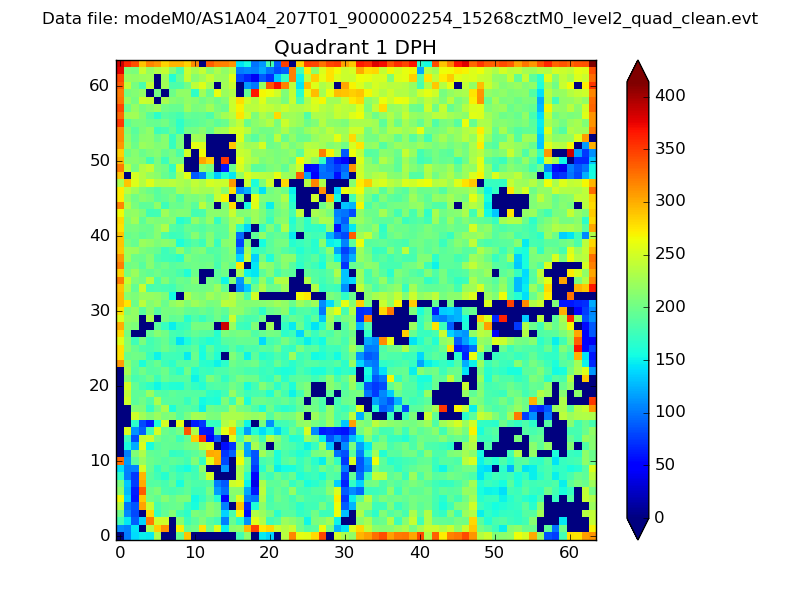 |
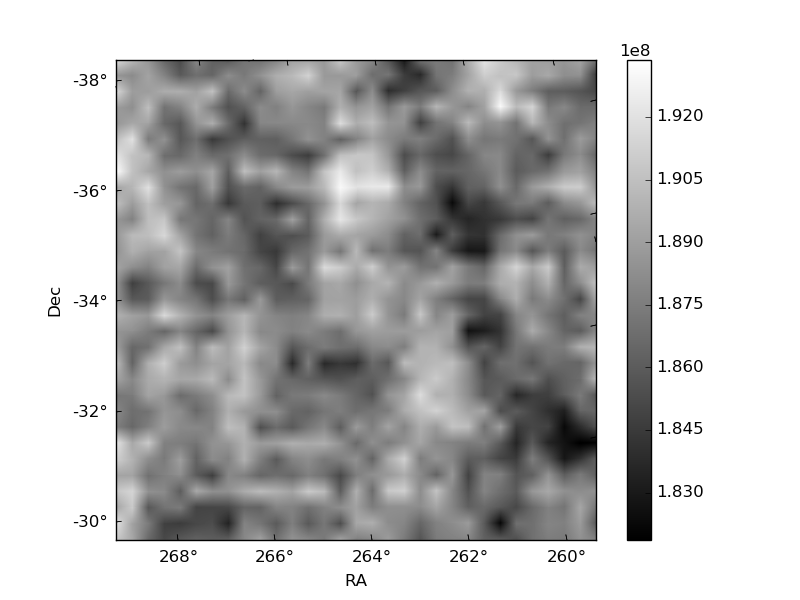
Quadrant B |
|---|---|---|---|
| Quadrant D | 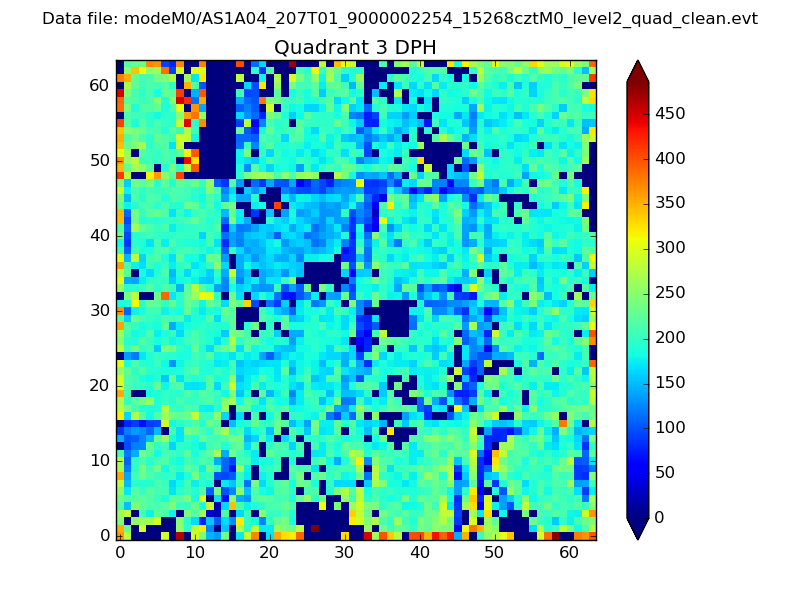 |
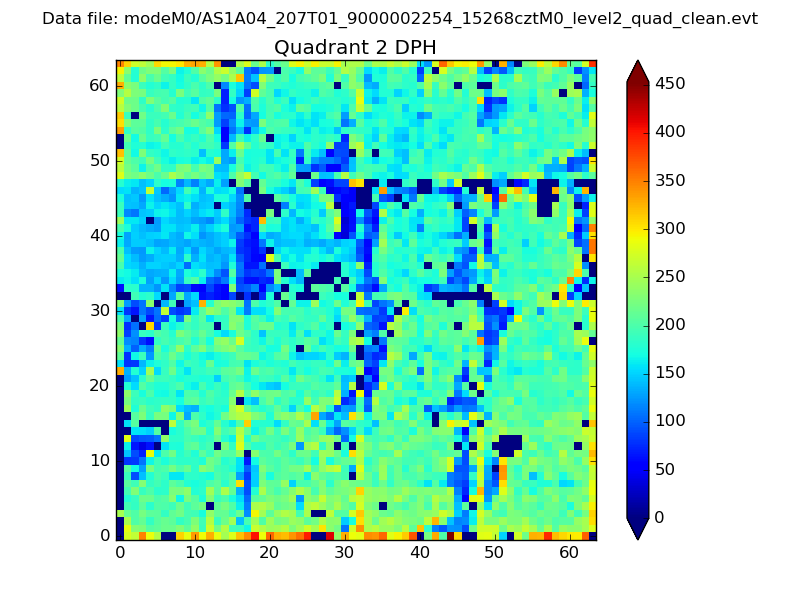 |
Quadrant C |
| Plot type | Count rate plots | Images |
|---|---|---|
| Comparison with Poisson distribution Blue bars denote a histogram of data divided into 1 sec bins. Red curve is a Poisson curve with rate = median count rate of data. |
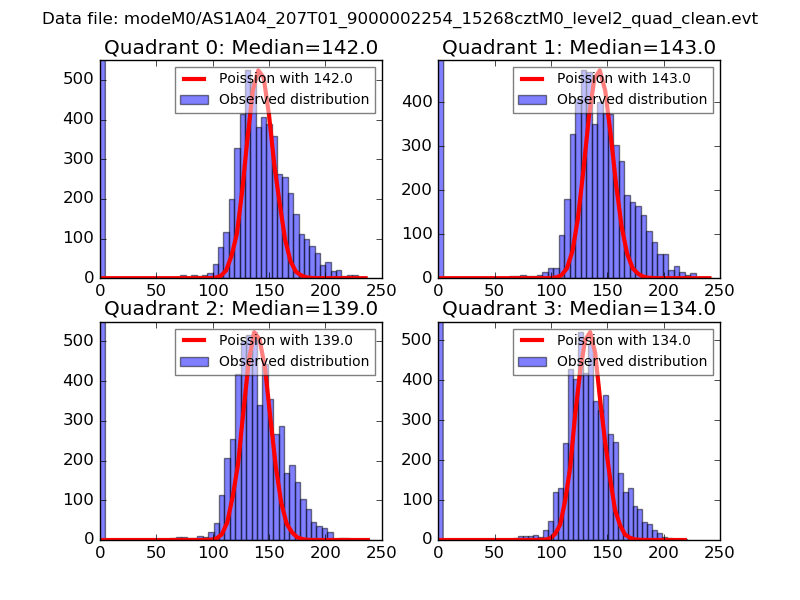 |
 |
| Quadrant-wise count rates Data is divided into 100 sec bins |
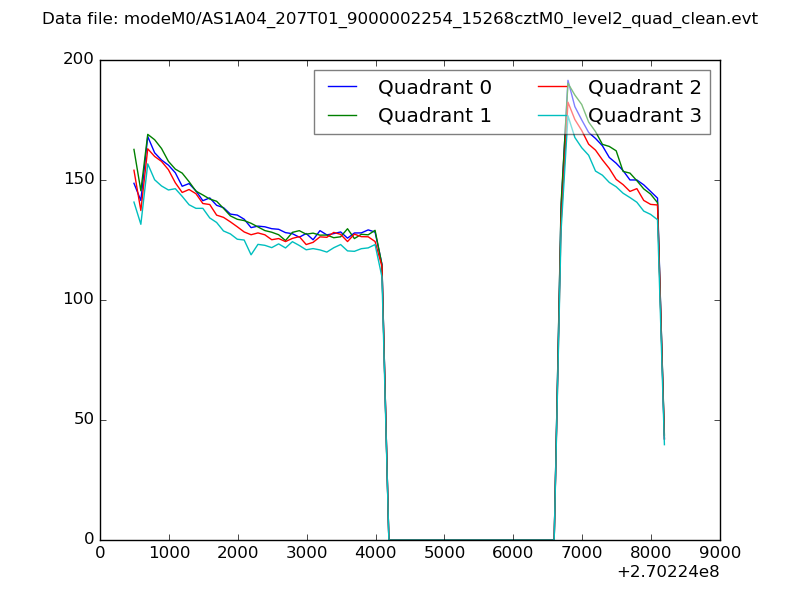 |
|
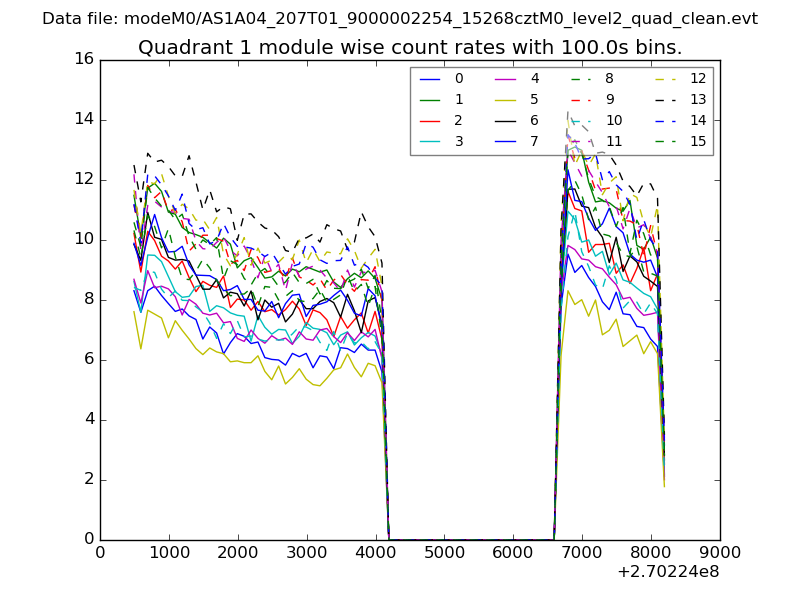
| Module-wise count rates for Quadrant A Data is divided into 100 sec bins |
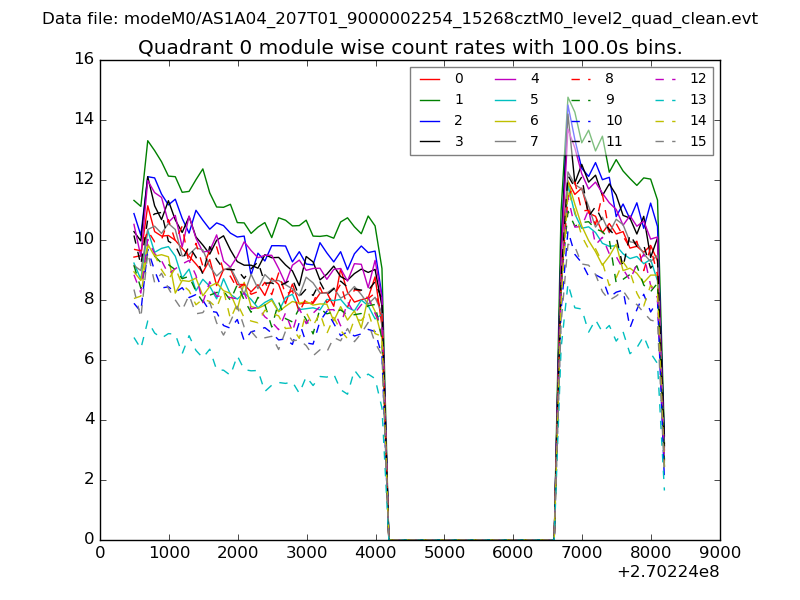 |
 |
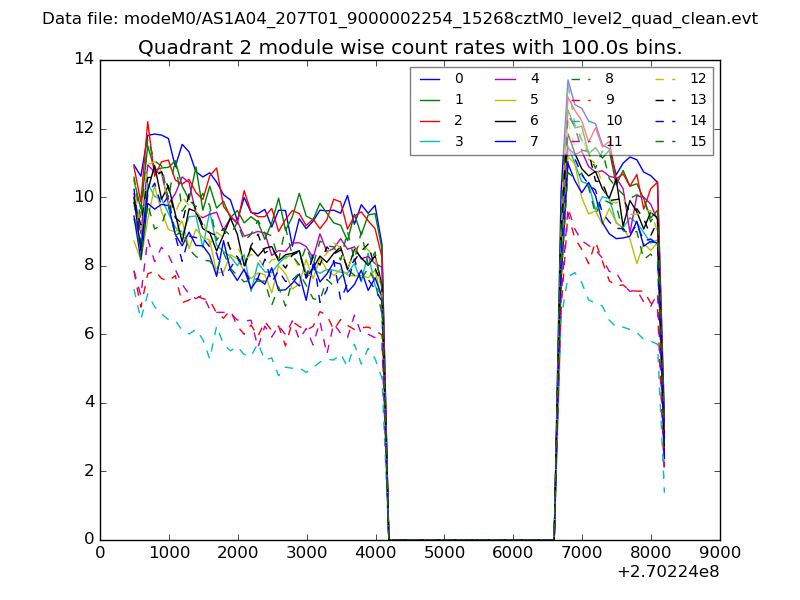
| Module-wise count rates for Quadrant B Data is divided into 100 sec bins |
 |
 |
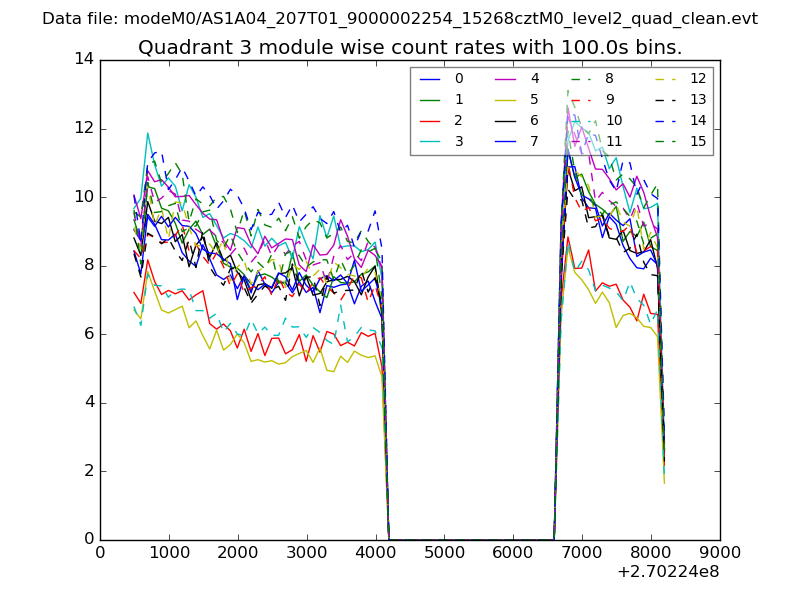
| Module-wise count rates for Quadrant C Data is divided into 100 sec bins |
 |
 |
| Module-wise count rates for Quadrant D Data is divided into 100 sec bins |
 |
 |
| Parameter | Plot |
|---|---|
| CZT HV Monitor | 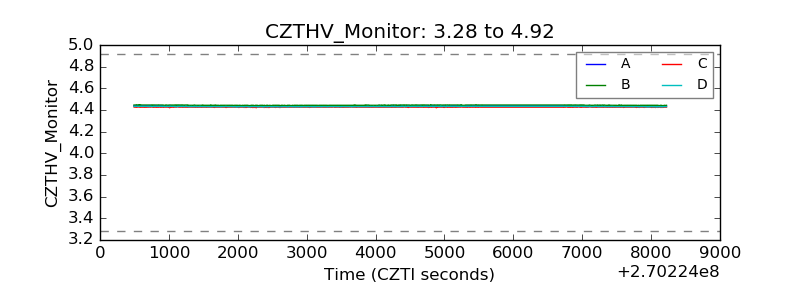 |
| D_VDD | 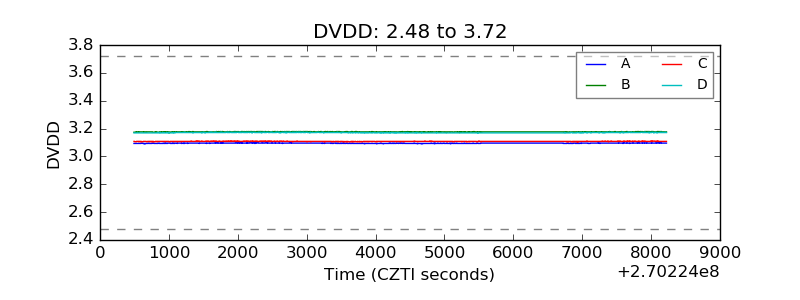 |
| Temperature 1 | 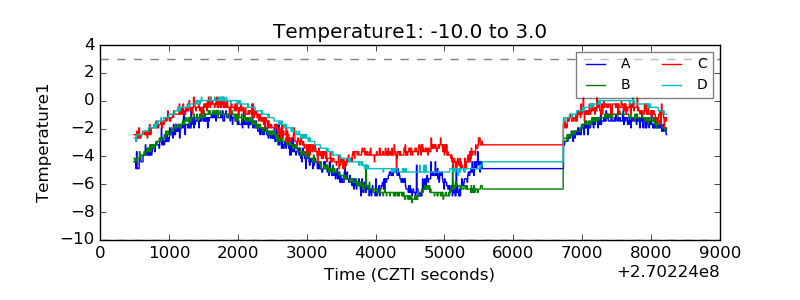 |
| Veto HV Monitor | 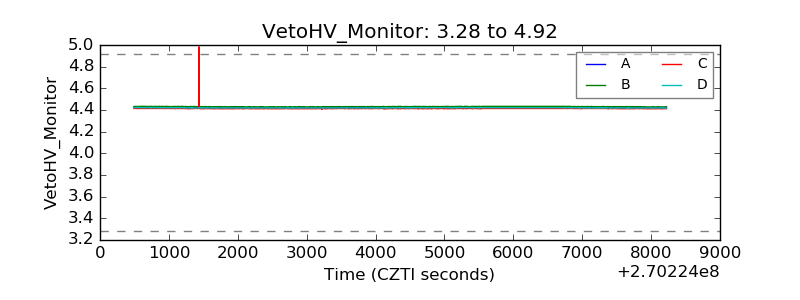 |
| Veto LLD | 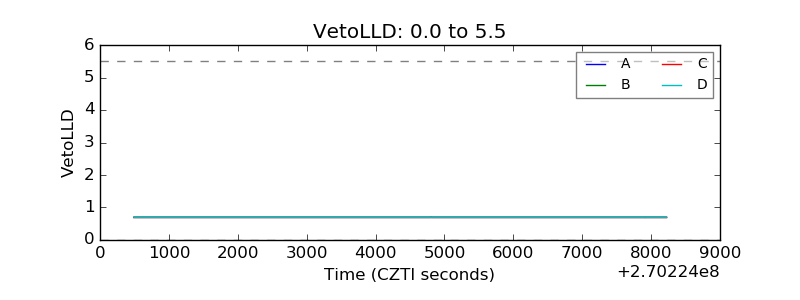 |
| Alpha Counter | 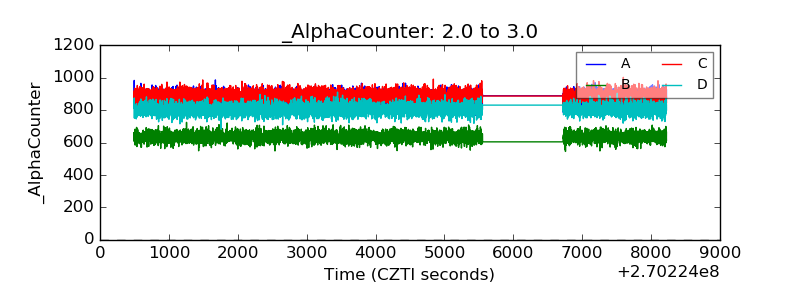 |
| _CPM_Rate | 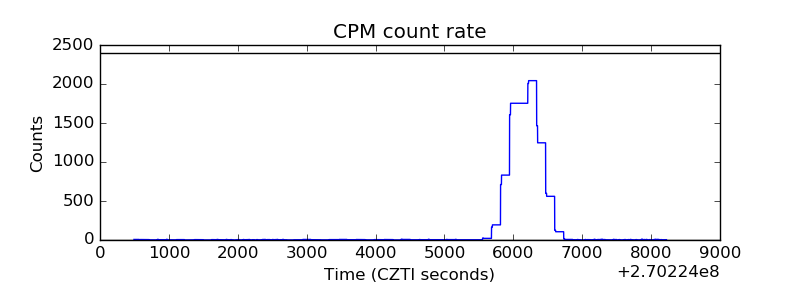 |
| CZT Counter | 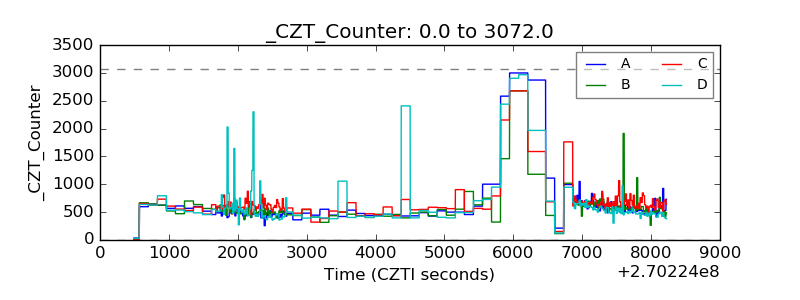 |
| +2.5 Volts monitor |  |
| +5 Volts monitor | 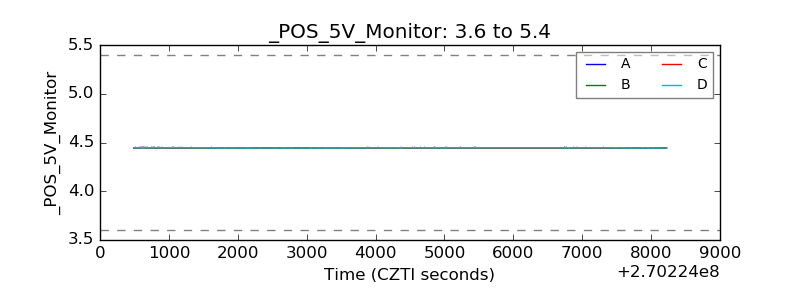 |
| _ROLL_ROT | 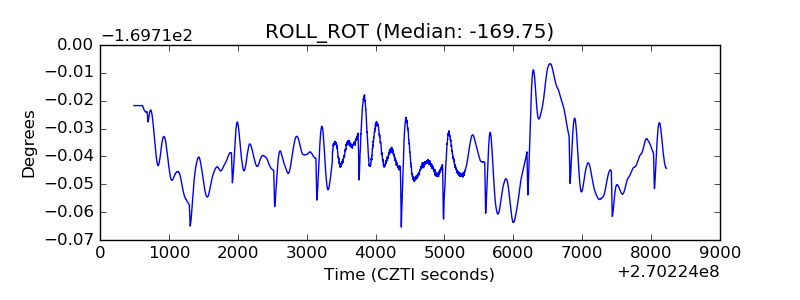 |
| _Roll_DEC | 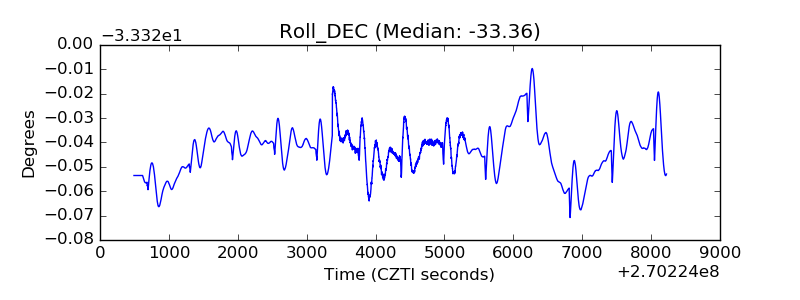 |
| _Roll_RA | 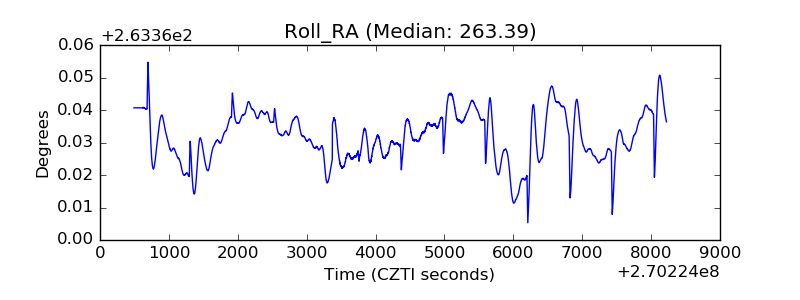 |
| Veto Counter | 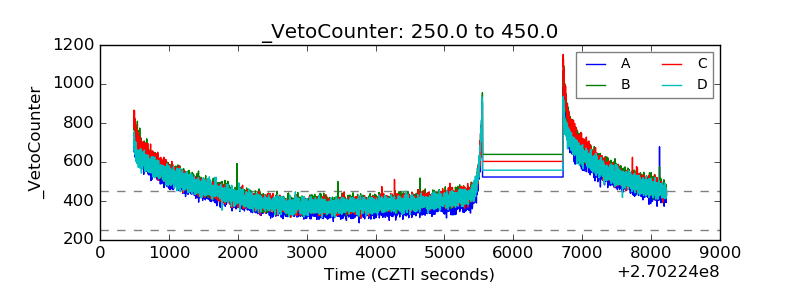 |