| Param | Original file | Final file |
|---|---|---|
| Filename | modeM0/AS1A04_207T01_9000002254_15269cztM0_level2.evt | modeM0/AS1A04_207T01_9000002254_15269cztM0_level2_quad_clean.evt |
| Size (bytes) | 474,333,120 | 103,443,840 |
| Size | 452.4 MB | 98.7 MB |
| Events in quadrant A | 3,329,243 | 690,345 |
| Events in quadrant B | 3,599,961 | 692,815 |
| Events in quadrant C | 3,772,925 | 668,436 |
| Events in quadrant D | 3,236,785 | 642,855 |
| Mode SS | |||
|---|---|---|---|
| Quadrant | BADHDUFLAG | Total packets | Discarded packets |
| A | 0 | 128 | 0 |
| B | 0 | 128 | 0 |
| C | 0 | 128 | 0 |
| D | 0 | 128 | 0 |
| Mode M0 | |||
|---|---|---|---|
| Quadrant | BADHDUFLAG | Total packets | Discarded packets |
| A | 0 | 13935 | 2 |
| B | 0 | 14777 | 1 |
| C | 0 | 15548 | 1 |
| D | 0 | 13817 | 1 |
| Mode M9 | |||
|---|---|---|---|
| Quadrant | BADHDUFLAG | Total packets | Discarded packets |
| A | 0 | 13 | 0 |
| B | 0 | 13 | 0 |
| C | 0 | 13 | 0 |
| D | 0 | 13 | 0 |
| Quadrant | Total seconds | Saturated seconds | Saturation percentage |
|---|---|---|---|
| A | 6279 | 68 | 1.082975% |
| B | 6279 | 84 | 1.337793% |
| C | 6279 | 46 | 0.732601% |
| D | 6279 | 70 | 1.114827% |
Noise dominated data is calculated using 1-second bins in cleaned event files. If a bin has >2000 counts, and if more than 50% of those come from <1% of pixels, then it is considered to be noise-dominated and hence unusable.
| Quadrant | # 1 sec bins | Bins with >0 counts | Bins with >2000 counts | High rate bins dominated by noise | Noise dominated (total time) | Noise dominated (detector-on time) | Marked lightcurve |
|---|---|---|---|---|---|---|---|
| A | 7560 | 6280 | 1 | 1 | 0.01% | 0.02% | 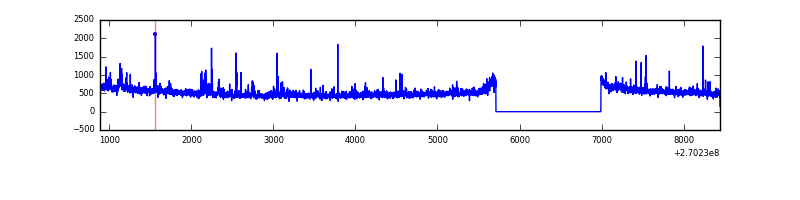 |
| B | 7560 | 6280 | 14 | 14 | 0.19% | 0.22% | 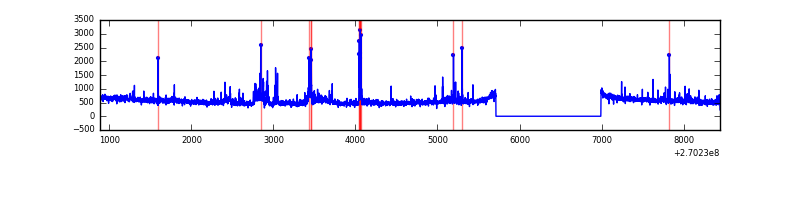 |
| C | 7560 | 6281 | 4 | 4 | 0.05% | 0.06% | 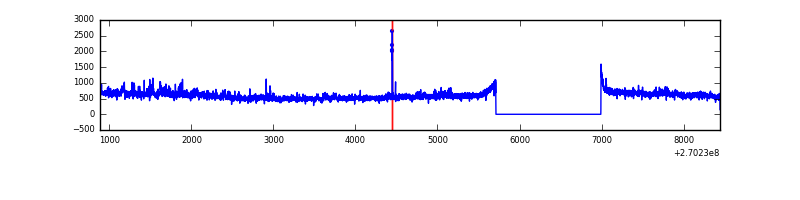 |
| D | 7560 | 6280 | 24 | 24 | 0.32% | 0.38% | 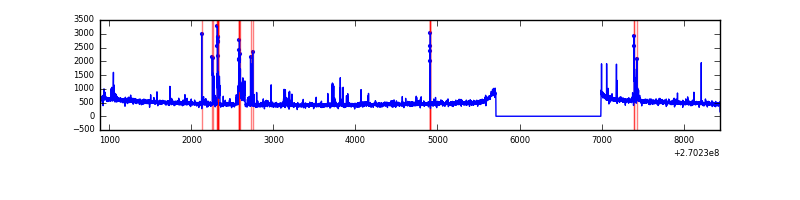 |
Top three noisy pixels from each quadrant. If the there are fewer than three noisy pixels in the level2.evt file, extra rows are filled as -1
| Pixel properties | Quadrant properties | ||||||
|---|---|---|---|---|---|---|---|
| Quadrant | DetID | PixID | Counts | Sigma | Mean | Median | Sigma |
| A | 12 | 189 | 71221 | 423.33 | 824 | 807 | 166.3 |
| A | 9 | 143 | 37913 | 223.08 | 824 | 807 | 166.3 |
| A | 3 | 1 | 27825 | 162.43 | 824 | 807 | 166.3 |
| B | 3 | 64 | 124001 | 793.65 | 817 | 800 | 155.2 |
| B | 3 | 209 | 82957 | 529.25 | 817 | 800 | 155.2 |
| B | 10 | 16 | 39466 | 249.08 | 817 | 800 | 155.2 |
| C | 3 | 233 | 618412 | 3489.35 | 776 | 780 | 177.0 |
| C | 3 | 9 | 110978 | 622.57 | 776 | 780 | 177.0 |
| C | 4 | 254 | 16307 | 87.72 | 776 | 780 | 177.0 |
| D | 13 | 172 | 138964 | 716.66 | 786 | 762 | 192.8 |
| D | 7 | 38 | 47685 | 243.32 | 786 | 762 | 192.8 |
| D | 2 | 234 | 26268 | 132.26 | 786 | 762 | 192.8 |
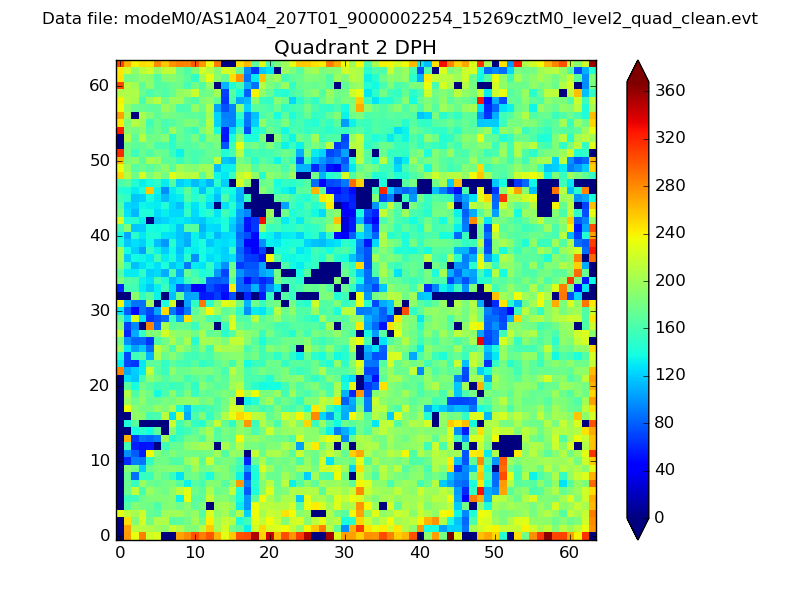
Histogram calculated using DETX and DETY for each event in the final _common_clean file
| Quadrant A | 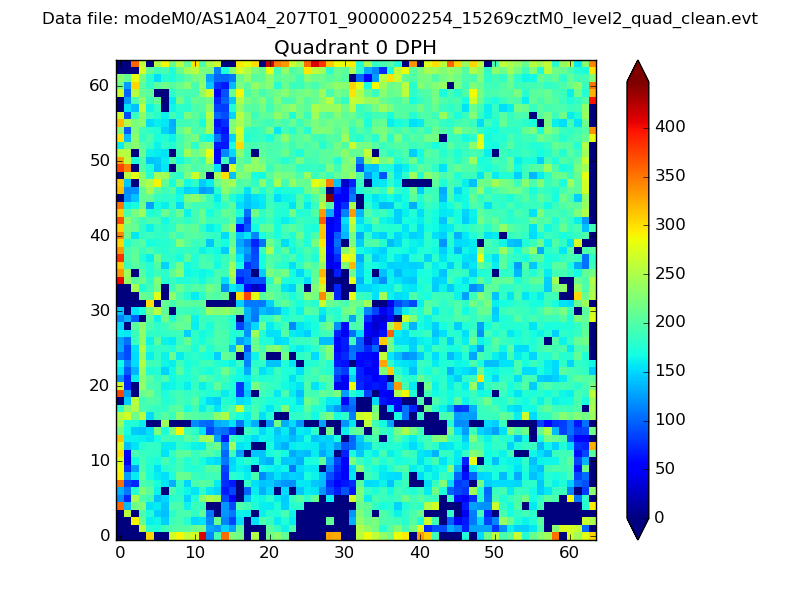 |
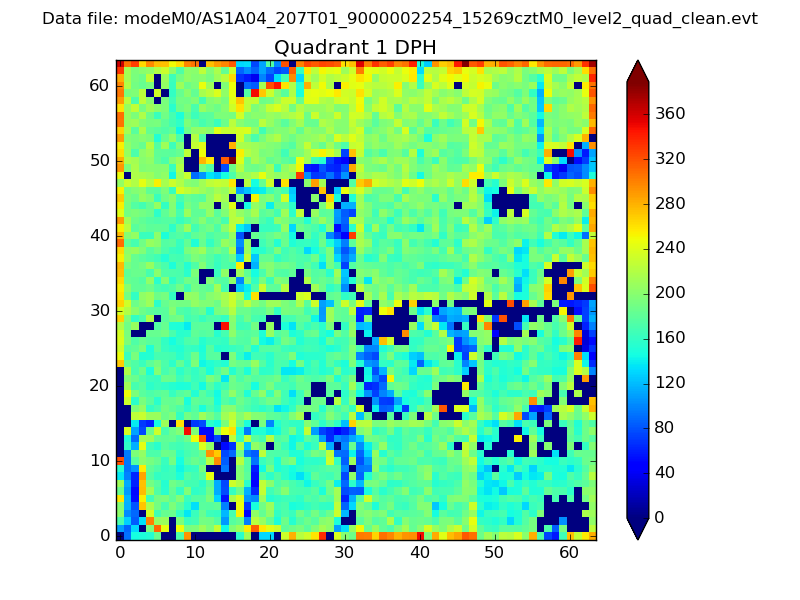 |
Quadrant B |
|---|---|---|---|
| Quadrant D | 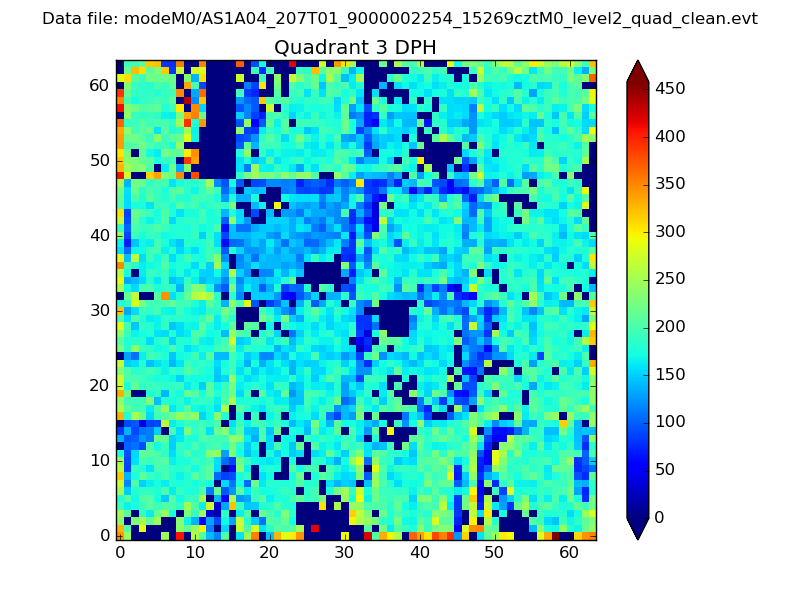 |
 |
Quadrant C |
| Plot type | Count rate plots | Images |
|---|---|---|
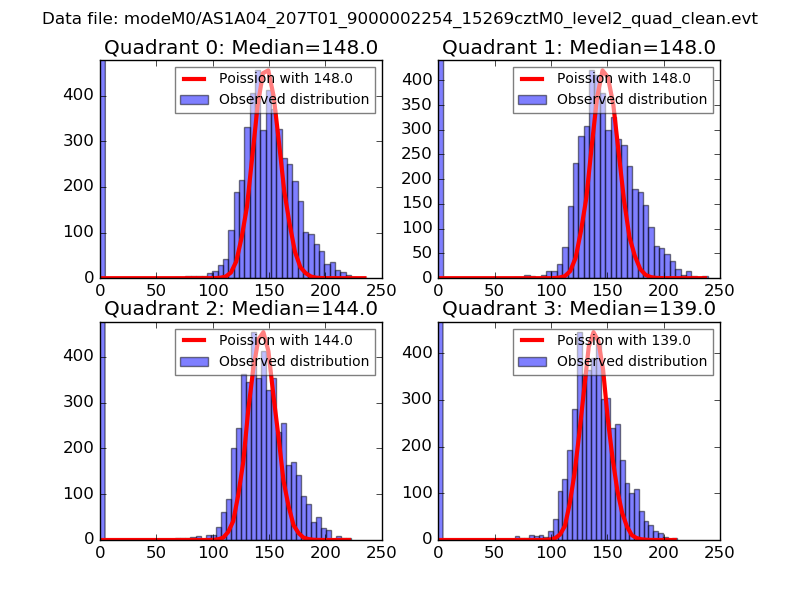
| Comparison with Poisson distribution Blue bars denote a histogram of data divided into 1 sec bins. Red curve is a Poisson curve with rate = median count rate of data. |
 |
 |
| Quadrant-wise count rates Data is divided into 100 sec bins |
 |
|
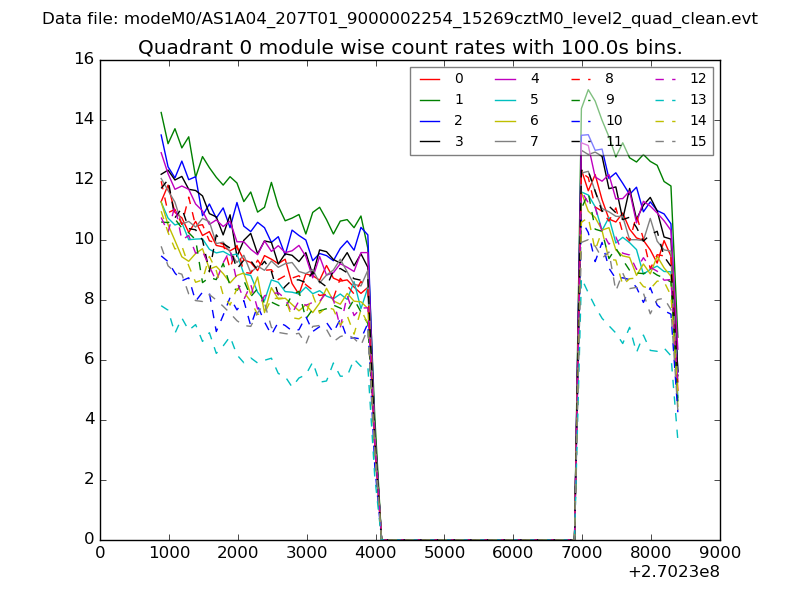
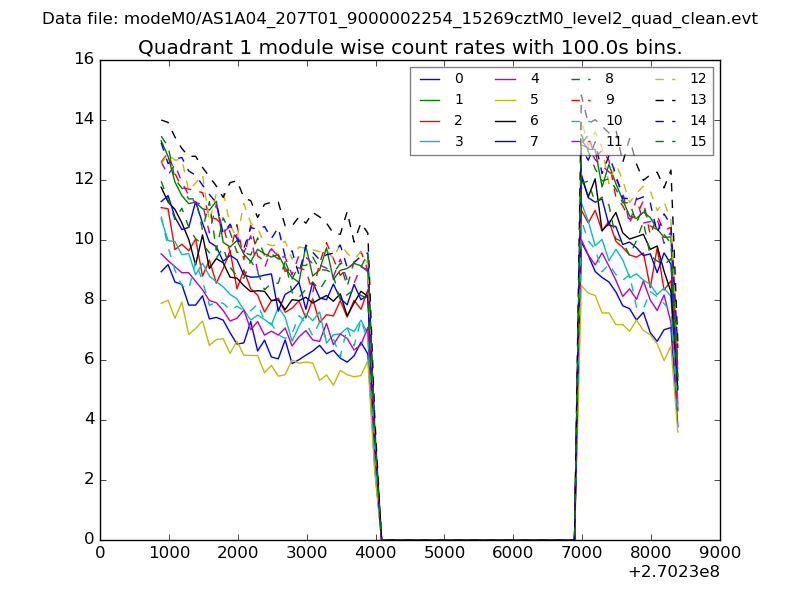
| Module-wise count rates for Quadrant A Data is divided into 100 sec bins |
 |
 |
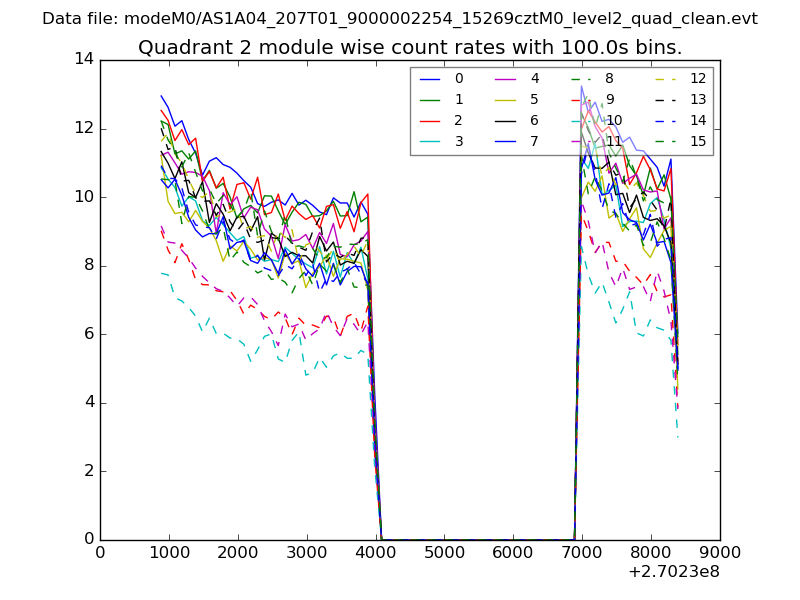
| Module-wise count rates for Quadrant B Data is divided into 100 sec bins |
 |
 |
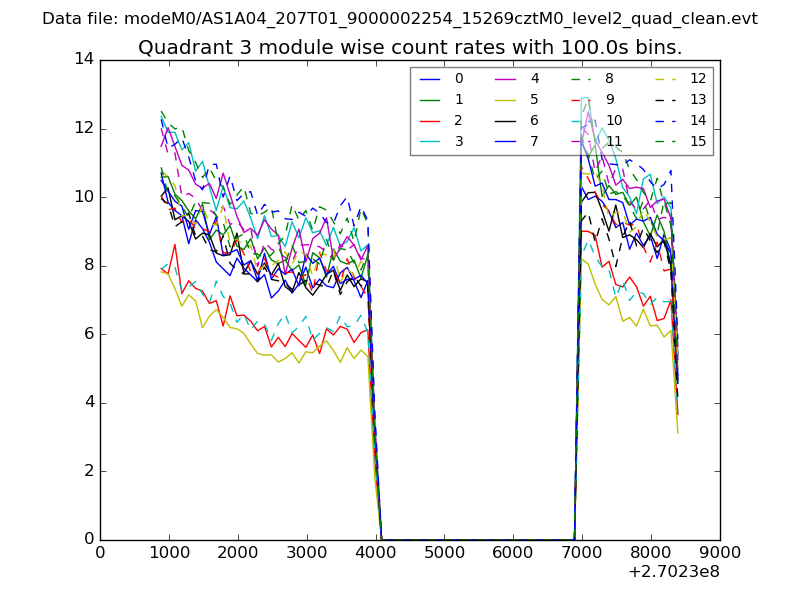
| Module-wise count rates for Quadrant C Data is divided into 100 sec bins |
 |
 |
| Module-wise count rates for Quadrant D Data is divided into 100 sec bins |
 |
 |
| Parameter | Plot |
|---|---|
| CZT HV Monitor | 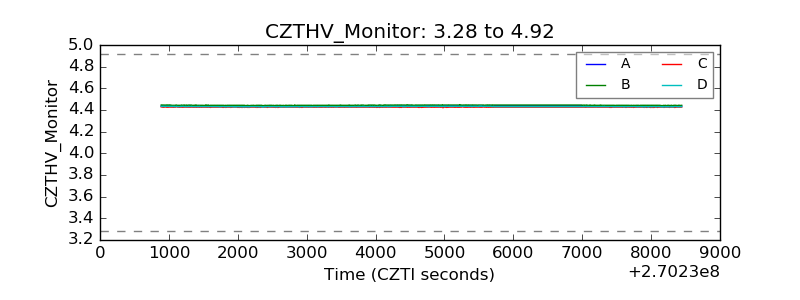 |
| D_VDD | 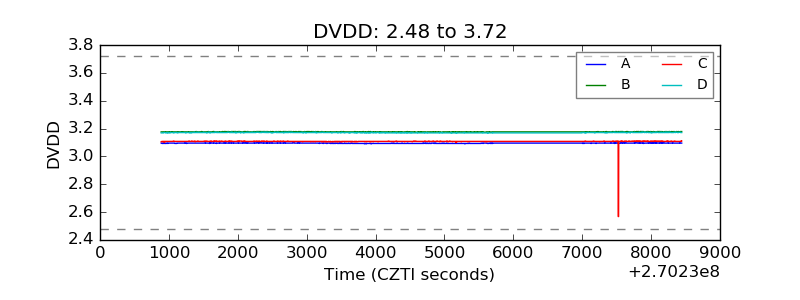 |
| Temperature 1 | 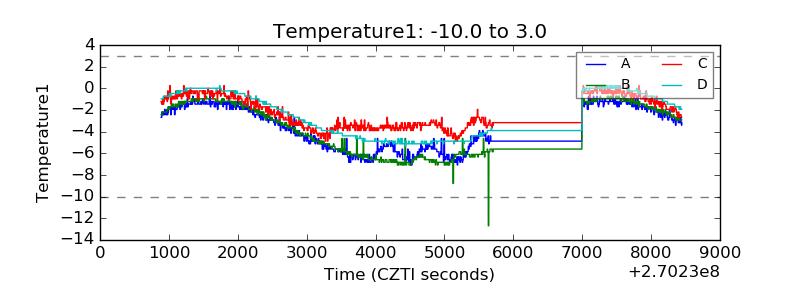 |
| Veto HV Monitor | 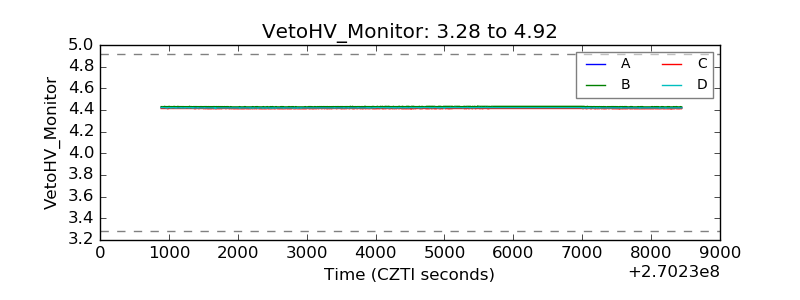 |
| Veto LLD | 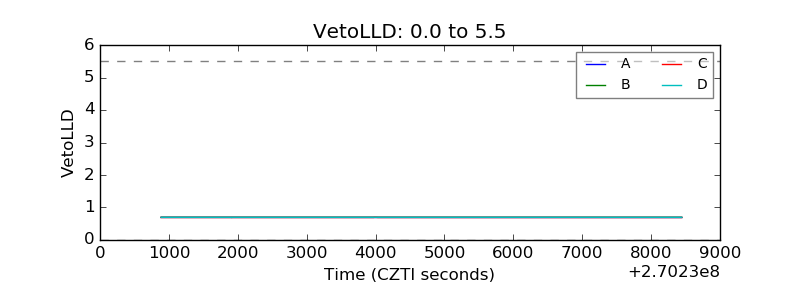 |
| Alpha Counter | 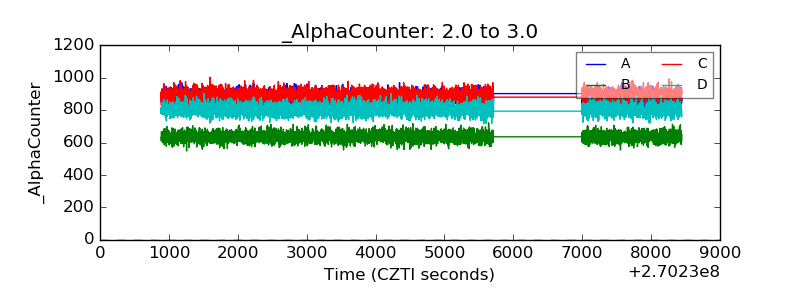 |
| _CPM_Rate | 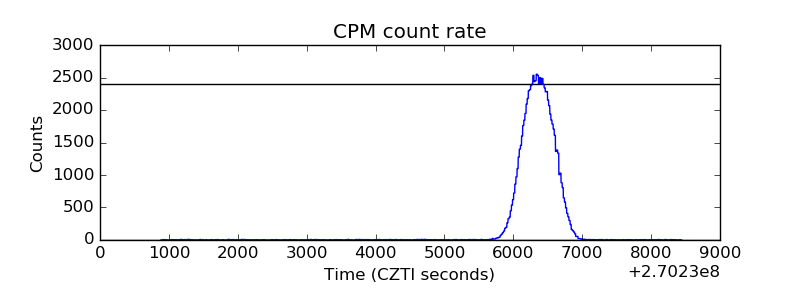 |
| CZT Counter | 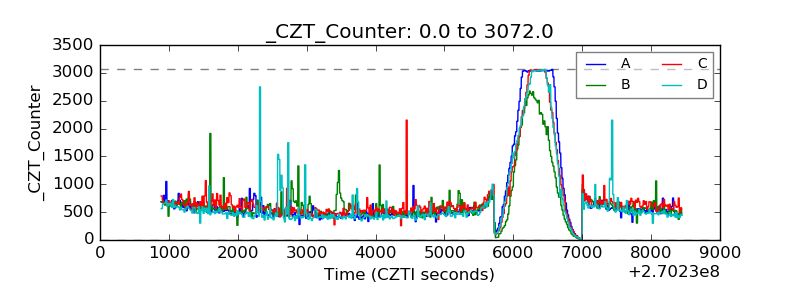 |
| +2.5 Volts monitor |  |
| +5 Volts monitor |  |
| _ROLL_ROT | 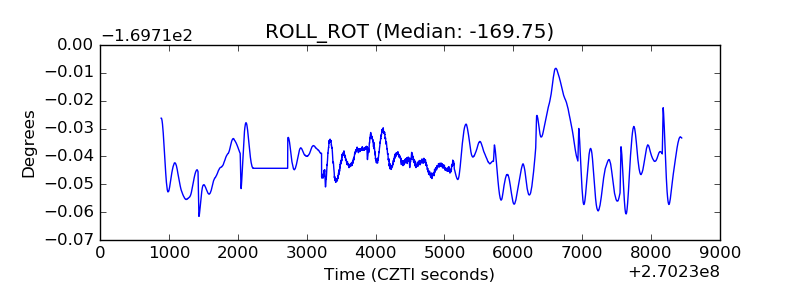 |
| _Roll_DEC | 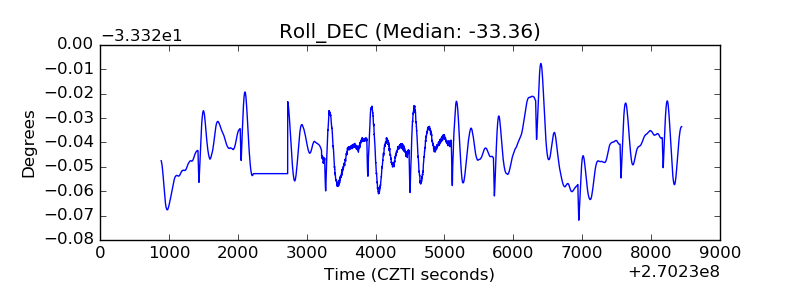 |
| _Roll_RA | 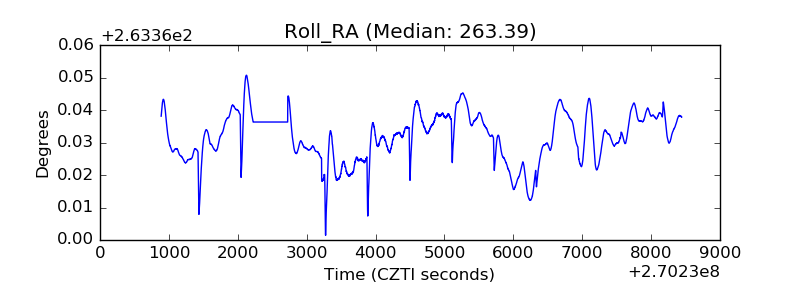 |
| Veto Counter | 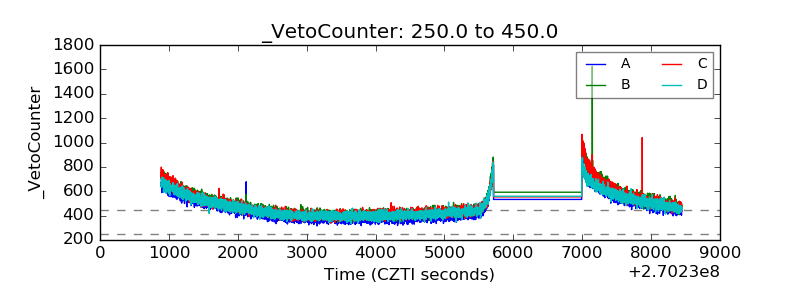 |