| Param | Original file | Final file |
|---|---|---|
| Filename | modeM0/AS1A04_207T01_9000002254_15270cztM0_level2.evt | modeM0/AS1A04_207T01_9000002254_15270cztM0_level2_quad_clean.evt |
| Size (bytes) | 508,389,120 | 98,792,640 |
| Size | 484.8 MB | 94.2 MB |
| Events in quadrant A | 3,374,772 | 653,045 |
| Events in quadrant B | 3,575,823 | 658,676 |
| Events in quadrant C | 4,104,357 | 632,892 |
| Events in quadrant D | 3,911,003 | 604,264 |
| Mode SS | |||
|---|---|---|---|
| Quadrant | BADHDUFLAG | Total packets | Discarded packets |
| A | 0 | 128 | 0 |
| B | 0 | 128 | 0 |
| C | 0 | 128 | 0 |
| D | 0 | 128 | 0 |
| Mode M0 | |||
|---|---|---|---|
| Quadrant | BADHDUFLAG | Total packets | Discarded packets |
| A | 0 | 14100 | 3 |
| B | 0 | 14605 | 2 |
| C | 0 | 16434 | 2 |
| D | 0 | 15797 | 2 |
| Mode M9 | |||
|---|---|---|---|
| Quadrant | BADHDUFLAG | Total packets | Discarded packets |
| A | 0 | 19 | 0 |
| B | 0 | 19 | 0 |
| C | 0 | 19 | 0 |
| D | 0 | 20 | 0 |
| Quadrant | Total seconds | Saturated seconds | Saturation percentage |
|---|---|---|---|
| A | 6354 | 81 | 1.274788% |
| B | 6354 | 116 | 1.825622% |
| C | 6354 | 75 | 1.180359% |
| D | 6354 | 236 | 3.714196% |
Noise dominated data is calculated using 1-second bins in cleaned event files. If a bin has >2000 counts, and if more than 50% of those come from <1% of pixels, then it is considered to be noise-dominated and hence unusable.
| Quadrant | # 1 sec bins | Bins with >0 counts | Bins with >2000 counts | High rate bins dominated by noise | Noise dominated (total time) | Noise dominated (detector-on time) | Marked lightcurve |
|---|---|---|---|---|---|---|---|
| A | 7690 | 6356 | 3 | 3 | 0.04% | 0.05% | 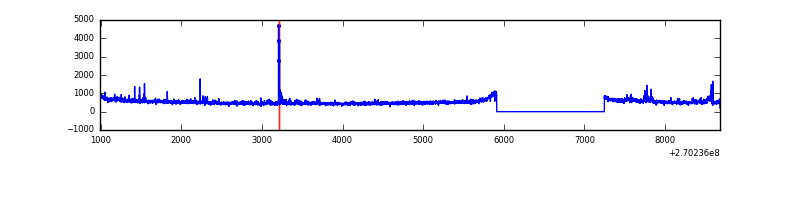 |
| B | 7690 | 6356 | 22 | 22 | 0.29% | 0.35% | 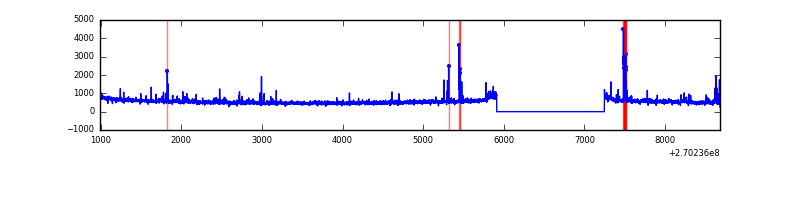 |
| C | 7690 | 6356 | 28 | 28 | 0.36% | 0.44% | 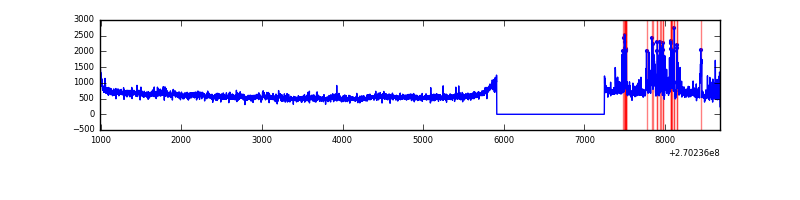 |
| D | 7690 | 6356 | 179 | 179 | 2.33% | 2.82% | 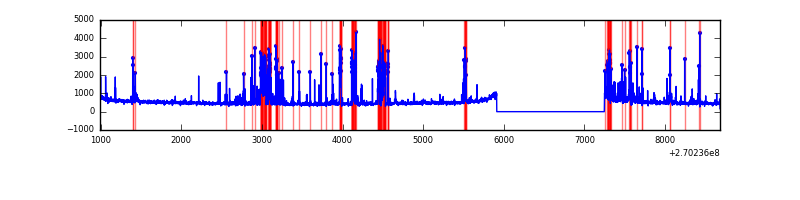 |
Top three noisy pixels from each quadrant. If the there are fewer than three noisy pixels in the level2.evt file, extra rows are filled as -1
| Pixel properties | Quadrant properties | ||||||
|---|---|---|---|---|---|---|---|
| Quadrant | DetID | PixID | Counts | Sigma | Mean | Median | Sigma |
| A | 12 | 189 | 124866 | 732.26 | 834 | 818 | 169.4 |
| A | 9 | 143 | 30501 | 175.22 | 834 | 818 | 169.4 |
| A | 0 | 226 | 7581 | 39.92 | 834 | 818 | 169.4 |
| B | 10 | 16 | 114223 | 728.01 | 829 | 812 | 155.8 |
| B | 0 | 229 | 64218 | 407.02 | 829 | 812 | 155.8 |
| B | 0 | 219 | 41254 | 259.61 | 829 | 812 | 155.8 |
| C | 3 | 233 | 1008418 | 5517.88 | 790 | 797 | 182.6 |
| C | 3 | 9 | 15121 | 78.44 | 790 | 797 | 182.6 |
| C | 13 | 61 | 5628 | 26.46 | 790 | 797 | 182.6 |
| D | 2 | 33 | 244484 | 1268.95 | 787 | 765 | 192.1 |
| D | 13 | 172 | 236684 | 1228.34 | 787 | 765 | 192.1 |
| D | 7 | 38 | 181988 | 943.56 | 787 | 765 | 192.1 |
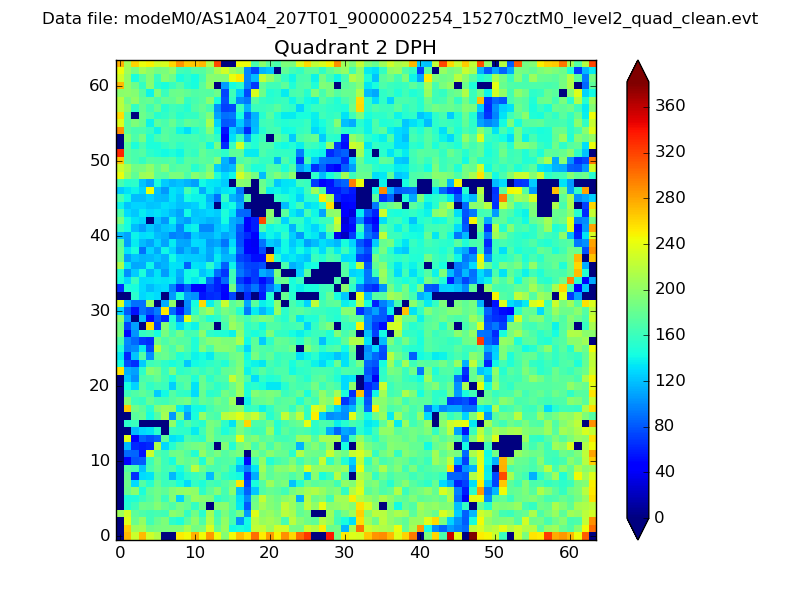
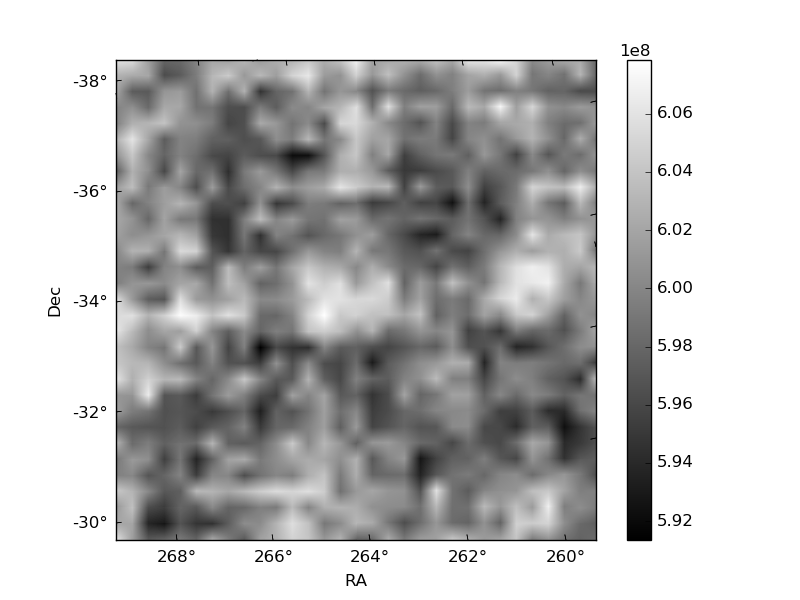
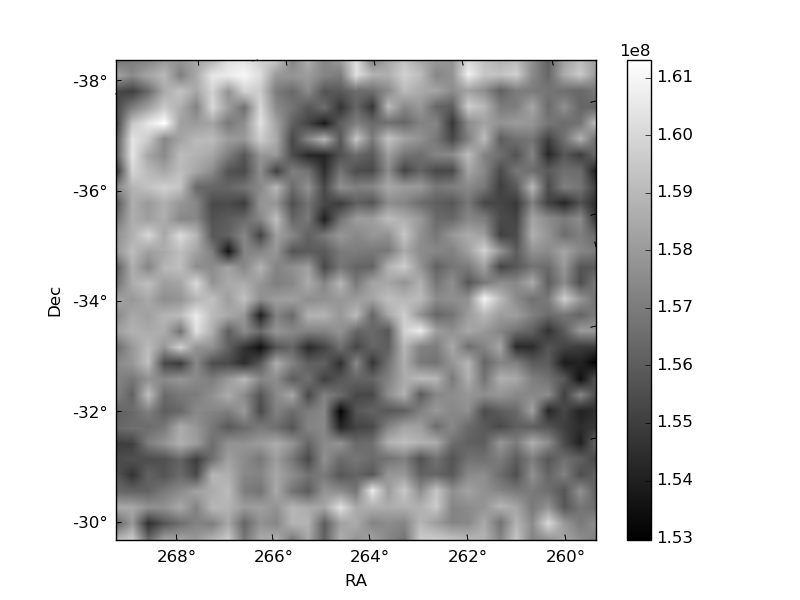
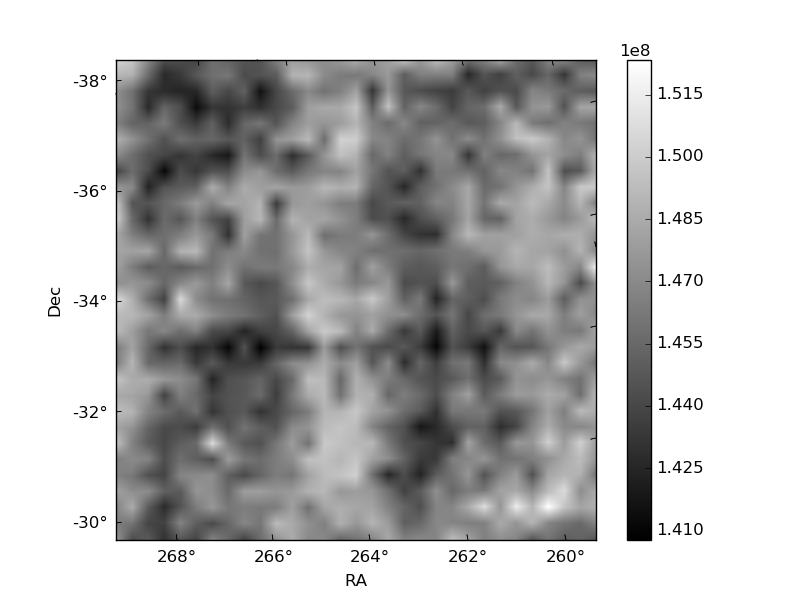
Histogram calculated using DETX and DETY for each event in the final _common_clean file
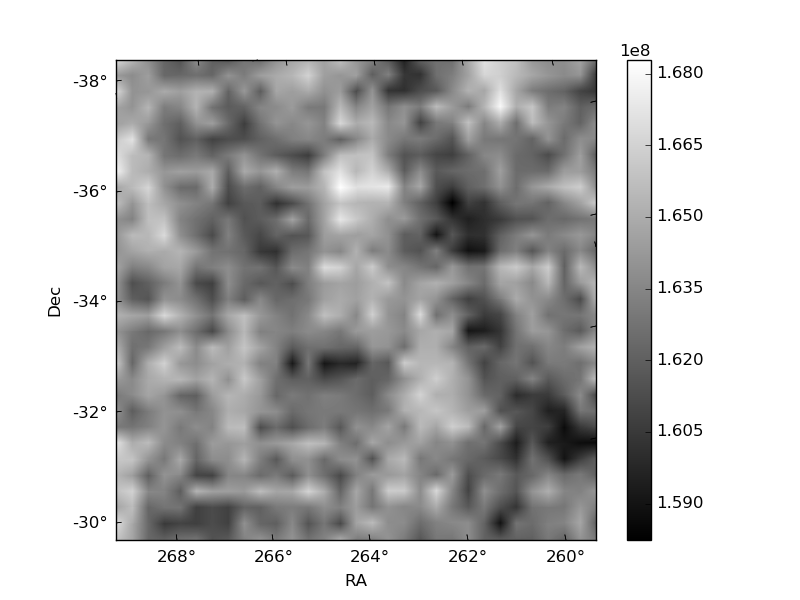
| Quadrant A | 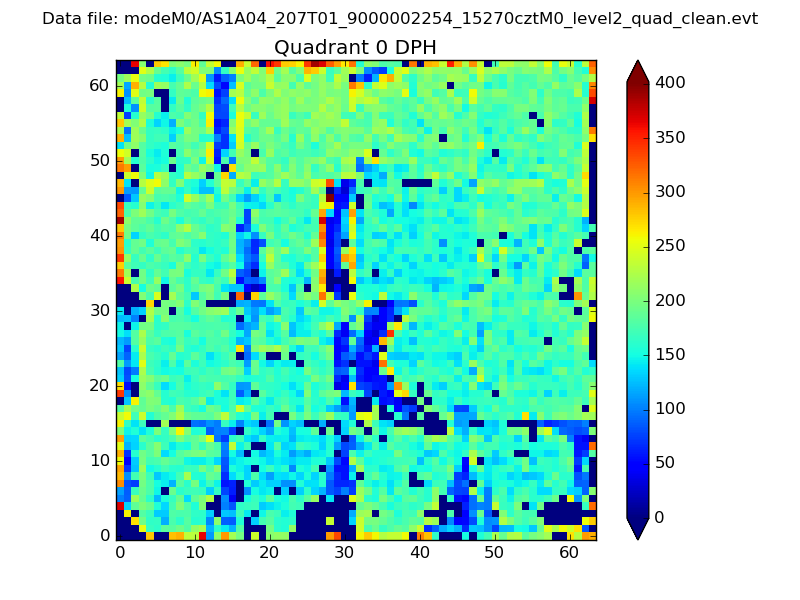 |
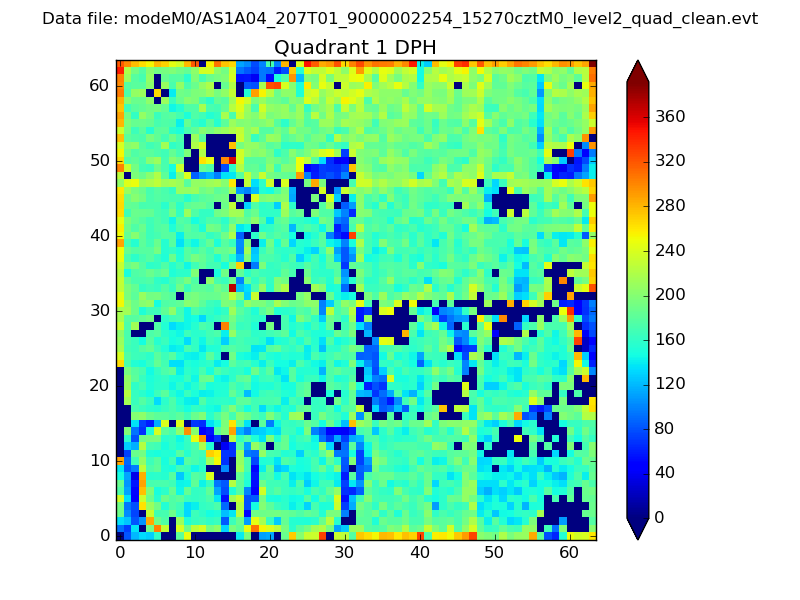 |
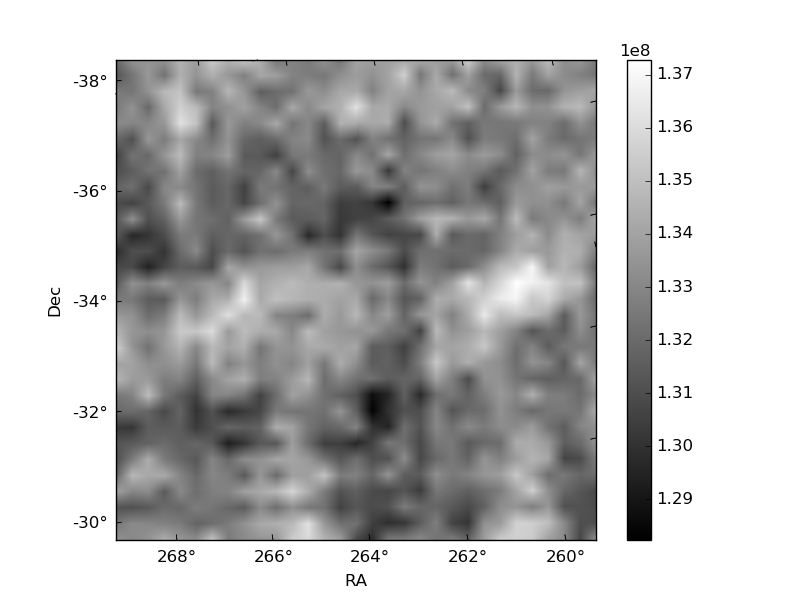
Quadrant B |
|---|---|---|---|
| Quadrant D | 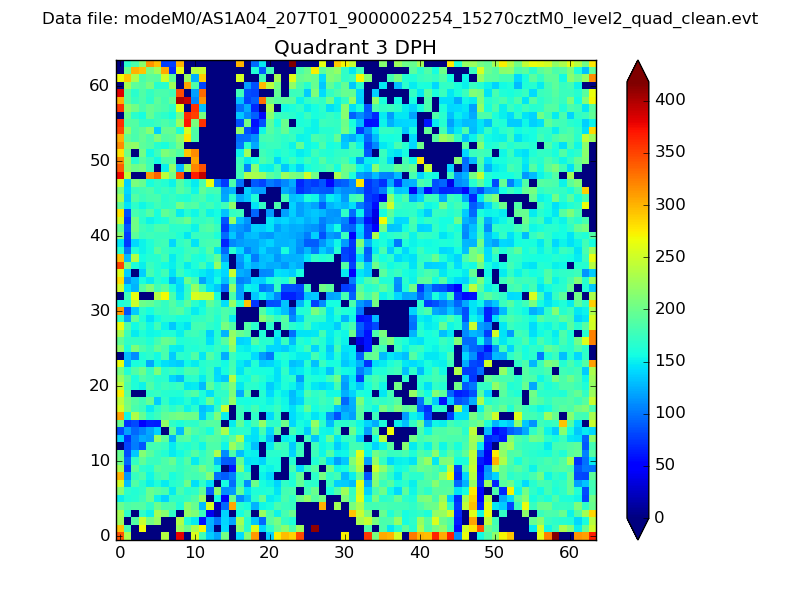 |
 |
Quadrant C |
| Plot type | Count rate plots | Images |
|---|---|---|
| Comparison with Poisson distribution Blue bars denote a histogram of data divided into 1 sec bins. Red curve is a Poisson curve with rate = median count rate of data. |
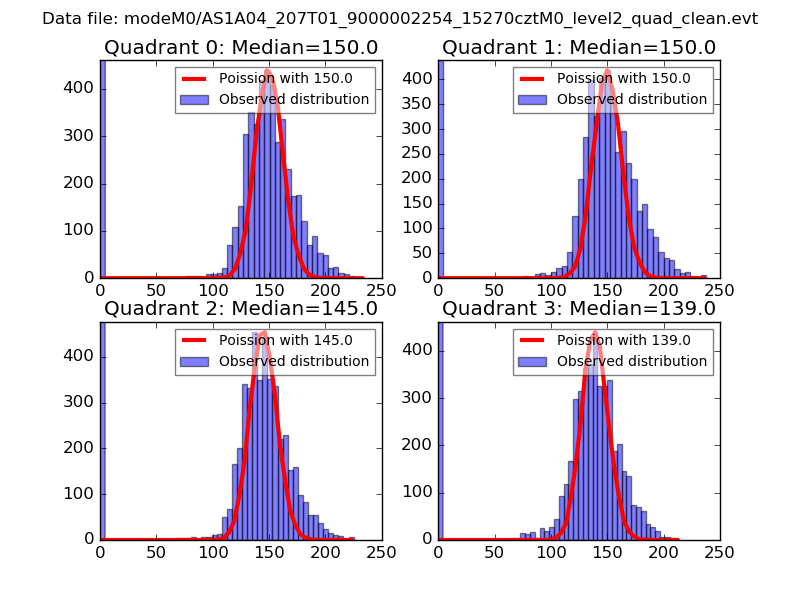 |
 |
| Quadrant-wise count rates Data is divided into 100 sec bins |
 |
|
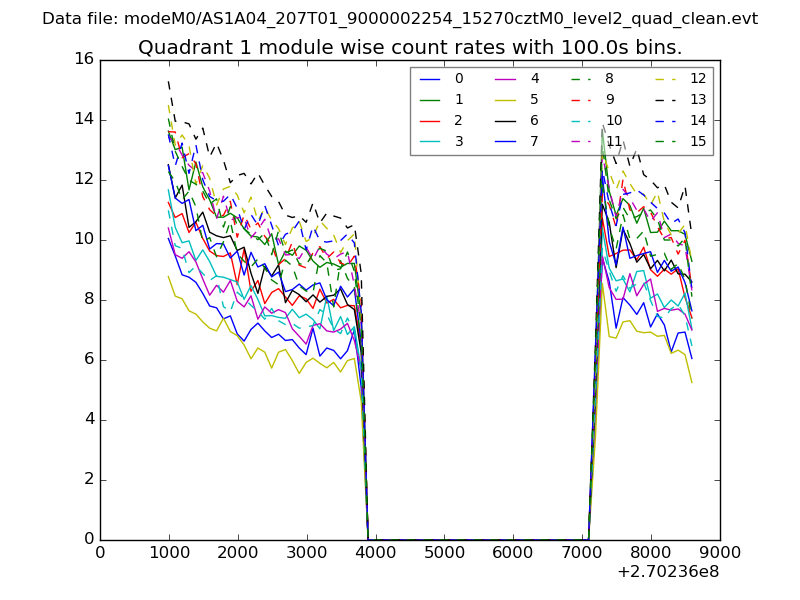
| Module-wise count rates for Quadrant A Data is divided into 100 sec bins |
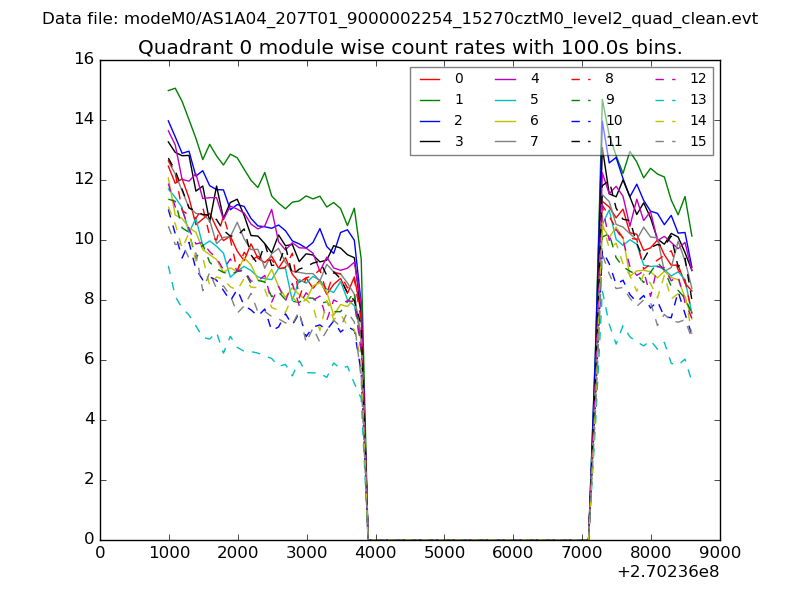 |
 |
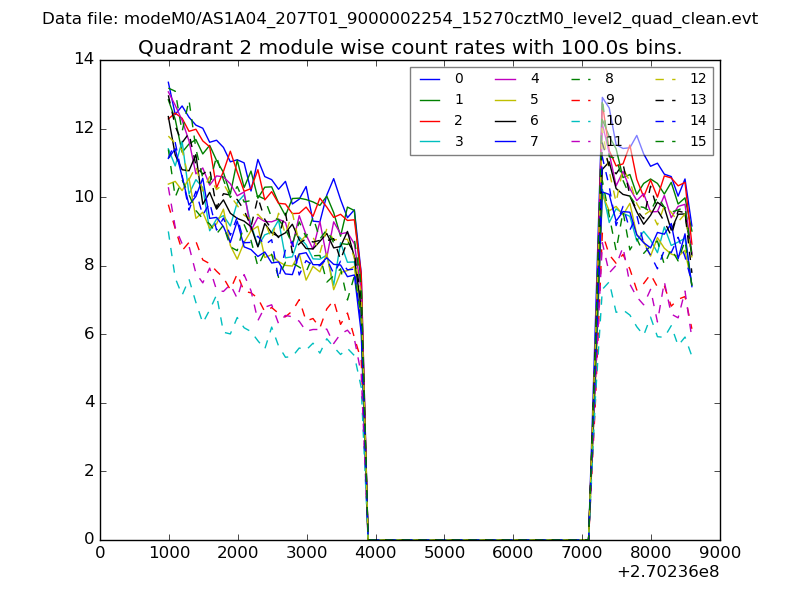
| Module-wise count rates for Quadrant B Data is divided into 100 sec bins |
 |
 |
| Module-wise count rates for Quadrant C Data is divided into 100 sec bins |
 |
 |
| Module-wise count rates for Quadrant D Data is divided into 100 sec bins |
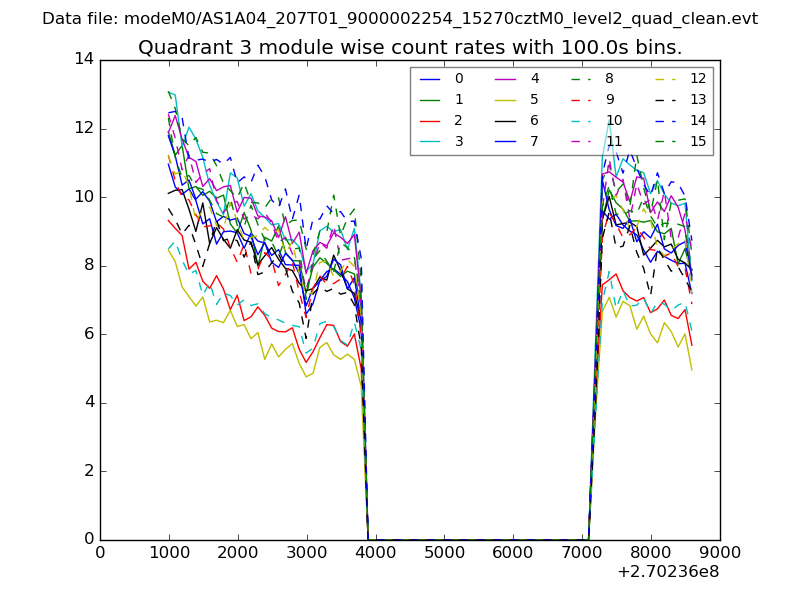 |
 |
| Parameter | Plot |
|---|---|
| CZT HV Monitor | 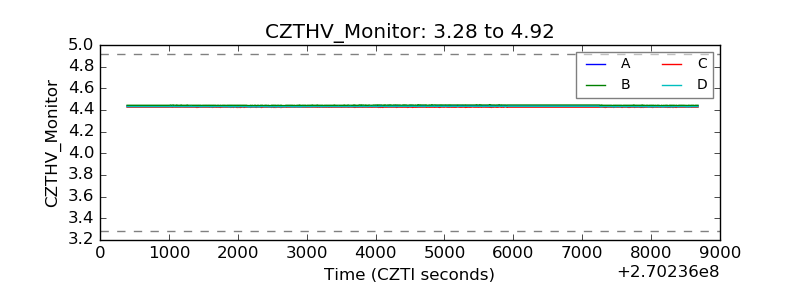 |
| D_VDD | 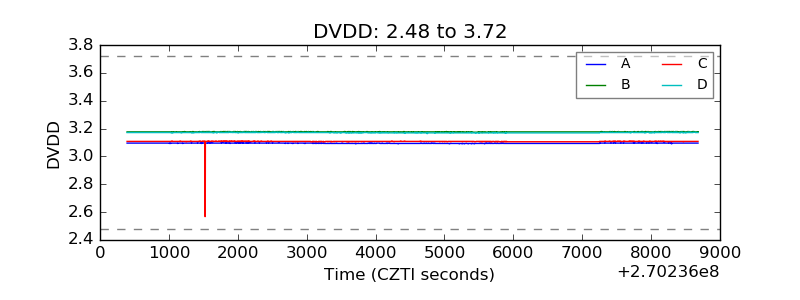 |
| Temperature 1 |  |
| Veto HV Monitor | 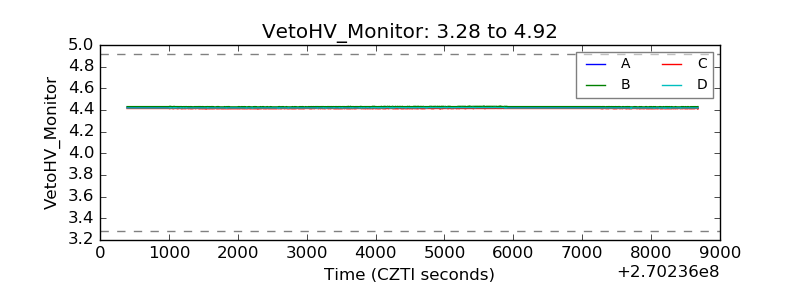 |
| Veto LLD | 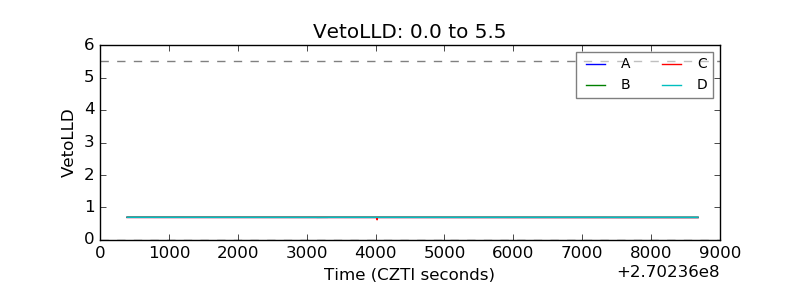 |
| Alpha Counter | 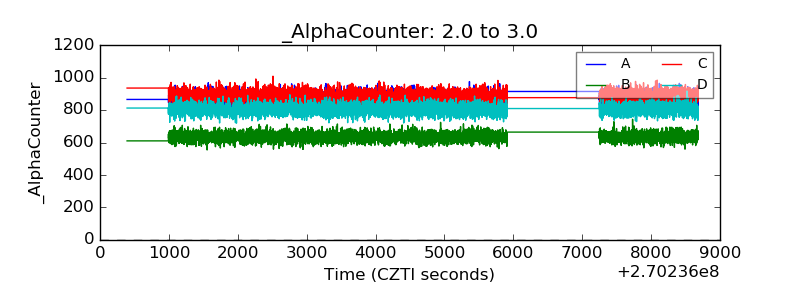 |
| _CPM_Rate | 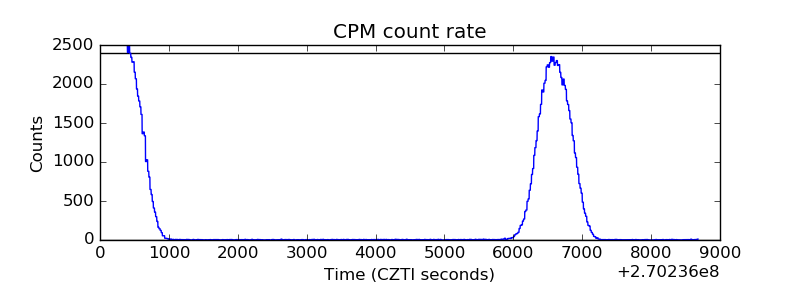 |
| CZT Counter | 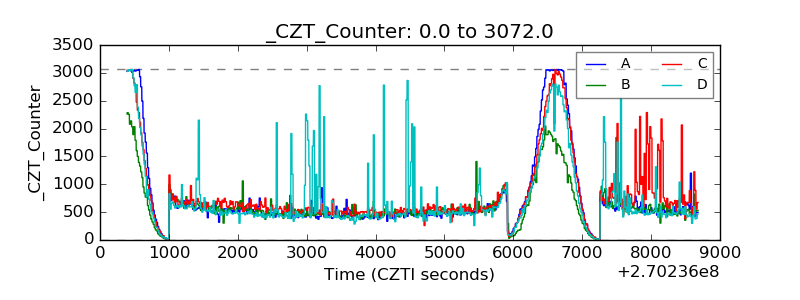 |
| +2.5 Volts monitor |  |
| +5 Volts monitor |  |
| _ROLL_ROT | 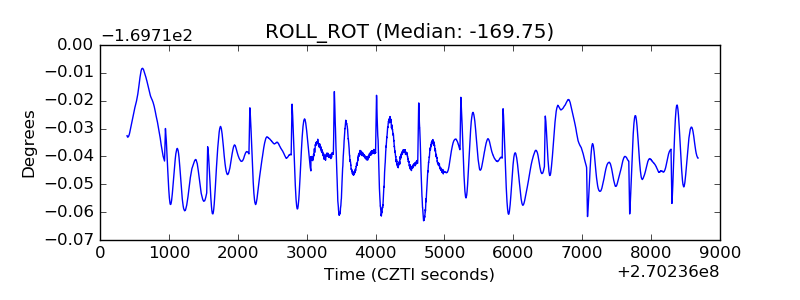 |
| _Roll_DEC | 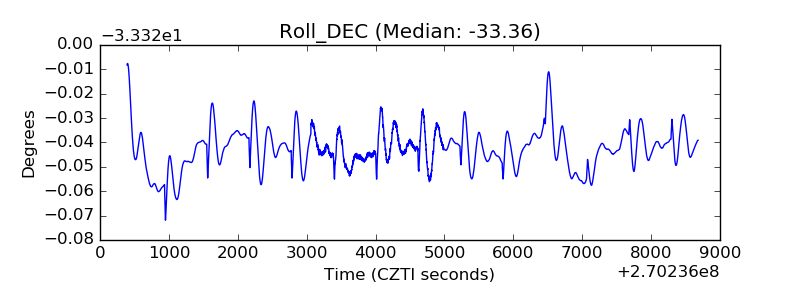 |
| _Roll_RA | 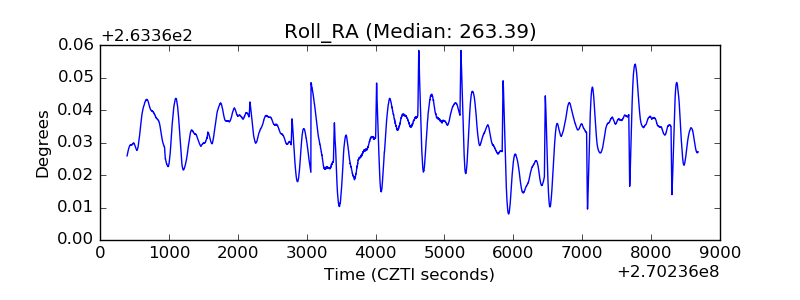 |
| Veto Counter | 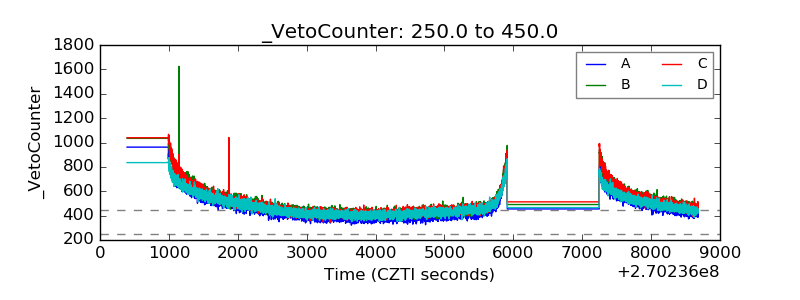 |