| Param | Original file | Final file |
|---|---|---|
| Filename | modeM0/AS1A04_207T01_9000002254_15271cztM0_level2.evt | modeM0/AS1A04_207T01_9000002254_15271cztM0_level2_quad_clean.evt |
| Size (bytes) | 488,085,120 | 91,103,040 |
| Size | 465.5 MB | 86.9 MB |
| Events in quadrant A | 3,234,041 | 593,009 |
| Events in quadrant B | 3,419,940 | 602,114 |
| Events in quadrant C | 4,246,550 | 582,251 |
| Events in quadrant D | 3,462,075 | 550,160 |
| Mode SS | |||
|---|---|---|---|
| Quadrant | BADHDUFLAG | Total packets | Discarded packets |
| A | 0 | 124 | 0 |
| B | 0 | 124 | 0 |
| C | 0 | 124 | 0 |
| D | 0 | 124 | 0 |
| Mode M0 | |||
|---|---|---|---|
| Quadrant | BADHDUFLAG | Total packets | Discarded packets |
| A | 0 | 13557 | 3 |
| B | 0 | 13980 | 2 |
| C | 0 | 16946 | 2 |
| D | 0 | 14455 | 2 |
| Mode M9 | |||
|---|---|---|---|
| Quadrant | BADHDUFLAG | Total packets | Discarded packets |
| A | 0 | 18 | 0 |
| B | 0 | 18 | 0 |
| C | 0 | 18 | 0 |
| D | 0 | 19 | 0 |
| Quadrant | Total seconds | Saturated seconds | Saturation percentage |
|---|---|---|---|
| A | 6186 | 59 | 0.953767% |
| B | 6186 | 92 | 1.487229% |
| C | 6186 | 61 | 0.986098% |
| D | 6186 | 153 | 2.473327% |
Noise dominated data is calculated using 1-second bins in cleaned event files. If a bin has >2000 counts, and if more than 50% of those come from <1% of pixels, then it is considered to be noise-dominated and hence unusable.
| Quadrant | # 1 sec bins | Bins with >0 counts | Bins with >2000 counts | High rate bins dominated by noise | Noise dominated (total time) | Noise dominated (detector-on time) | Marked lightcurve |
|---|---|---|---|---|---|---|---|
| A | 7522 | 6187 | 0 | 0 | 0.00% | 0.00% | 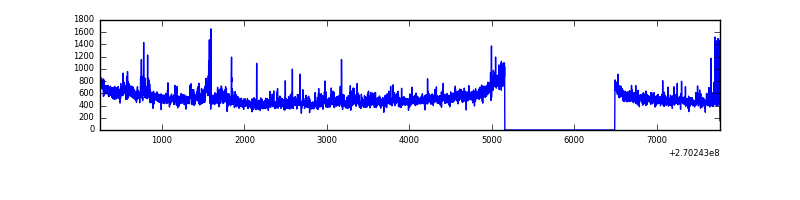 |
| B | 7522 | 6187 | 21 | 21 | 0.28% | 0.34% | 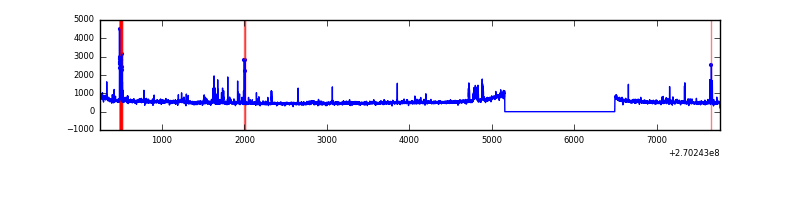 |
| C | 7522 | 6188 | 29 | 29 | 0.39% | 0.47% | 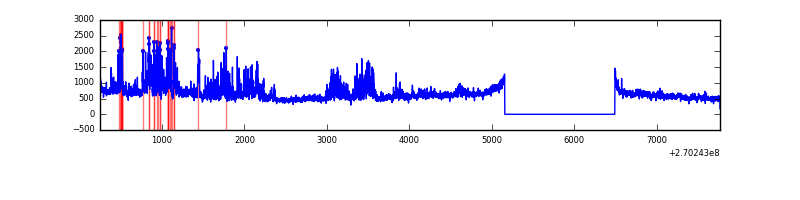 |
| D | 7522 | 6188 | 106 | 106 | 1.41% | 1.71% | 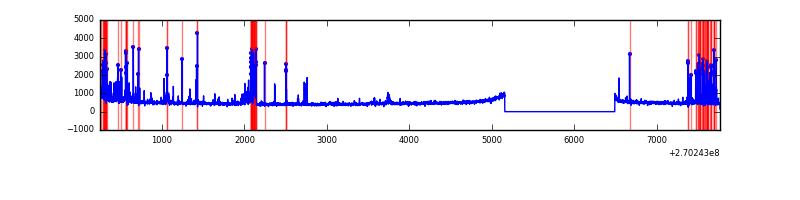 |
Top three noisy pixels from each quadrant. If the there are fewer than three noisy pixels in the level2.evt file, extra rows are filled as -1
| Pixel properties | Quadrant properties | ||||||
|---|---|---|---|---|---|---|---|
| Quadrant | DetID | PixID | Counts | Sigma | Mean | Median | Sigma |
| A | 12 | 189 | 173892 | 1082.05 | 788 | 773 | 160.0 |
| A | 9 | 143 | 22294 | 134.51 | 788 | 773 | 160.0 |
| A | 0 | 226 | 7281 | 40.68 | 788 | 773 | 160.0 |
| B | 10 | 16 | 91585 | 605.24 | 790 | 773 | 150.0 |
| B | 0 | 189 | 76032 | 501.58 | 790 | 773 | 150.0 |
| B | 0 | 229 | 39525 | 258.27 | 790 | 773 | 150.0 |
| C | 3 | 233 | 1306309 | 7540.63 | 753 | 758 | 173.1 |
| C | 13 | 61 | 5565 | 27.76 | 753 | 758 | 173.1 |
| C | 7 | 221 | 2838 | 12.01 | 753 | 758 | 173.1 |
| D | 7 | 38 | 211549 | 1154.81 | 745 | 723 | 182.6 |
| D | 13 | 172 | 178891 | 975.93 | 745 | 723 | 182.6 |
| D | 10 | 70 | 167871 | 915.56 | 745 | 723 | 182.6 |
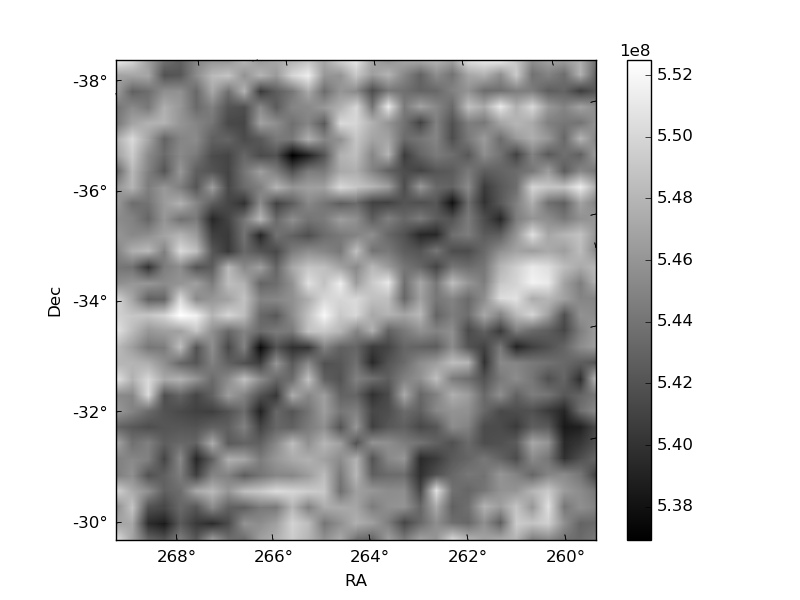
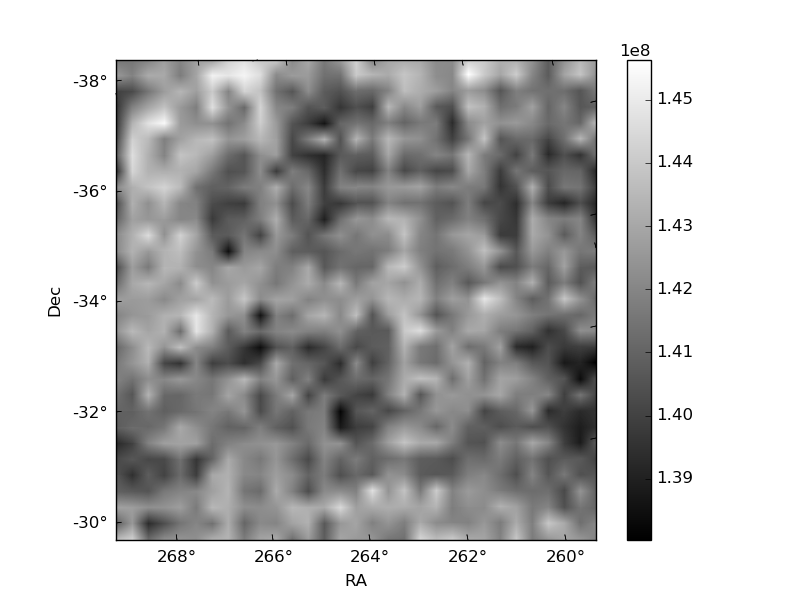
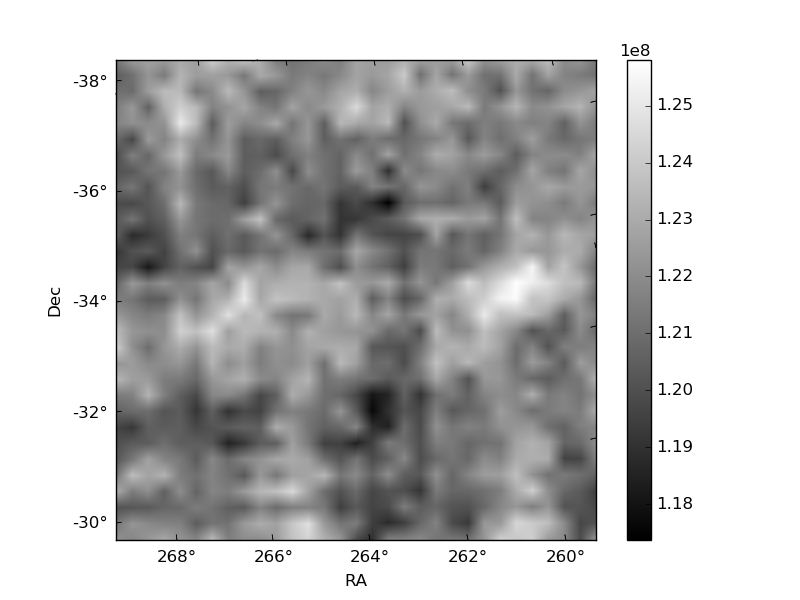
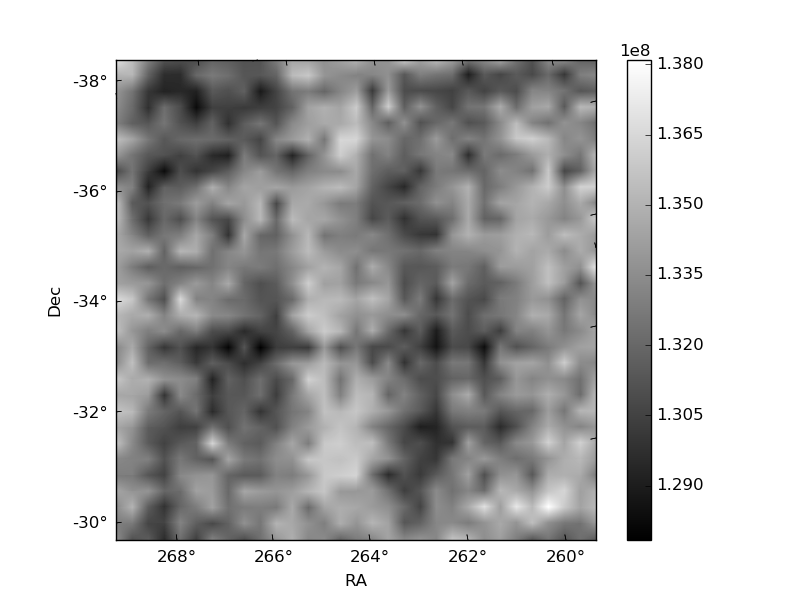
Histogram calculated using DETX and DETY for each event in the final _common_clean file
| Quadrant A | 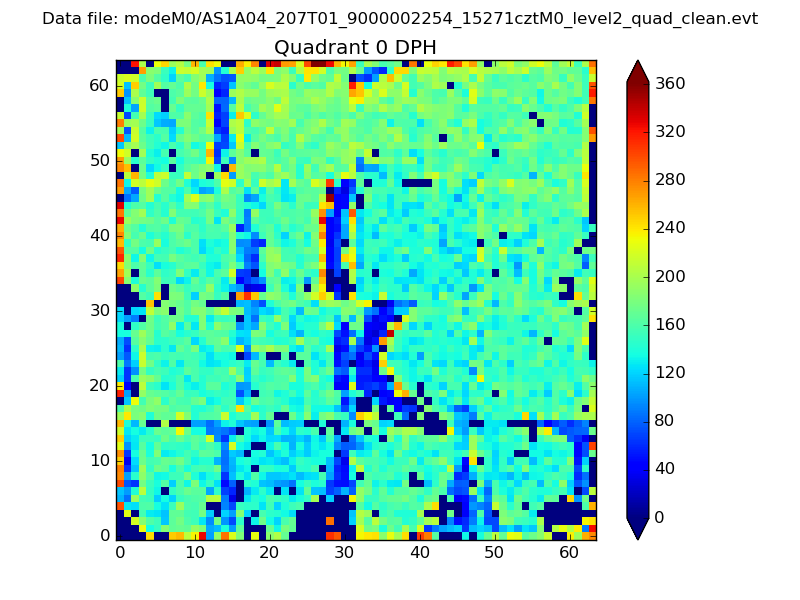 |
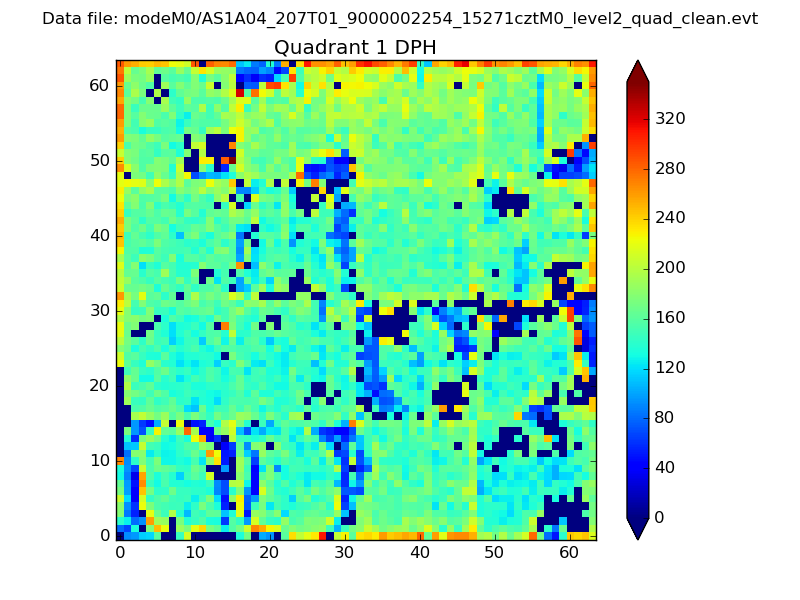 |
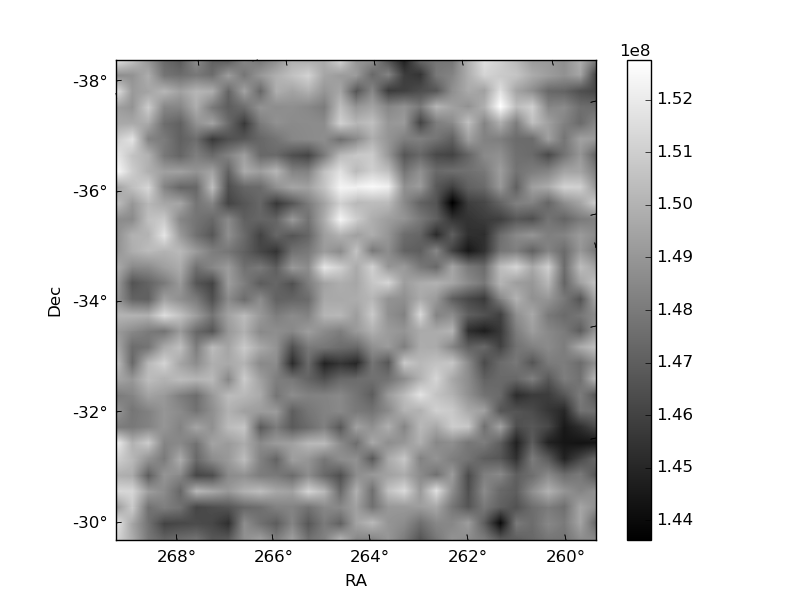
Quadrant B |
|---|---|---|---|
| Quadrant D | 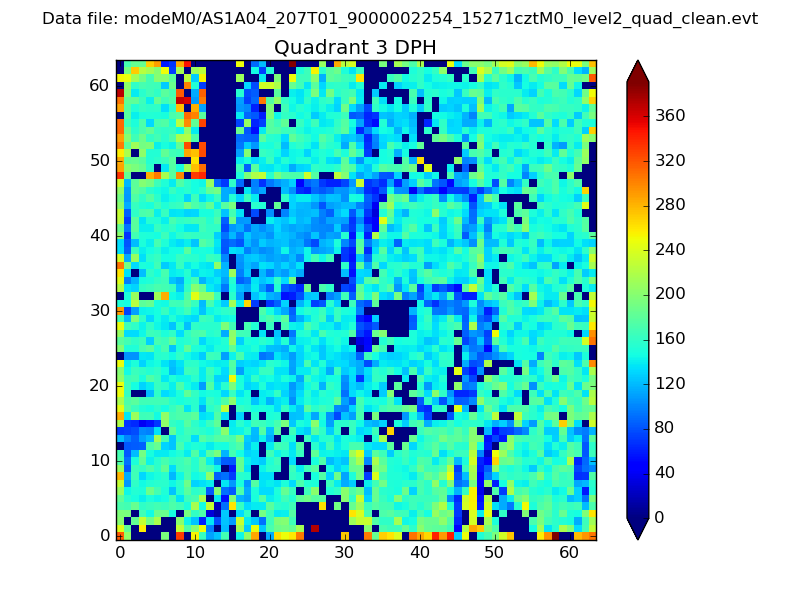 |
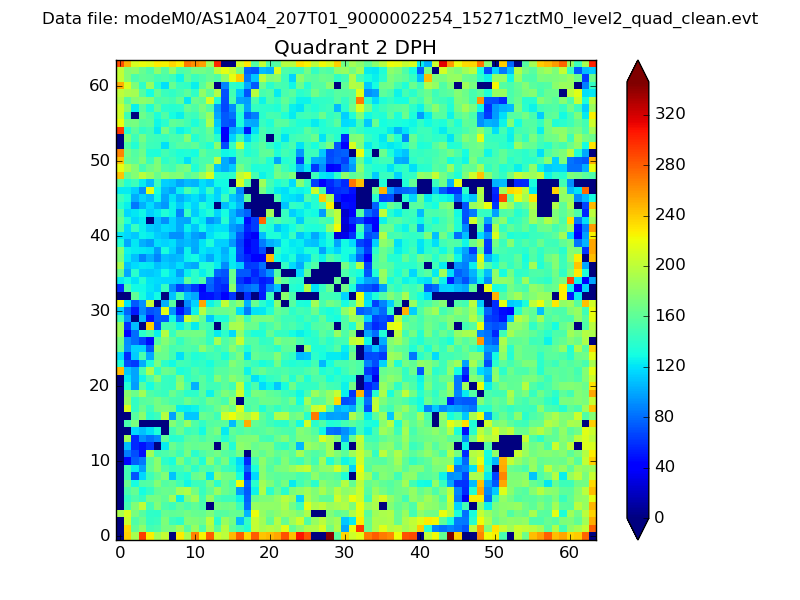 |
Quadrant C |
| Plot type | Count rate plots | Images |
|---|---|---|
| Comparison with Poisson distribution Blue bars denote a histogram of data divided into 1 sec bins. Red curve is a Poisson curve with rate = median count rate of data. |
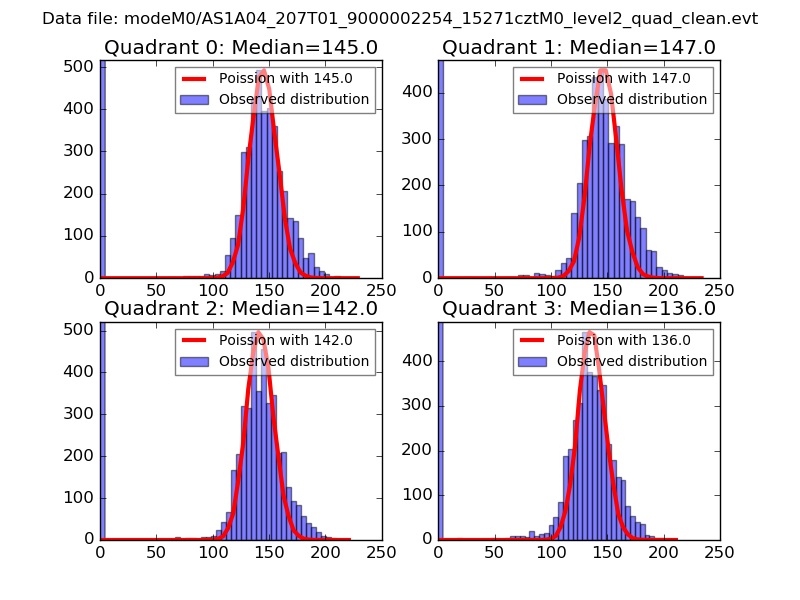 |
 |
| Quadrant-wise count rates Data is divided into 100 sec bins |
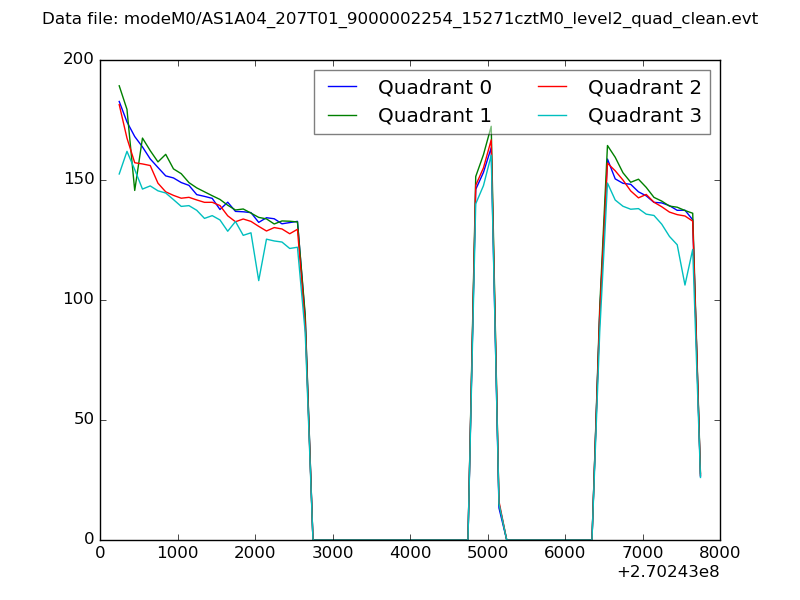 |
|
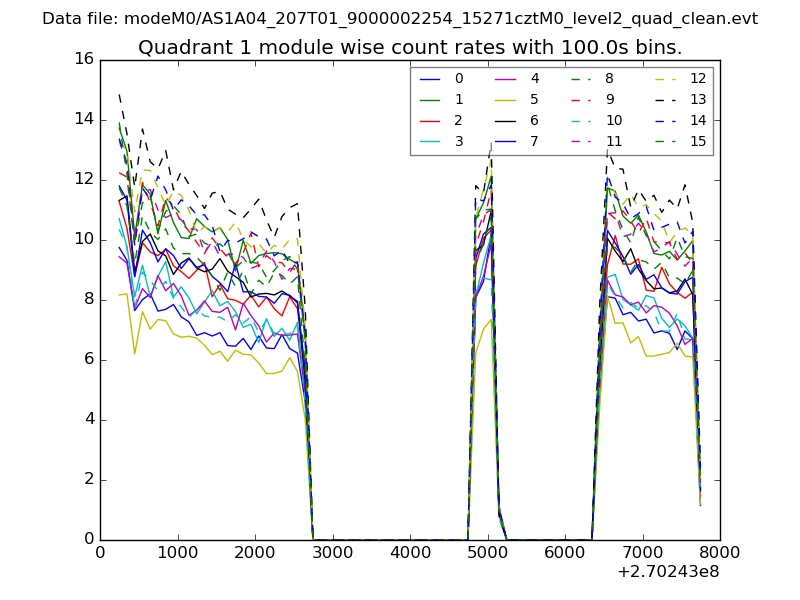
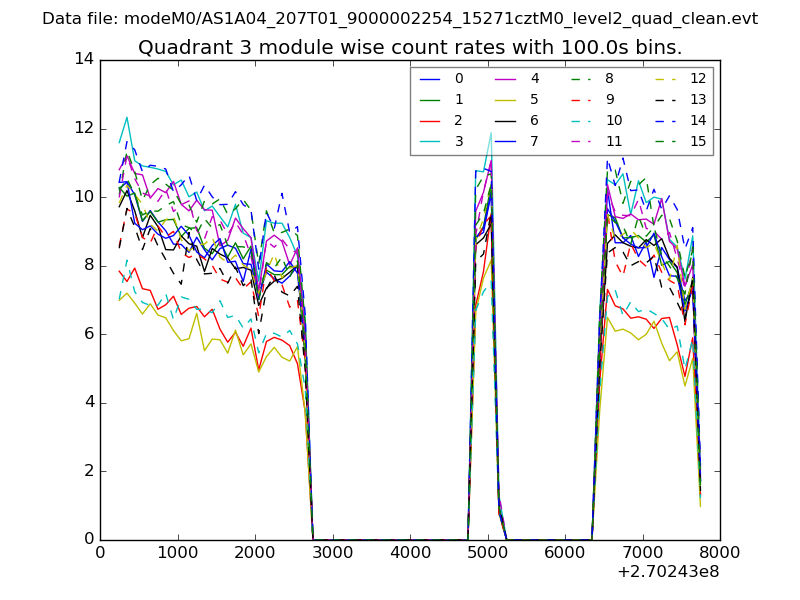
| Module-wise count rates for Quadrant A Data is divided into 100 sec bins |
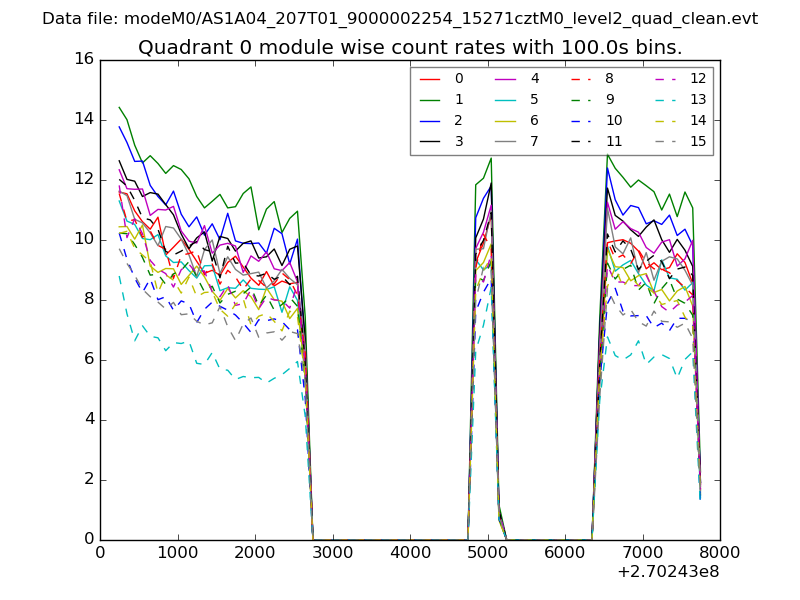 |
 |
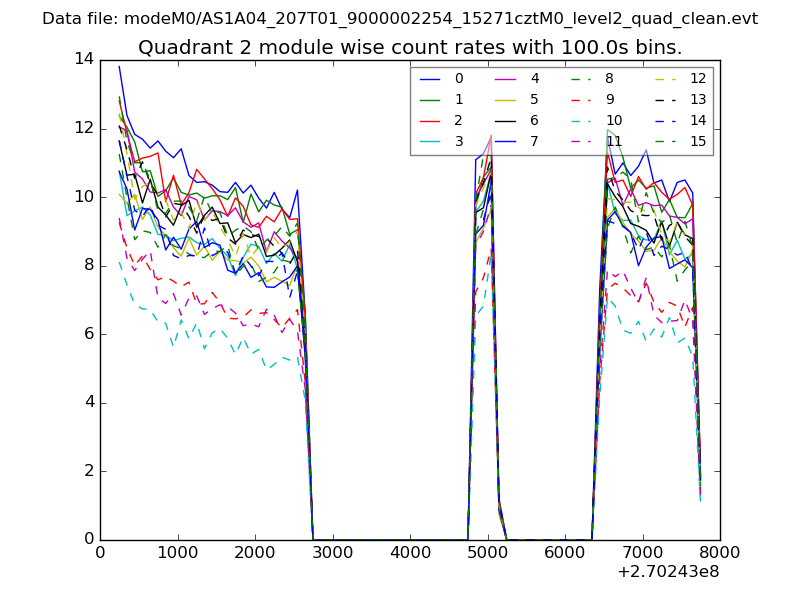
| Module-wise count rates for Quadrant B Data is divided into 100 sec bins |
 |
 |
| Module-wise count rates for Quadrant C Data is divided into 100 sec bins |
 |
 |
| Module-wise count rates for Quadrant D Data is divided into 100 sec bins |
 |
 |
| Parameter | Plot |
|---|---|
| CZT HV Monitor | 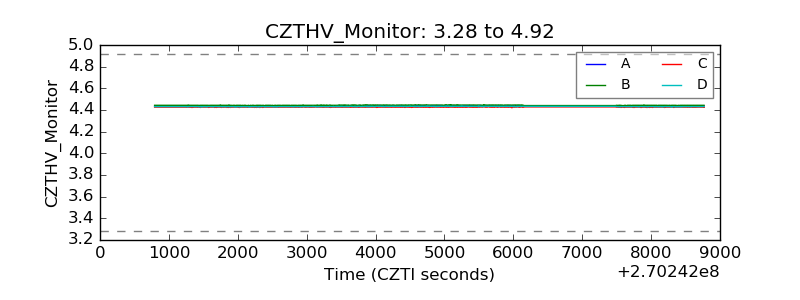 |
| D_VDD | 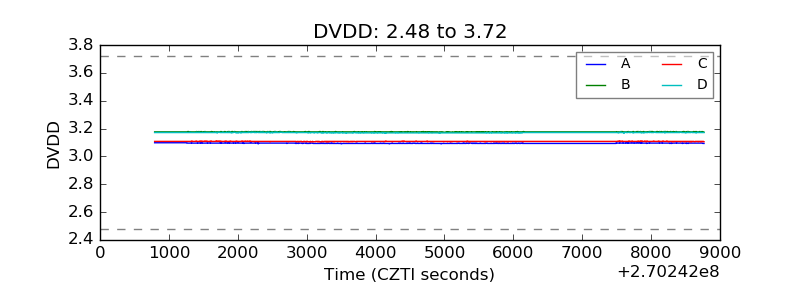 |
| Temperature 1 |  |
| Veto HV Monitor | 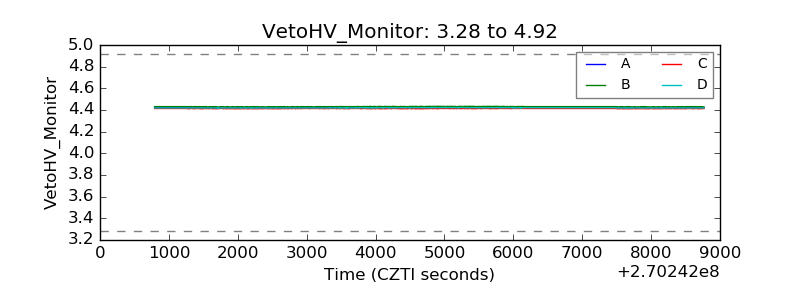 |
| Veto LLD | 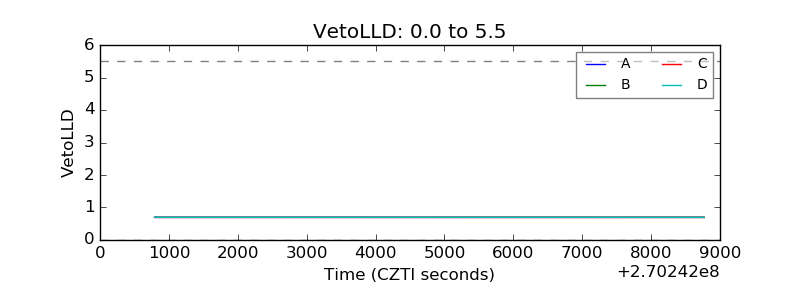 |
| Alpha Counter | 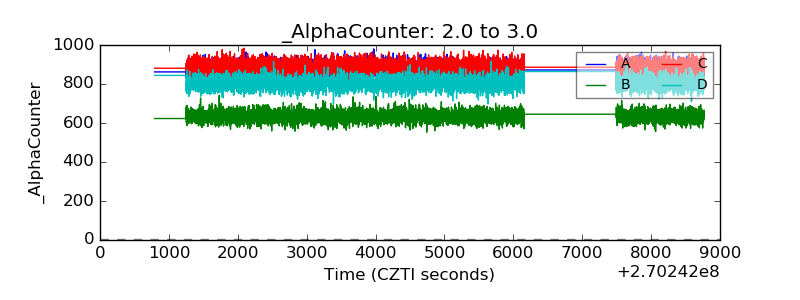 |
| _CPM_Rate | 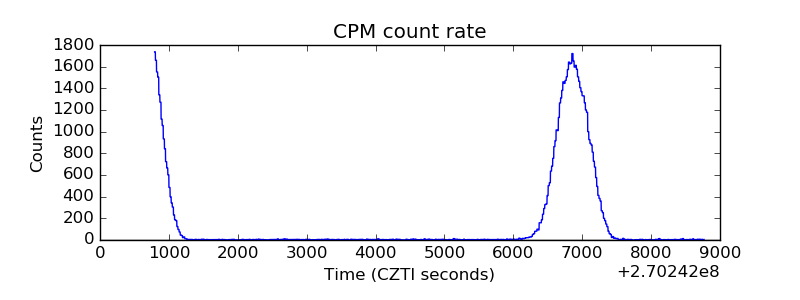 |
| CZT Counter | 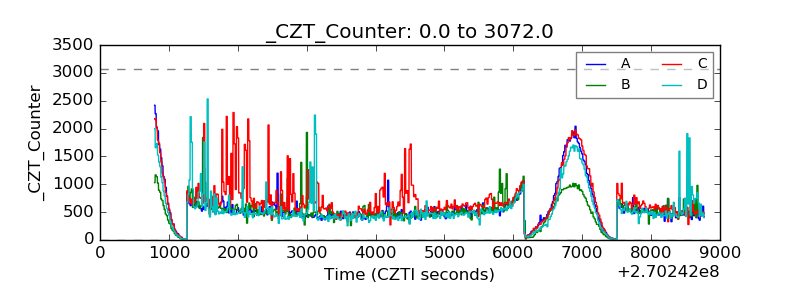 |
| +2.5 Volts monitor |  |
| +5 Volts monitor |  |
| _ROLL_ROT | 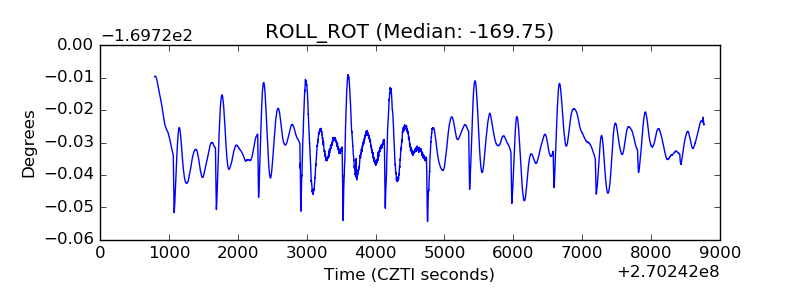 |
| _Roll_DEC | 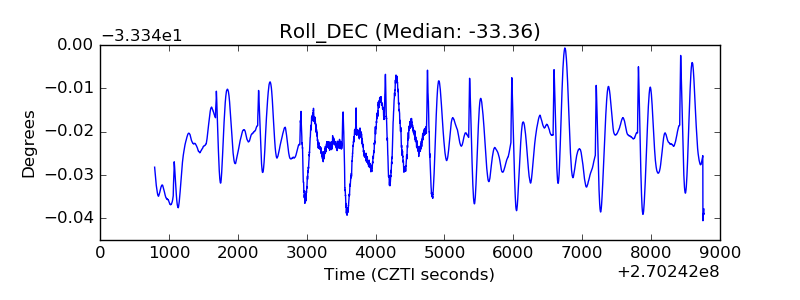 |
| _Roll_RA | 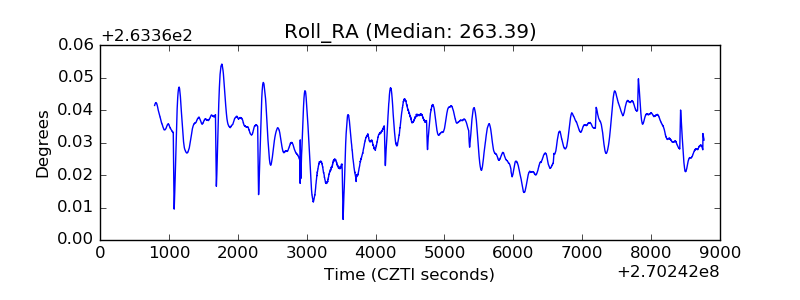 |
| Veto Counter | 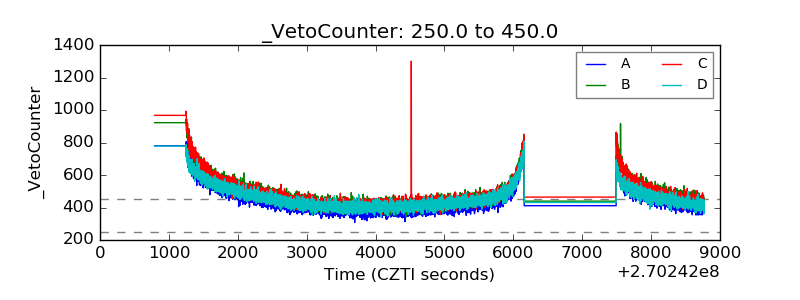 |