| Param | Original file | Final file |
|---|---|---|
| Filename | modeM0/AS1A04_207T01_9000002254_15276cztM0_level2.evt | modeM0/AS1A04_207T01_9000002254_15276cztM0_level2_quad_clean.evt |
| Size (bytes) | 524,232,000 | 82,249,920 |
| Size | 499.9 MB | 78.4 MB |
| Events in quadrant A | 3,675,333 | 491,661 |
| Events in quadrant B | 3,860,870 | 498,068 |
| Events in quadrant C | 3,957,161 | 497,694 |
| Events in quadrant D | 3,864,571 | 471,991 |
| Mode SS | |||
|---|---|---|---|
| Quadrant | BADHDUFLAG | Total packets | Discarded packets |
| A | 0 | 156 | 0 |
| B | 0 | 156 | 0 |
| C | 0 | 156 | 0 |
| D | 0 | 156 | 0 |
| Mode M0 | |||
|---|---|---|---|
| Quadrant | BADHDUFLAG | Total packets | Discarded packets |
| A | 0 | 16113 | 3 |
| B | 0 | 16252 | 2 |
| C | 0 | 16048 | 2 |
| D | 0 | 17048 | 2 |
| Mode M9 | |||
|---|---|---|---|
| Quadrant | BADHDUFLAG | Total packets | Discarded packets |
| A | 0 | 7 | 0 |
| B | 0 | 7 | 0 |
| C | 0 | 7 | 0 |
| D | 0 | 7 | 0 |
| Quadrant | Total seconds | Saturated seconds | Saturation percentage |
|---|---|---|---|
| A | 7636 | 113 | 1.479832% |
| B | 7636 | 150 | 1.964379% |
| C | 7636 | 91 | 1.191723% |
| D | 7636 | 174 | 2.278680% |
Noise dominated data is calculated using 1-second bins in cleaned event files. If a bin has >2000 counts, and if more than 50% of those come from <1% of pixels, then it is considered to be noise-dominated and hence unusable.
| Quadrant | # 1 sec bins | Bins with >0 counts | Bins with >2000 counts | High rate bins dominated by noise | Noise dominated (total time) | Noise dominated (detector-on time) | Marked lightcurve |
|---|---|---|---|---|---|---|---|
| A | 8307 | 7639 | 2 | 2 | 0.02% | 0.03% | 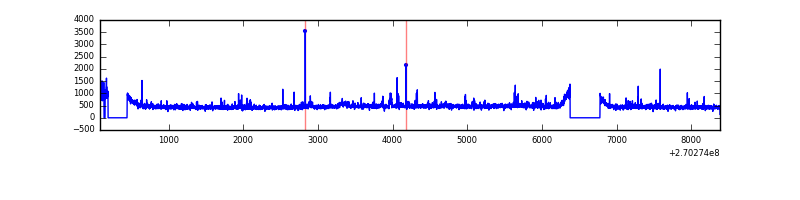 |
| B | 8307 | 7640 | 10 | 10 | 0.12% | 0.13% | 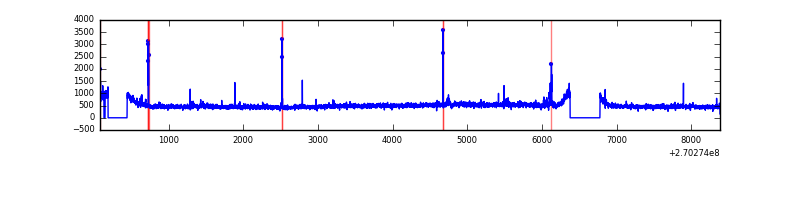 |
| C | 8307 | 7640 | 0 | 0 | 0.00% | 0.00% | 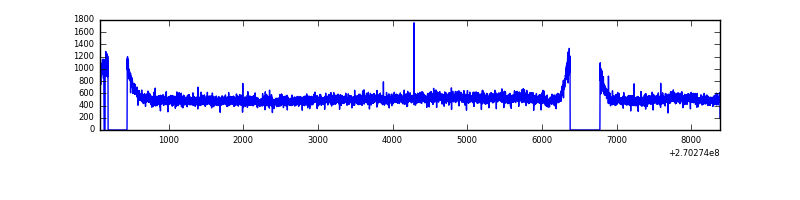 |
| D | 8307 | 7640 | 69 | 69 | 0.83% | 0.90% | 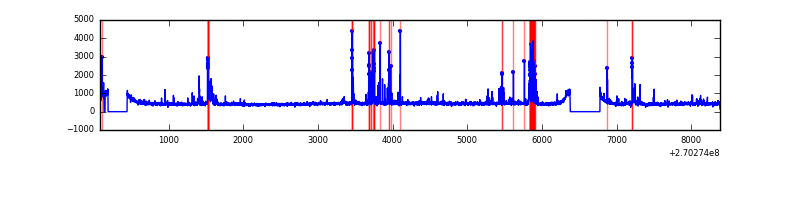 |
Top three noisy pixels from each quadrant. If the there are fewer than three noisy pixels in the level2.evt file, extra rows are filled as -1
| Pixel properties | Quadrant properties | ||||||
|---|---|---|---|---|---|---|---|
| Quadrant | DetID | PixID | Counts | Sigma | Mean | Median | Sigma |
| A | 12 | 189 | 89907 | 479.33 | 911 | 889 | 185.7 |
| A | 9 | 143 | 69406 | 368.94 | 911 | 889 | 185.7 |
| A | 13 | 248 | 11861 | 59.08 | 911 | 889 | 185.7 |
| B | 0 | 219 | 133778 | 749.79 | 915 | 892 | 177.2 |
| B | 0 | 189 | 41788 | 230.75 | 915 | 892 | 177.2 |
| B | 0 | 205 | 30179 | 165.25 | 915 | 892 | 177.2 |
| C | 3 | 233 | 486134 | 2318.08 | 890 | 893 | 209.3 |
| C | 13 | 61 | 6354 | 26.09 | 890 | 893 | 209.3 |
| C | 8 | 222 | 3405 | 12.0 | 890 | 893 | 209.3 |
| D | 2 | 33 | 292252 | 1344.63 | 881 | 852 | 216.7 |
| D | 7 | 38 | 187005 | 858.98 | 881 | 852 | 216.7 |
| D | 2 | 234 | 32742 | 147.15 | 881 | 852 | 216.7 |
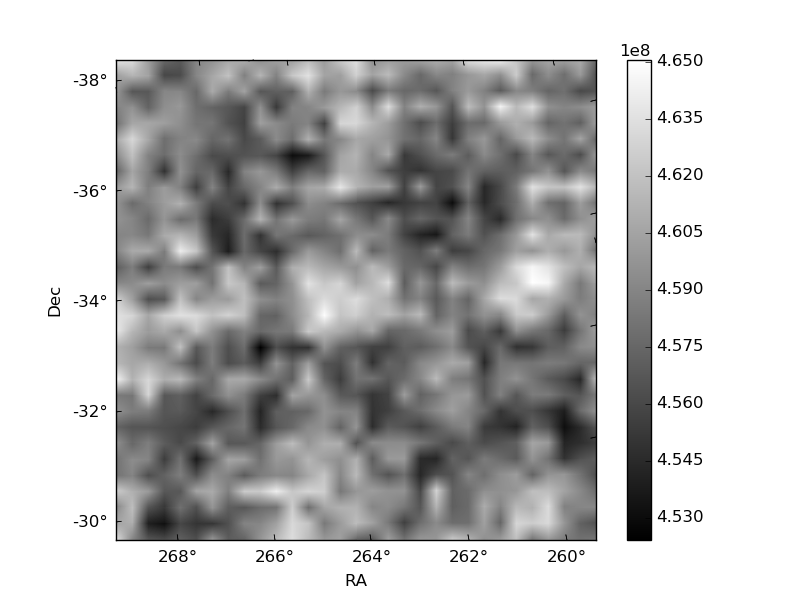
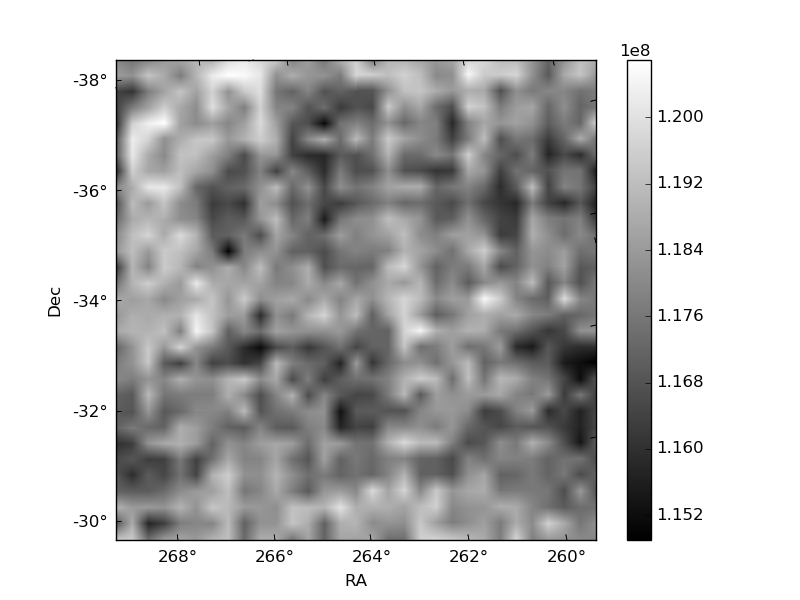
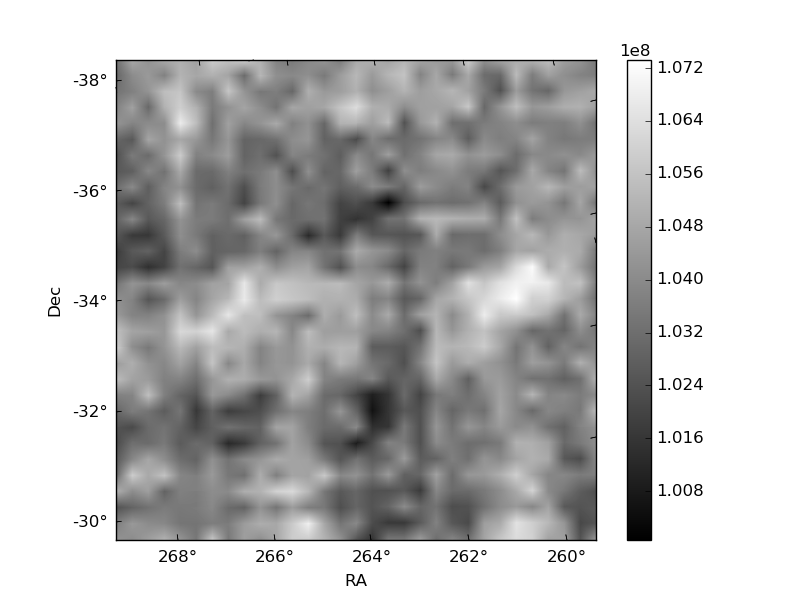
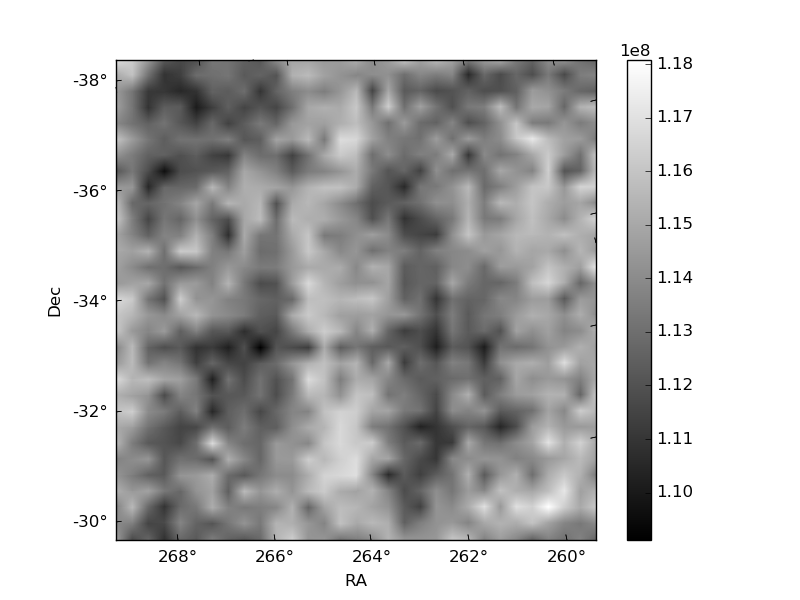
Histogram calculated using DETX and DETY for each event in the final _common_clean file
| Quadrant A | 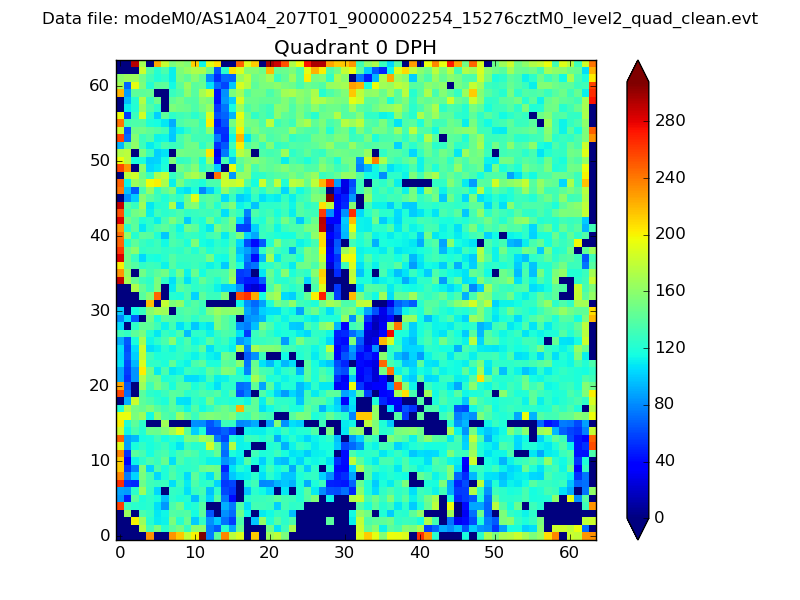 |
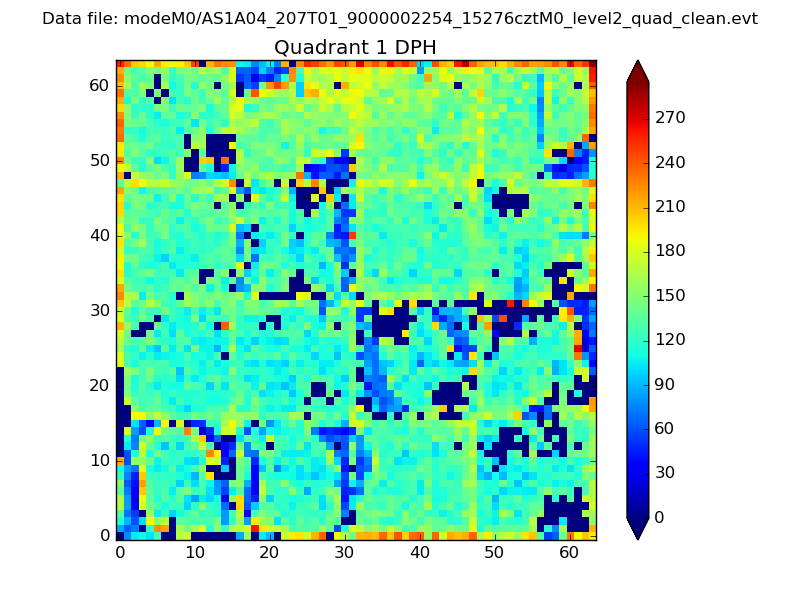 |
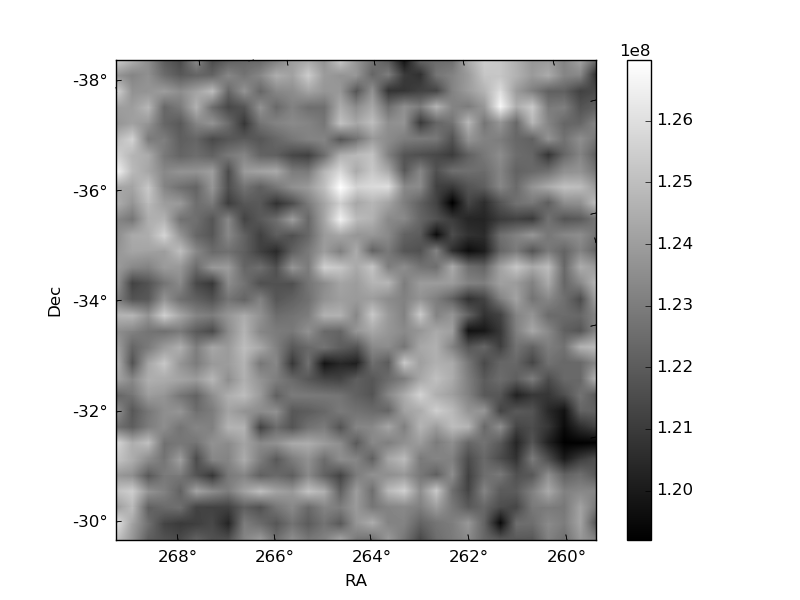
Quadrant B |
|---|---|---|---|
| Quadrant D | 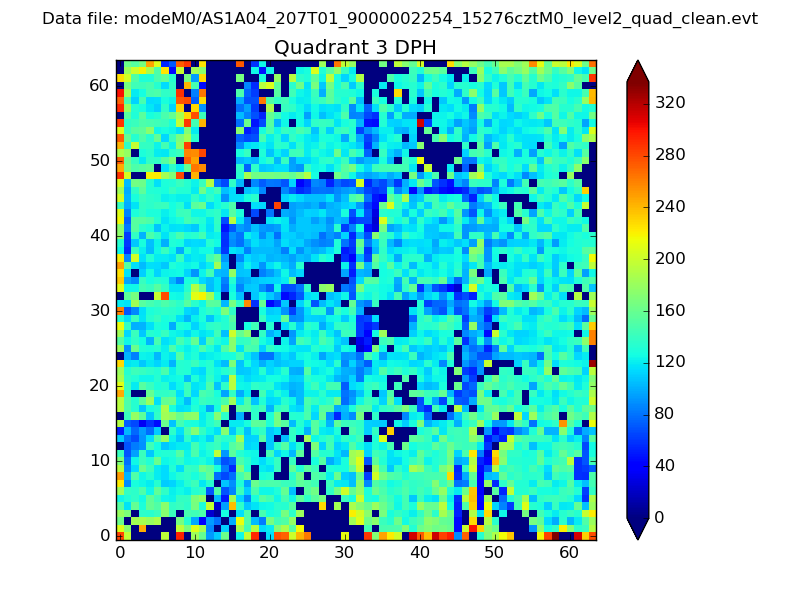 |
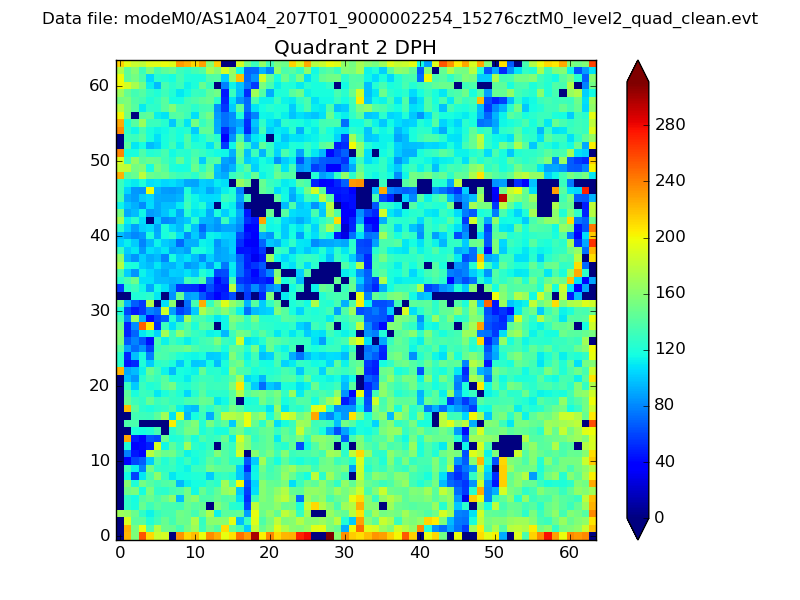 |
Quadrant C |
| Plot type | Count rate plots | Images |
|---|---|---|
| Comparison with Poisson distribution Blue bars denote a histogram of data divided into 1 sec bins. Red curve is a Poisson curve with rate = median count rate of data. |
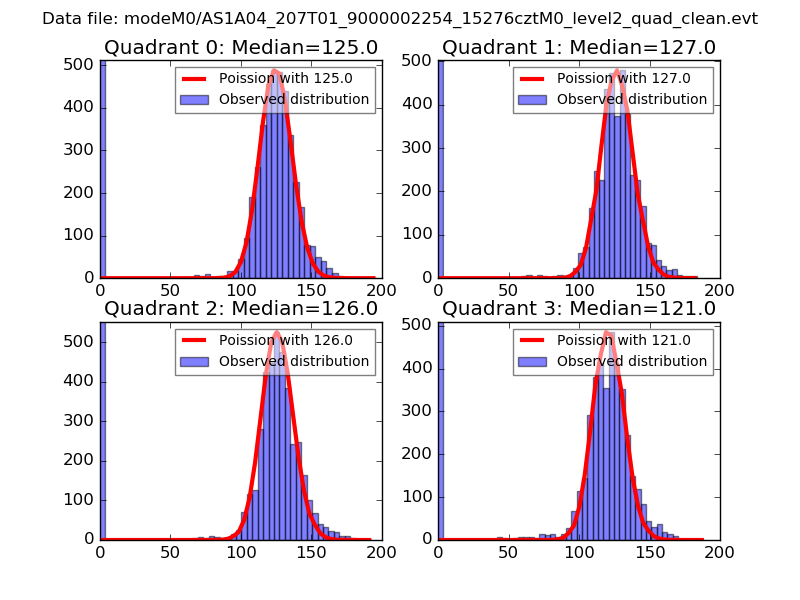 |
 |
| Quadrant-wise count rates Data is divided into 100 sec bins |
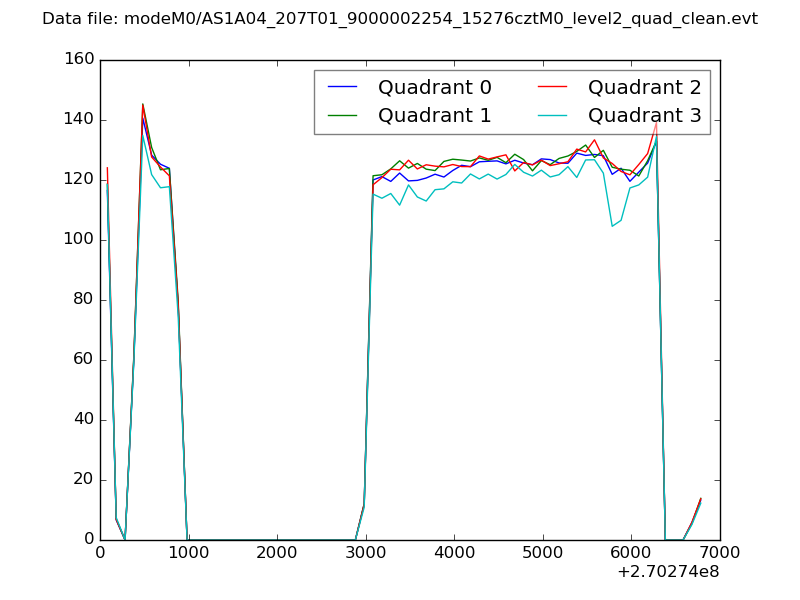 |
|
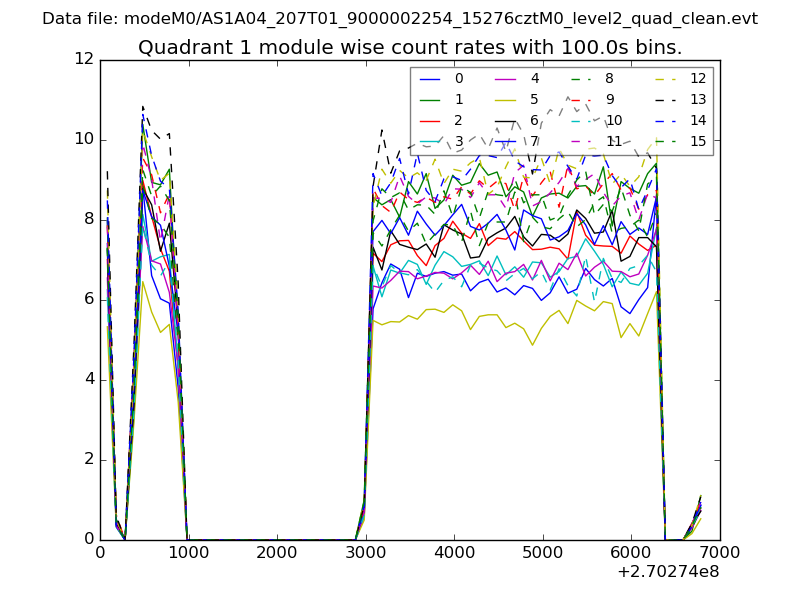
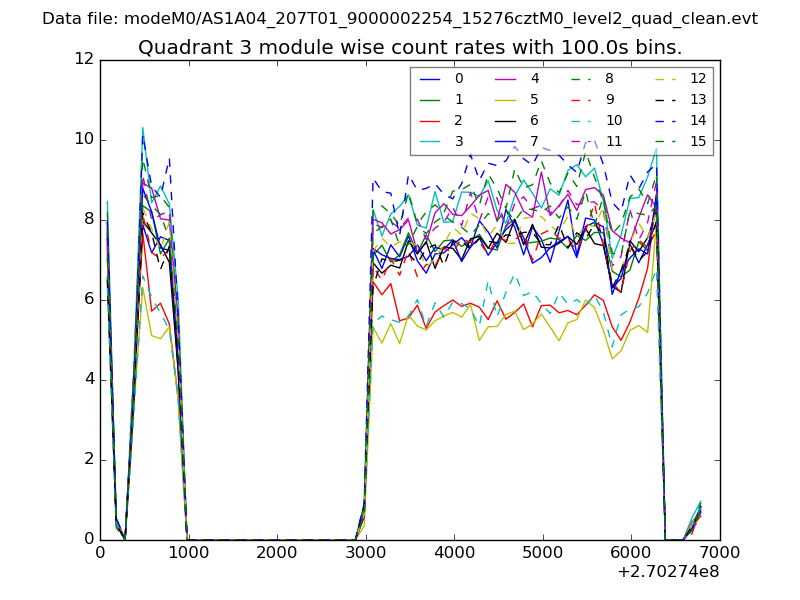
| Module-wise count rates for Quadrant A Data is divided into 100 sec bins |
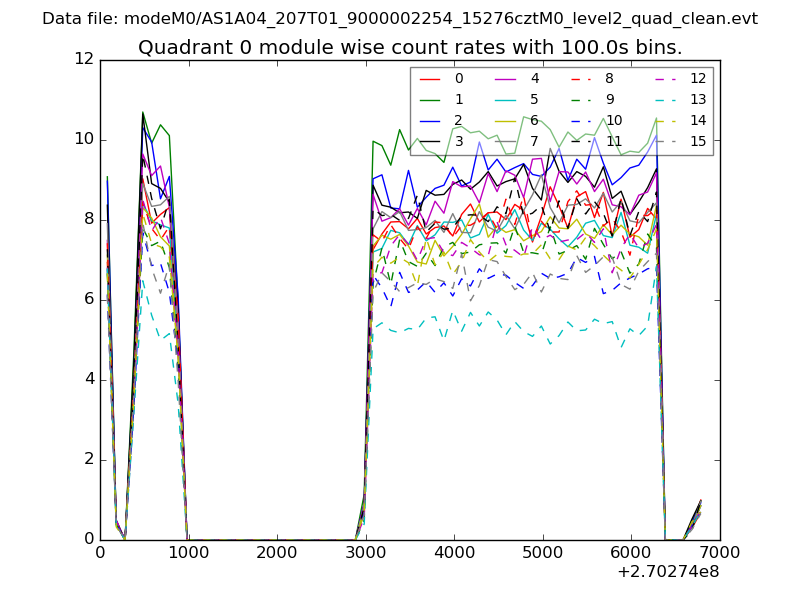 |
 |
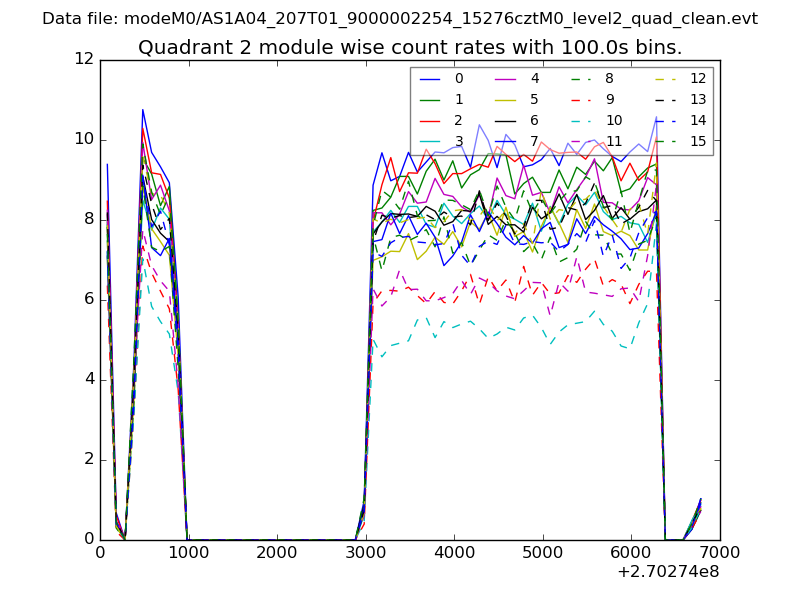
| Module-wise count rates for Quadrant B Data is divided into 100 sec bins |
 |
 |
| Module-wise count rates for Quadrant C Data is divided into 100 sec bins |
 |
 |
| Module-wise count rates for Quadrant D Data is divided into 100 sec bins |
 |
 |
| Parameter | Plot |
|---|---|
| CZT HV Monitor | 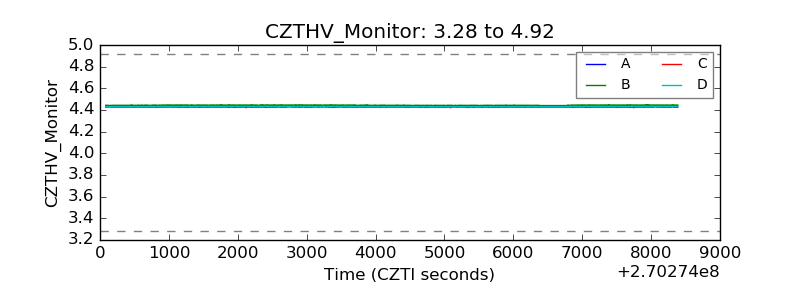 |
| D_VDD | 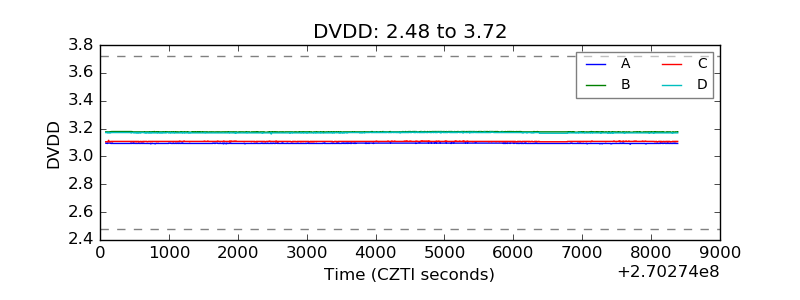 |
| Temperature 1 | 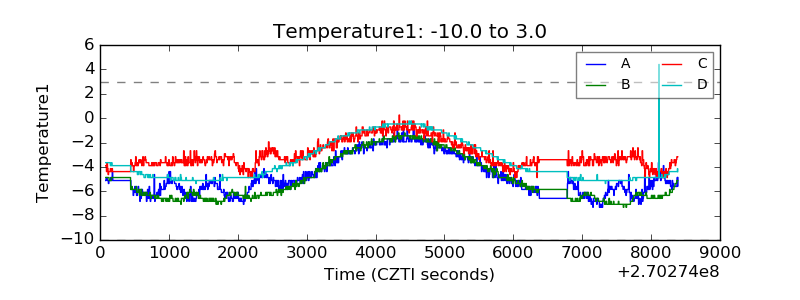 |
| Veto HV Monitor | 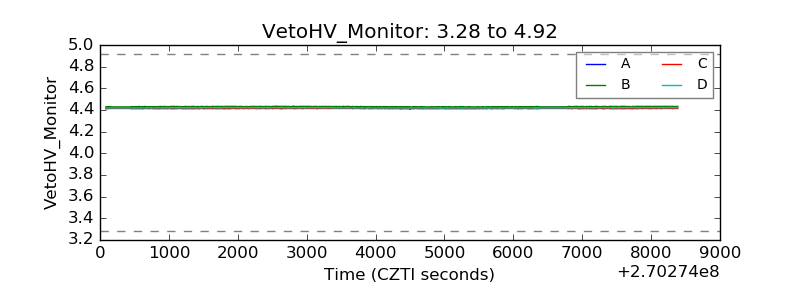 |
| Veto LLD | 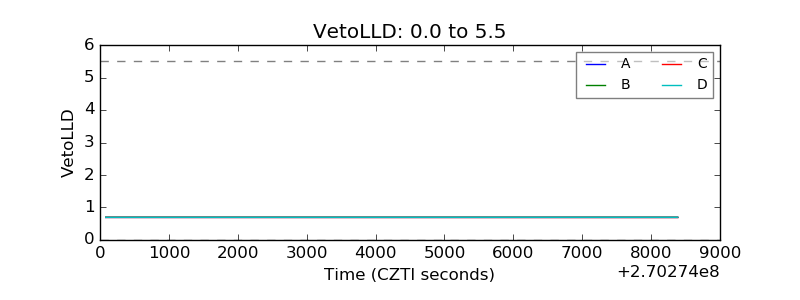 |
| Alpha Counter | 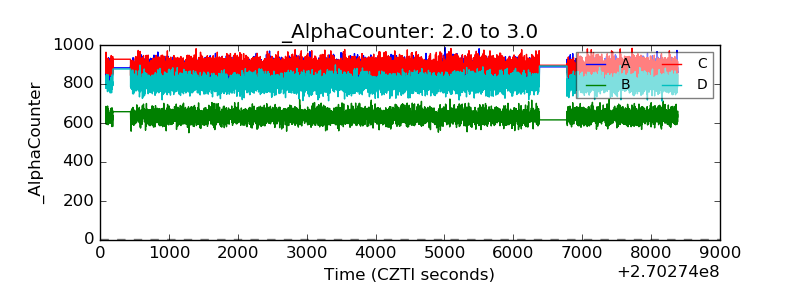 |
| _CPM_Rate | 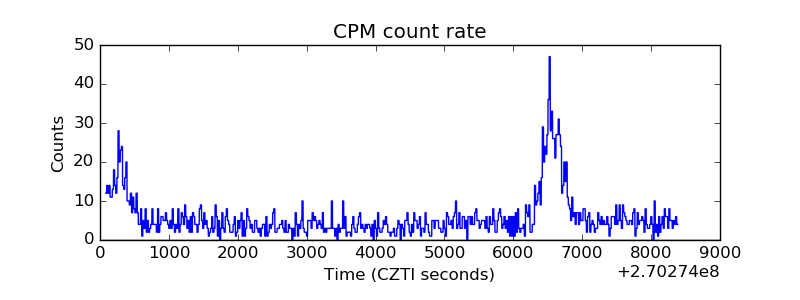 |
| CZT Counter | 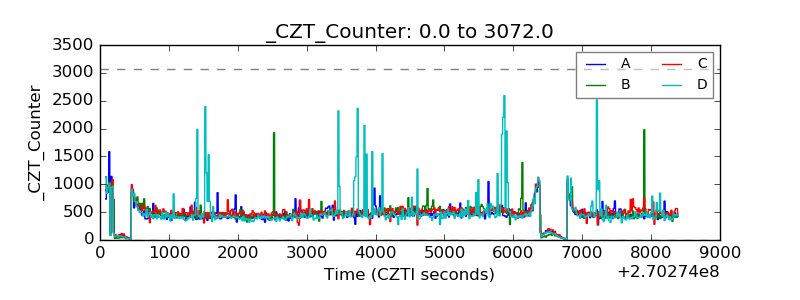 |
| +2.5 Volts monitor |  |
| +5 Volts monitor |  |
| _ROLL_ROT | 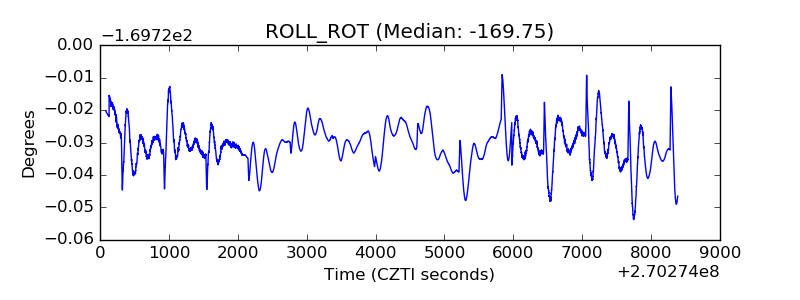 |
| _Roll_DEC | 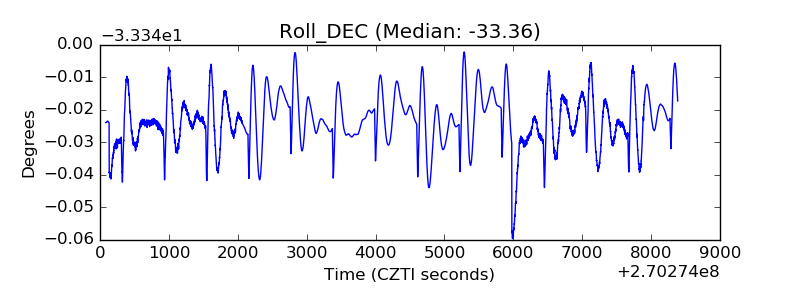 |
| _Roll_RA | 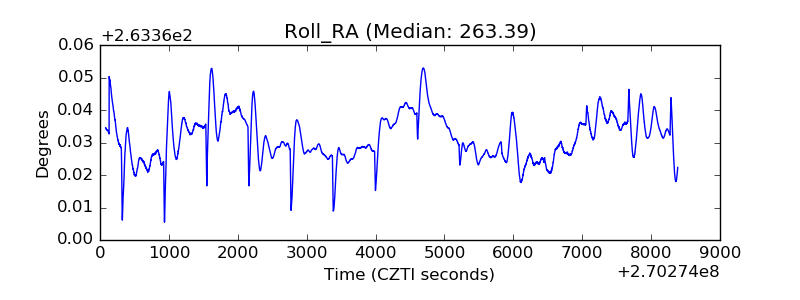 |
| Veto Counter | 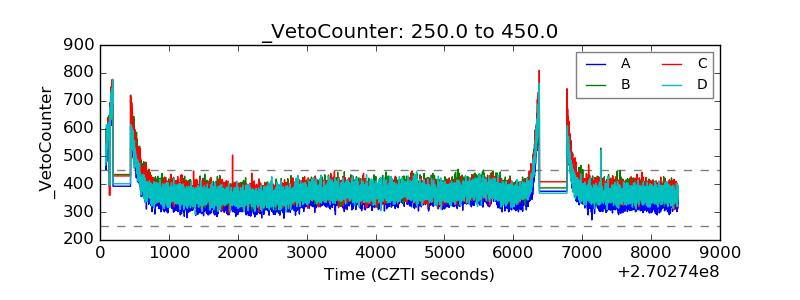 |