| Param | Original file | Final file |
|---|---|---|
| Filename | modeM0/AS1A04_207T01_9000002254_15278cztM0_level2.evt | modeM0/AS1A04_207T01_9000002254_15278cztM0_level2_quad_clean.evt |
| Size (bytes) | 619,476,480 | 109,679,040 |
| Size | 590.8 MB | 104.6 MB |
| Events in quadrant A | 4,346,924 | 672,991 |
| Events in quadrant B | 4,485,668 | 683,271 |
| Events in quadrant C | 4,867,680 | 677,016 |
| Events in quadrant D | 4,432,024 | 645,365 |
| Mode SS | |||
|---|---|---|---|
| Quadrant | BADHDUFLAG | Total packets | Discarded packets |
| A | 0 | 188 | 0 |
| B | 0 | 188 | 0 |
| C | 0 | 188 | 0 |
| D | 0 | 188 | 0 |
| Mode M0 | |||
|---|---|---|---|
| Quadrant | BADHDUFLAG | Total packets | Discarded packets |
| A | 0 | 19059 | 1 |
| B | 0 | 19175 | 1 |
| C | 0 | 19407 | 1 |
| D | 0 | 19826 | 1 |
| Mode M9 | |||
|---|---|---|---|
| Quadrant | BADHDUFLAG | Total packets | Discarded packets |
| A | 0 | 5 | 0 |
| B | 0 | 5 | 0 |
| C | 0 | 5 | 0 |
| D | 0 | 5 | 0 |
| Quadrant | Total seconds | Saturated seconds | Saturation percentage |
|---|---|---|---|
| A | 9266 | 66 | 0.712281% |
| B | 9266 | 66 | 0.712281% |
| C | 9266 | 47 | 0.507231% |
| D | 9266 | 116 | 1.251889% |
Noise dominated data is calculated using 1-second bins in cleaned event files. If a bin has >2000 counts, and if more than 50% of those come from <1% of pixels, then it is considered to be noise-dominated and hence unusable.
| Quadrant | # 1 sec bins | Bins with >0 counts | Bins with >2000 counts | High rate bins dominated by noise | Noise dominated (total time) | Noise dominated (detector-on time) | Marked lightcurve |
|---|---|---|---|---|---|---|---|
| A | 9817 | 9267 | 7 | 7 | 0.07% | 0.08% | 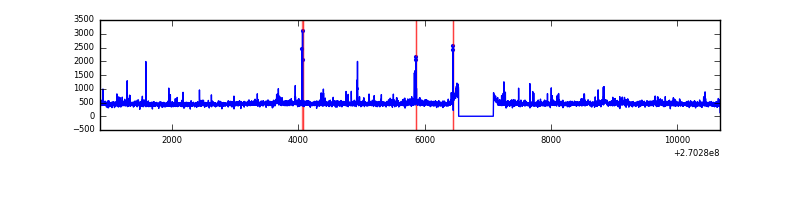 |
| B | 9817 | 9267 | 10 | 10 | 0.10% | 0.11% | 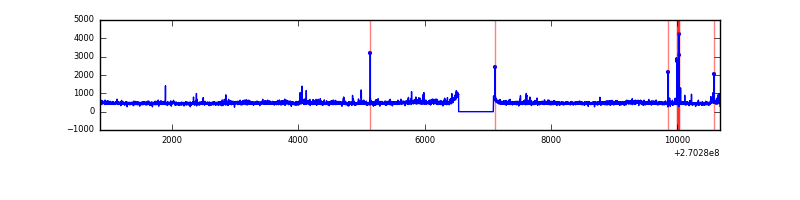 |
| C | 9817 | 9267 | 1 | 1 | 0.01% | 0.01% | 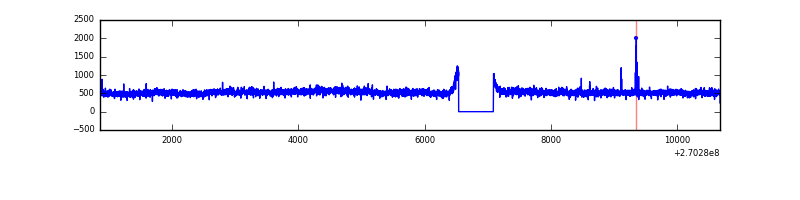 |
| D | 9817 | 9268 | 61 | 61 | 0.62% | 0.66% | 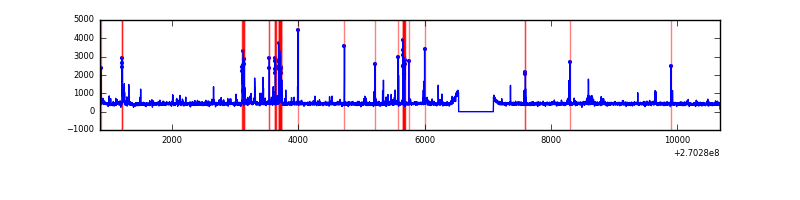 |
Top three noisy pixels from each quadrant. If the there are fewer than three noisy pixels in the level2.evt file, extra rows are filled as -1
| Pixel properties | Quadrant properties | ||||||
|---|---|---|---|---|---|---|---|
| Quadrant | DetID | PixID | Counts | Sigma | Mean | Median | Sigma |
| A | 12 | 189 | 127738 | 575.83 | 1080 | 1055 | 220.0 |
| A | 9 | 143 | 61570 | 275.07 | 1080 | 1055 | 220.0 |
| A | 0 | 226 | 9489 | 38.34 | 1080 | 1055 | 220.0 |
| B | 4 | 142 | 47421 | 222.43 | 1080 | 1050 | 208.5 |
| B | 0 | 205 | 42934 | 200.9 | 1080 | 1050 | 208.5 |
| B | 0 | 229 | 38581 | 180.02 | 1080 | 1050 | 208.5 |
| C | 3 | 233 | 767354 | 3159.05 | 1049 | 1053 | 242.6 |
| C | 10 | 22 | 9330 | 34.12 | 1049 | 1053 | 242.6 |
| C | 13 | 61 | 7565 | 26.85 | 1049 | 1053 | 242.6 |
| D | 2 | 33 | 284892 | 1119.93 | 1043 | 1012 | 253.5 |
| D | 7 | 38 | 124260 | 486.23 | 1043 | 1012 | 253.5 |
| D | 2 | 234 | 37231 | 142.89 | 1043 | 1012 | 253.5 |
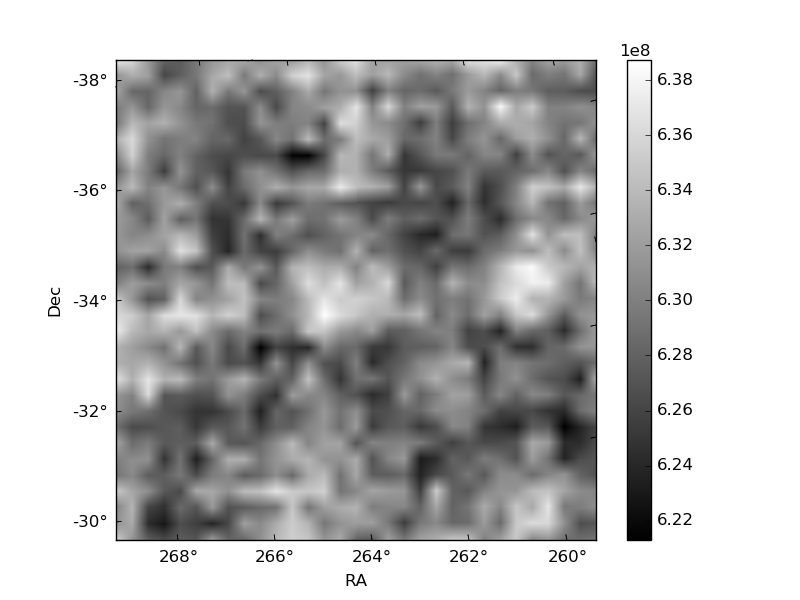
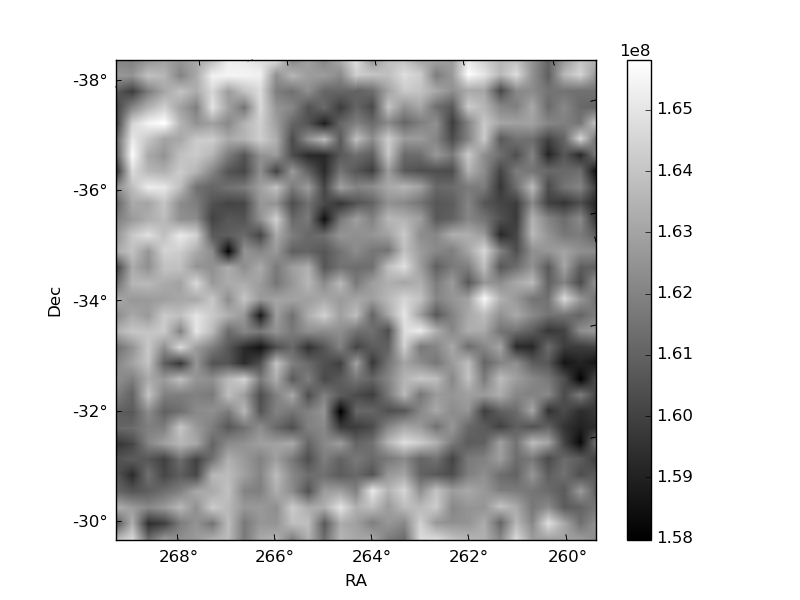
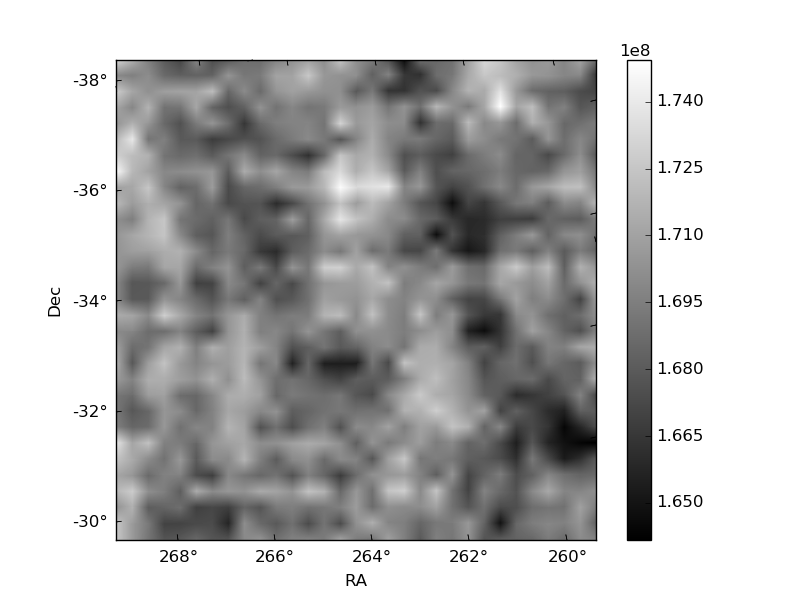
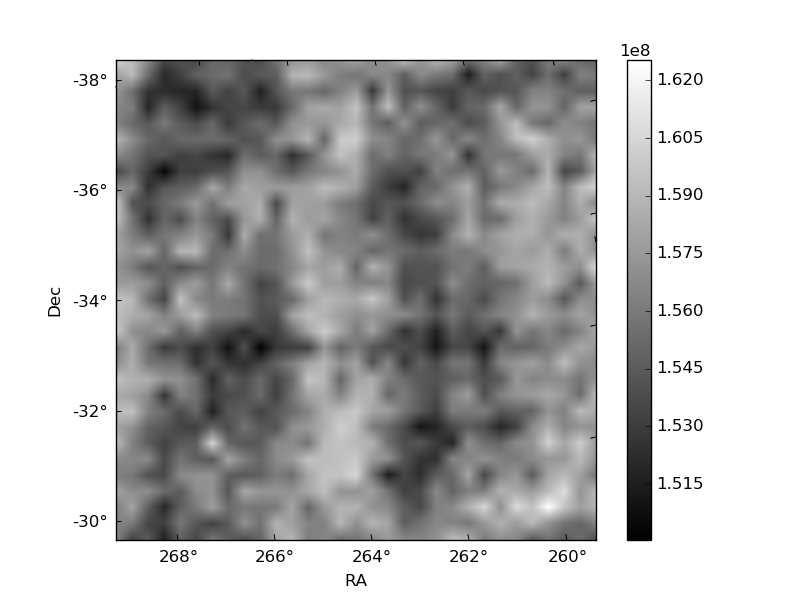
Histogram calculated using DETX and DETY for each event in the final _common_clean file
| Quadrant A | 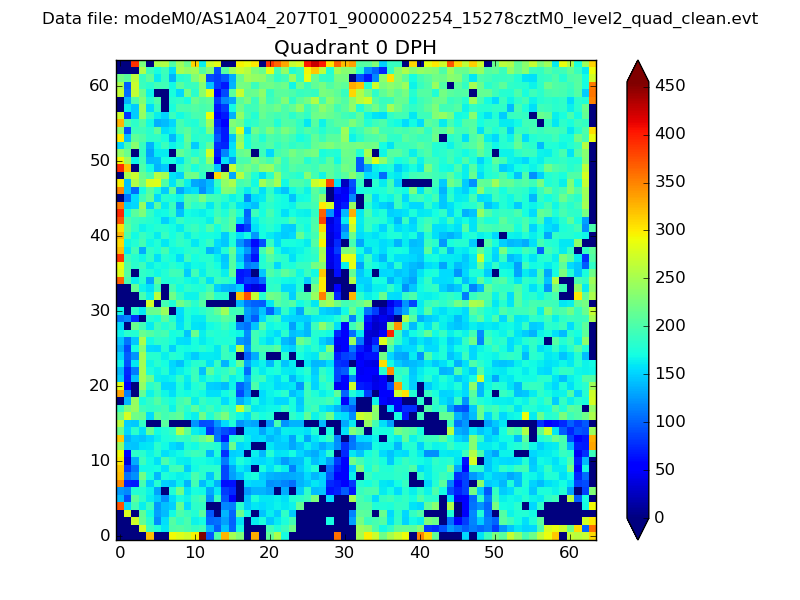 |
 |
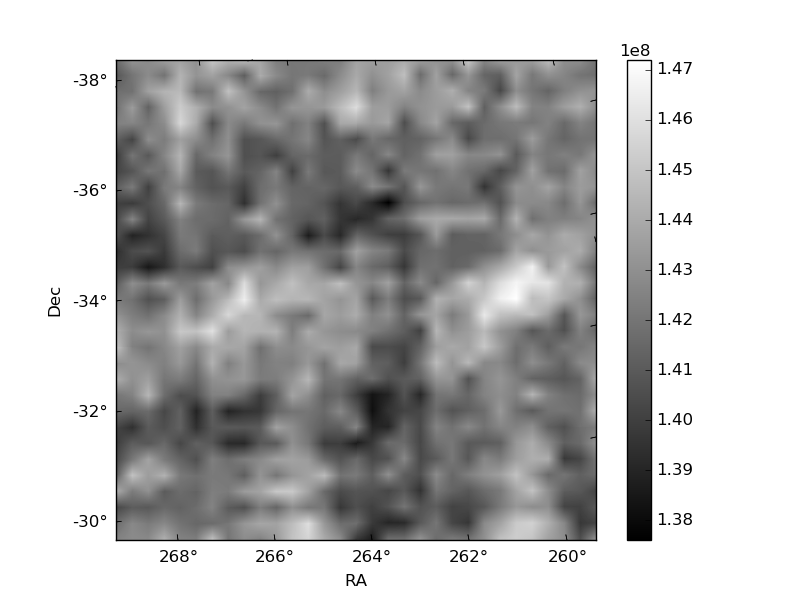
Quadrant B |
|---|---|---|---|
| Quadrant D | 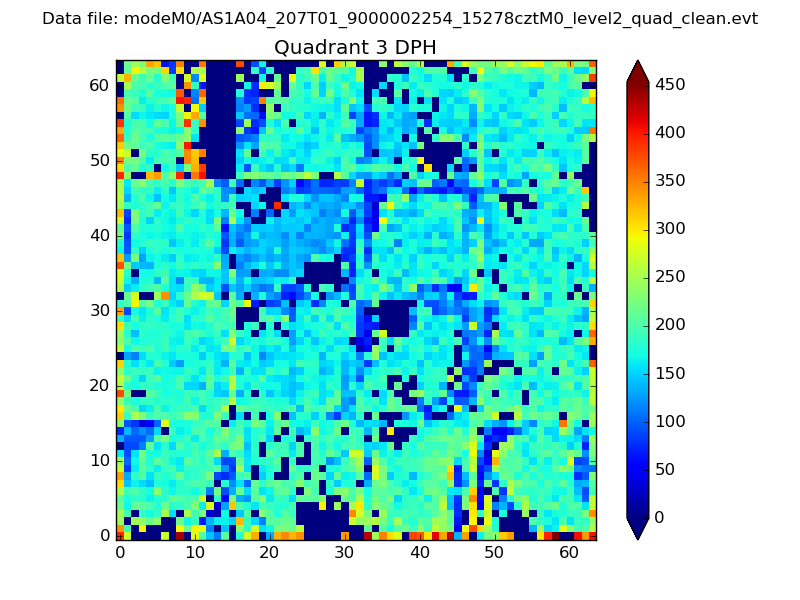 |
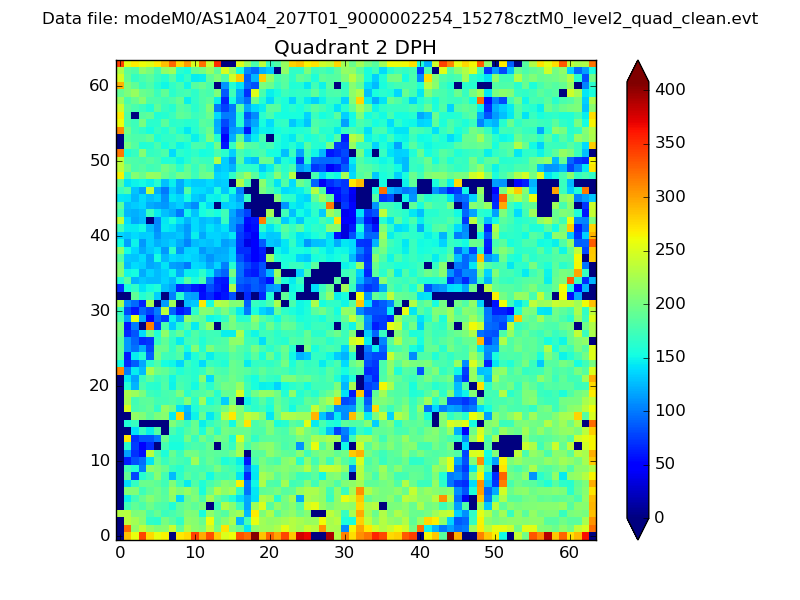 |
Quadrant C |
| Plot type | Count rate plots | Images |
|---|---|---|
| Comparison with Poisson distribution Blue bars denote a histogram of data divided into 1 sec bins. Red curve is a Poisson curve with rate = median count rate of data. |
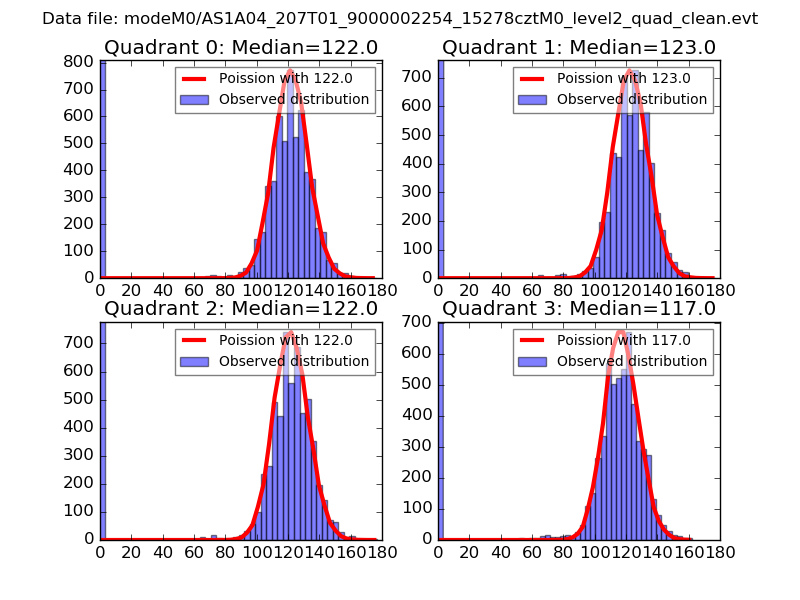 |
 |
| Quadrant-wise count rates Data is divided into 100 sec bins |
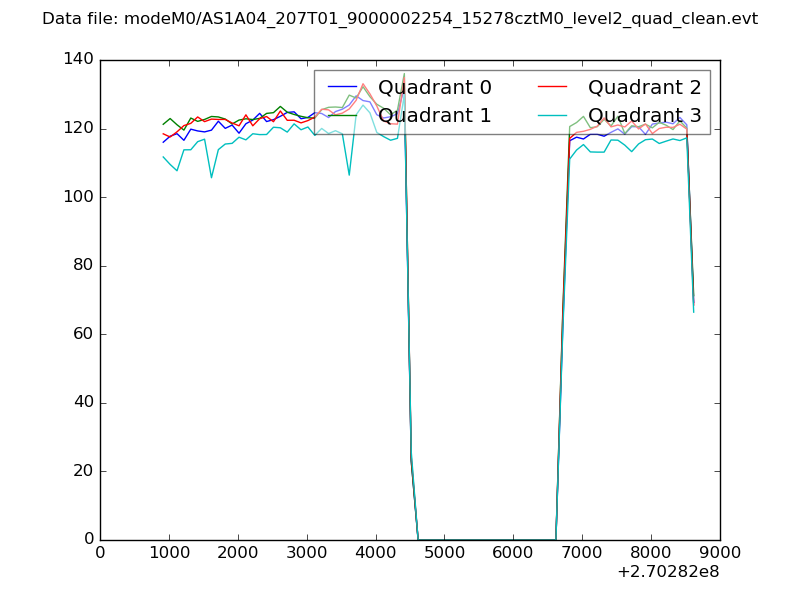 |
|
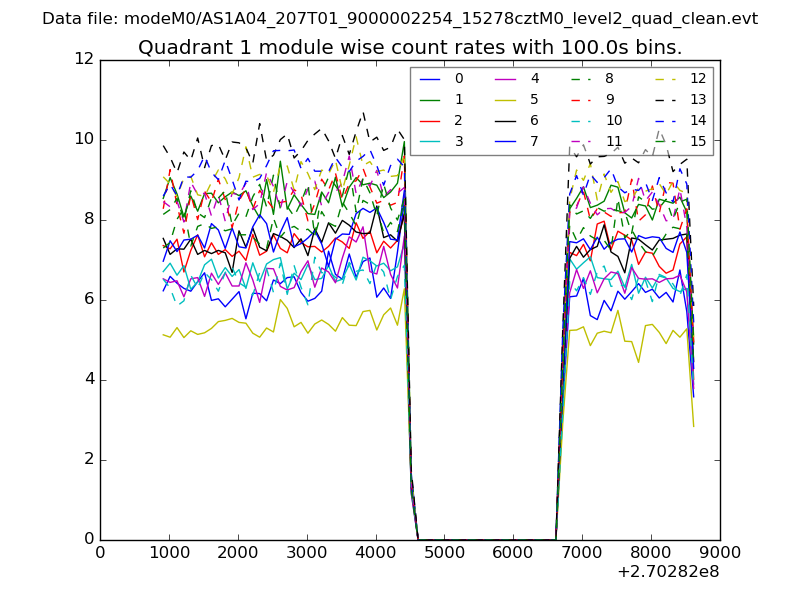
| Module-wise count rates for Quadrant A Data is divided into 100 sec bins |
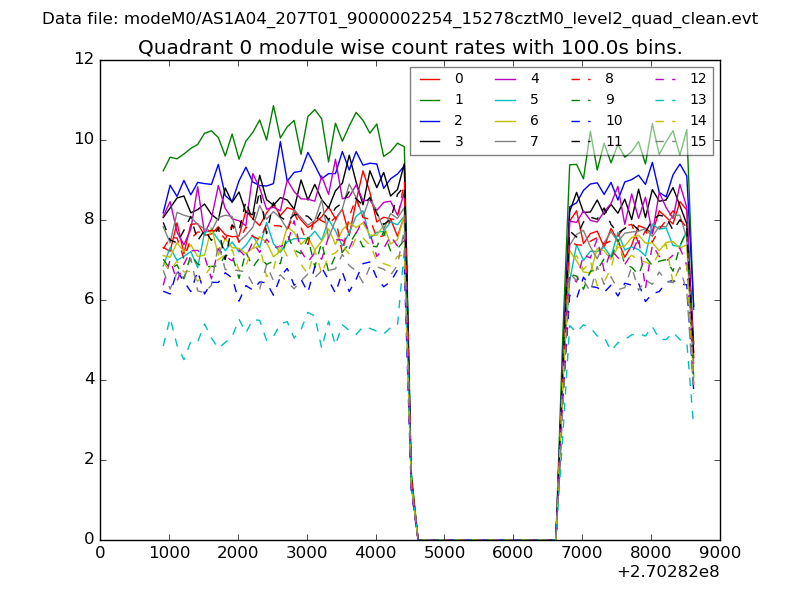 |
 |
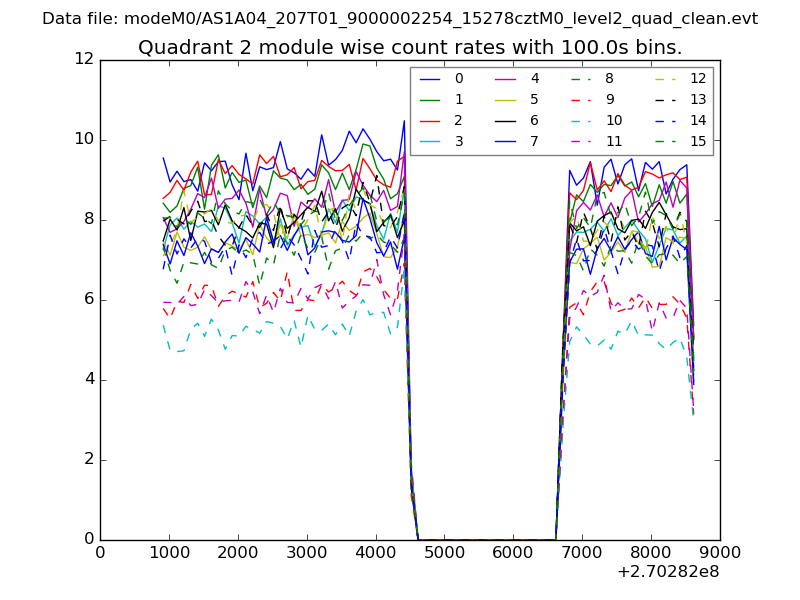
| Module-wise count rates for Quadrant B Data is divided into 100 sec bins |
 |
 |
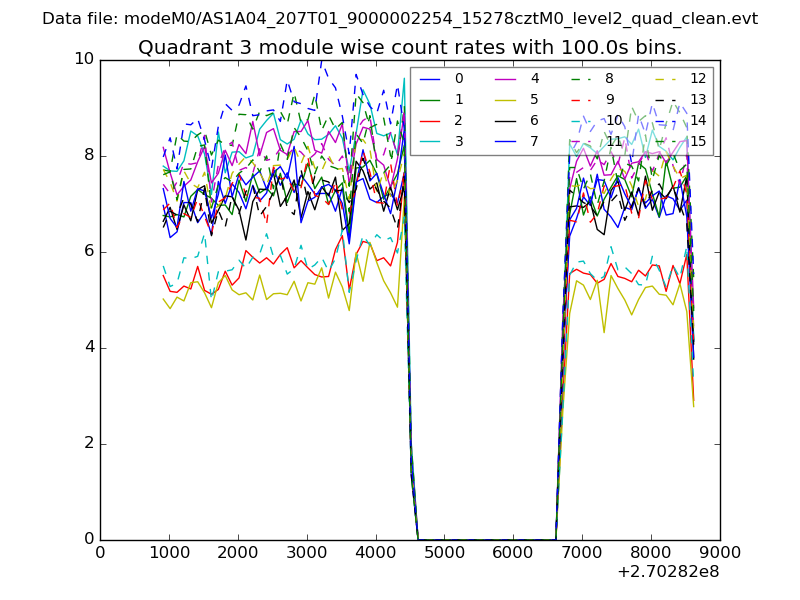
| Module-wise count rates for Quadrant C Data is divided into 100 sec bins |
 |
 |
| Module-wise count rates for Quadrant D Data is divided into 100 sec bins |
 |
 |
| Parameter | Plot |
|---|---|
| CZT HV Monitor | 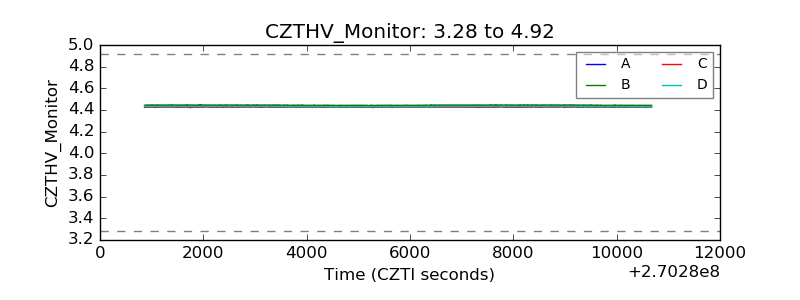 |
| D_VDD | 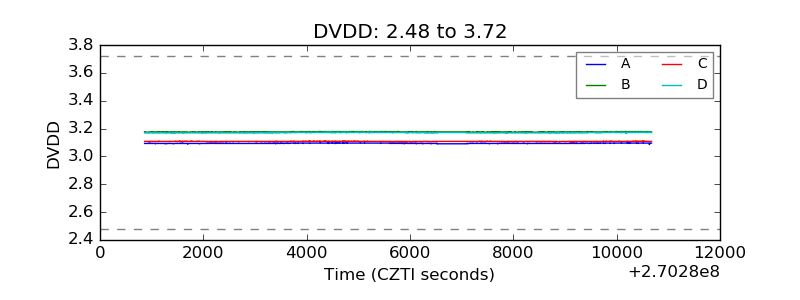 |
| Temperature 1 | 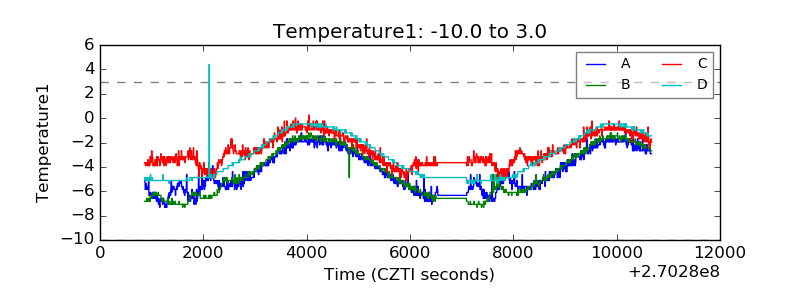 |
| Veto HV Monitor | 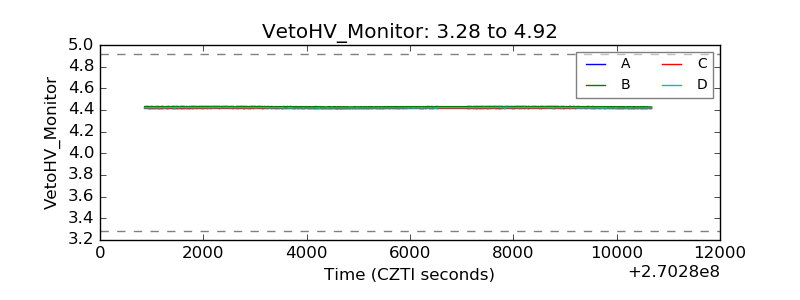 |
| Veto LLD |  |
| Alpha Counter | 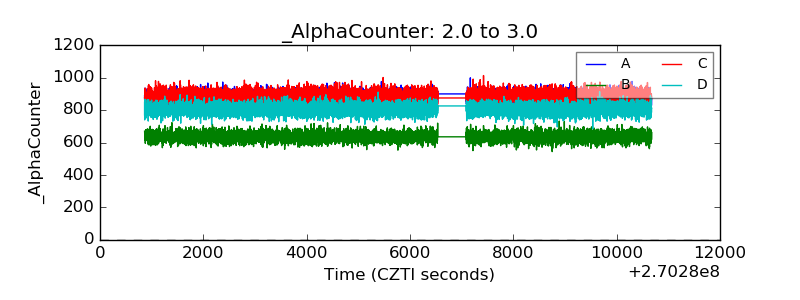 |
| _CPM_Rate | 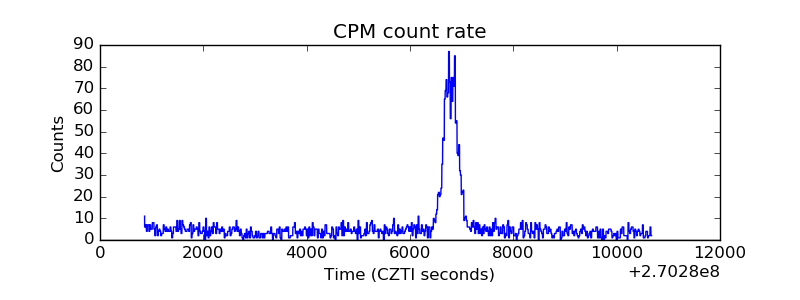 |
| CZT Counter | 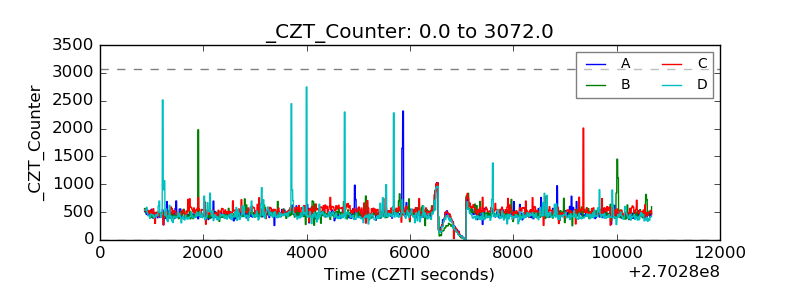 |
| +2.5 Volts monitor |  |
| +5 Volts monitor |  |
| _ROLL_ROT | 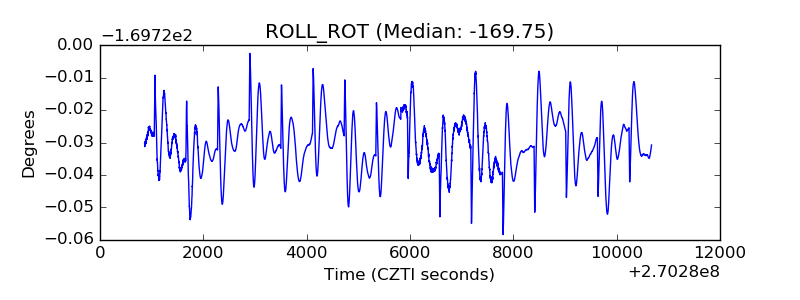 |
| _Roll_DEC | 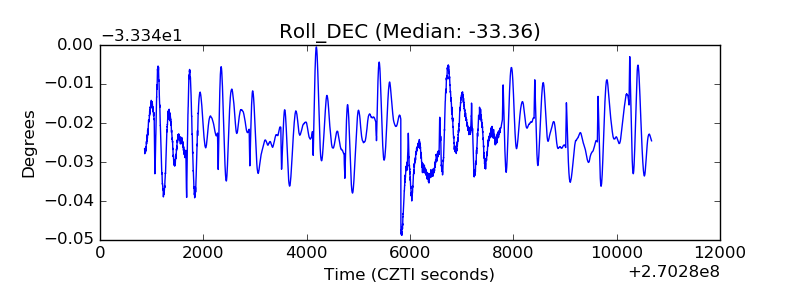 |
| _Roll_RA | 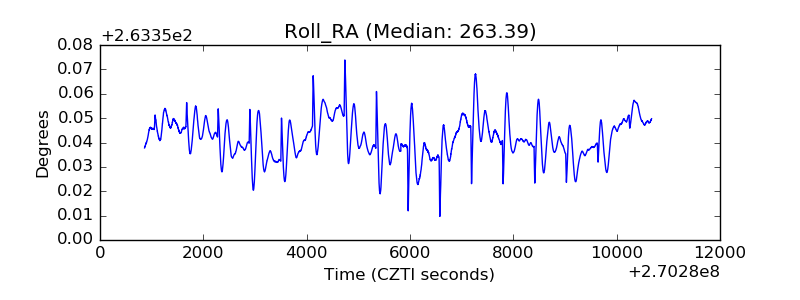 |
| Veto Counter | 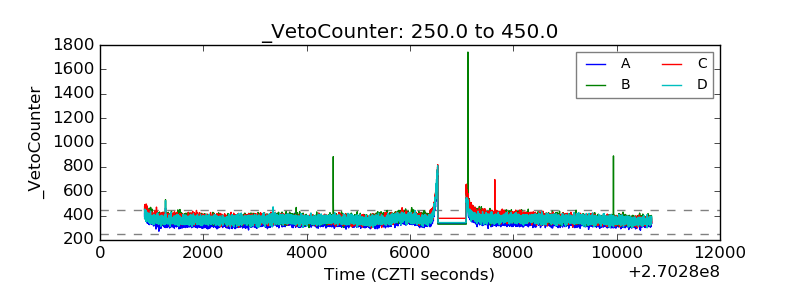 |