| Param | Original file | Final file |
|---|---|---|
| Filename | modeM0/AS1A04_223T01_9000002258cztM0_level2.fits | modeM0/AS1A04_223T01_9000002258cztM0_level2_quad_clean.evt |
| Size (bytes) | 998,922,240 | 896,595,840 |
| Size | 952.6 MB | 855.1 MB |
| Events in quadrant A | 6,146,084 | 5,243,954 |
| Events in quadrant B | 5,787,686 | 5,236,484 |
| Events in quadrant C | 5,978,660 | 4,976,679 |
| Events in quadrant D | 5,212,642 | 4,568,908 |
| Mode SS | |||
|---|---|---|---|
| Quadrant | BADHDUFLAG | Total packets | Discarded packets |
| A | 0 | 2126 | 0 |
| B | 0 | 2126 | 0 |
| C | 0 | 2126 | 0 |
| D | 0 | 2126 | 0 |
| Mode M9 | |||
|---|---|---|---|
| Quadrant | BADHDUFLAG | Total packets | Discarded packets |
| A | 0 | 162 | 0 |
| B | 0 | 162 | 0 |
| C | 0 | 162 | 0 |
| D | 0 | 162 | 0 |
| Mode M0 | |||
|---|---|---|---|
| Quadrant | BADHDUFLAG | Total packets | Discarded packets |
| A | 0 | 216278 | 0 |
| B | 0 | 242986 | 0 |
| C | 0 | 225691 | 0 |
| D | 0 | 222832 | 0 |
| Quadrant | Total seconds | Saturated seconds | Saturation percentage |
|---|---|---|---|
| A | 103959 | 1035 | 0.995585% |
| B | 103959 | 3424 | 3.293606% |
| C | 103959 | 1063 | 1.022518% |
| D | 103959 | 1297 | 1.247607% |
Noise dominated data is calculated using 1-second bins in cleaned event files. If a bin has >2000 counts, and if more than 50% of those come from <1% of pixels, then it is considered to be noise-dominated and hence unusable.
| Quadrant | # 1 sec bins | Bins with >0 counts | Bins with >2000 counts | High rate bins dominated by noise | Noise dominated (total time) | Noise dominated (detector-on time) | Marked lightcurve |
|---|---|---|---|---|---|---|---|
| A | 120544 | 103952 | 0 | 0 | 0.00% | 0.00% | 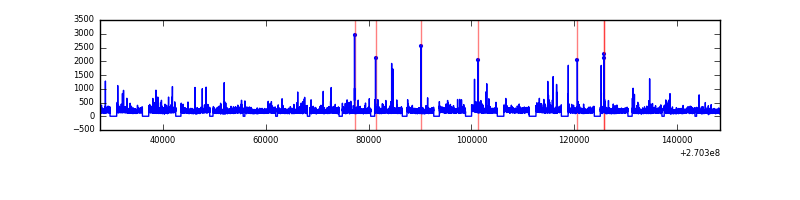 |
| B | 120544 | 103826 | 0 | 0 | 0.00% | 0.00% | 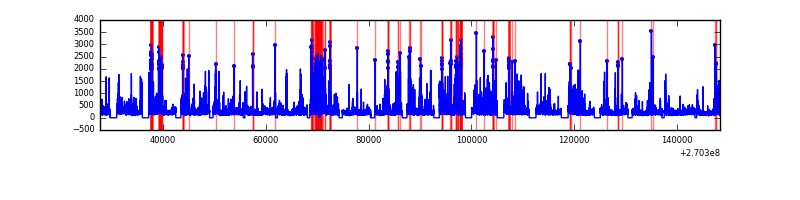 |
| C | 120544 | 103950 | 0 | 0 | 0.00% | 0.00% | 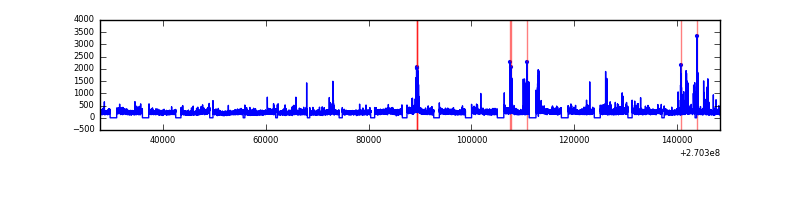 |
| D | 120544 | 103949 | 0 | 0 | 0.00% | 0.00% | 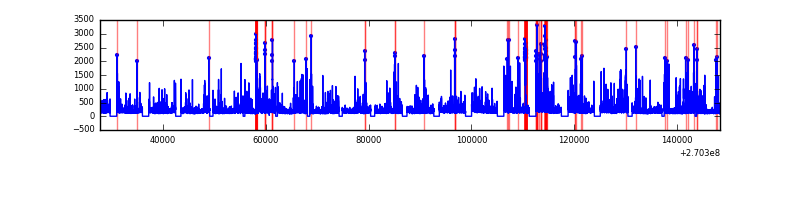 |
Top three noisy pixels from each quadrant. If the there are fewer than three noisy pixels in the level2.evt file, extra rows are filled as -1
| Pixel properties | Quadrant properties | ||||||
|---|---|---|---|---|---|---|---|
| Quadrant | DetID | PixID | Counts | Sigma | Mean | Median | Sigma |
| A | 0 | 29 | 5879 | 11.07 | 1598 | 1491 | 396.5 |
| A | 7 | 110 | 4817 | 8.39 | 1598 | 1491 | 396.5 |
| A | 15 | 236 | 4584 | 7.8 | 1598 | 1491 | 396.5 |
| B | 2 | 9 | 4672 | 10.71 | 1530 | 1457 | 300.1 |
| B | 2 | 8 | 3963 | 8.35 | 1530 | 1457 | 300.1 |
| B | 3 | 17 | 3783 | 7.75 | 1530 | 1457 | 300.1 |
| C | 1 | 80 | 4553 | 7.56 | 1577 | 1465 | 408.2 |
| C | 1 | 81 | 4482 | 7.39 | 1577 | 1465 | 408.2 |
| C | 12 | 241 | 4129 | 6.53 | 1577 | 1465 | 408.2 |
| D | 3 | 14 | 3706 | 5.88 | 1489 | 1354 | 400.1 |
| D | 6 | 231 | 3698 | 5.86 | 1489 | 1354 | 400.1 |
| D | 7 | 3 | 3599 | 5.61 | 1489 | 1354 | 400.1 |
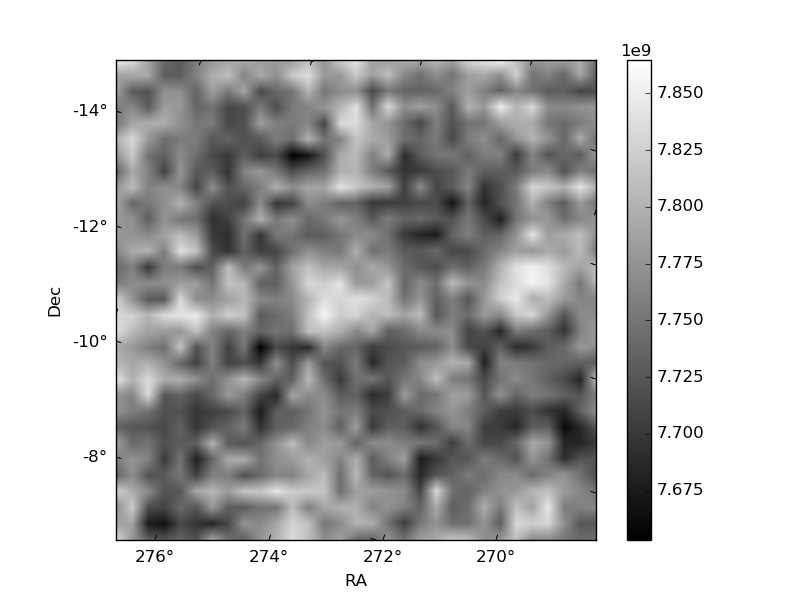
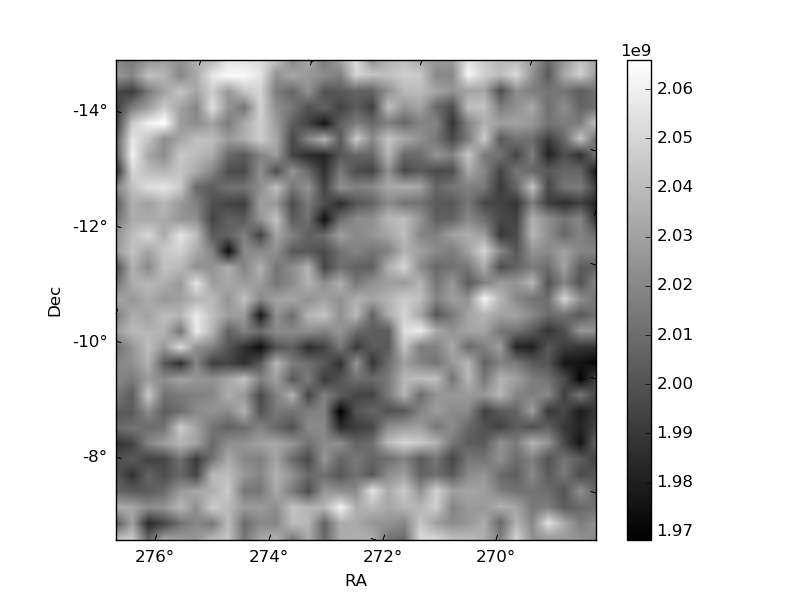
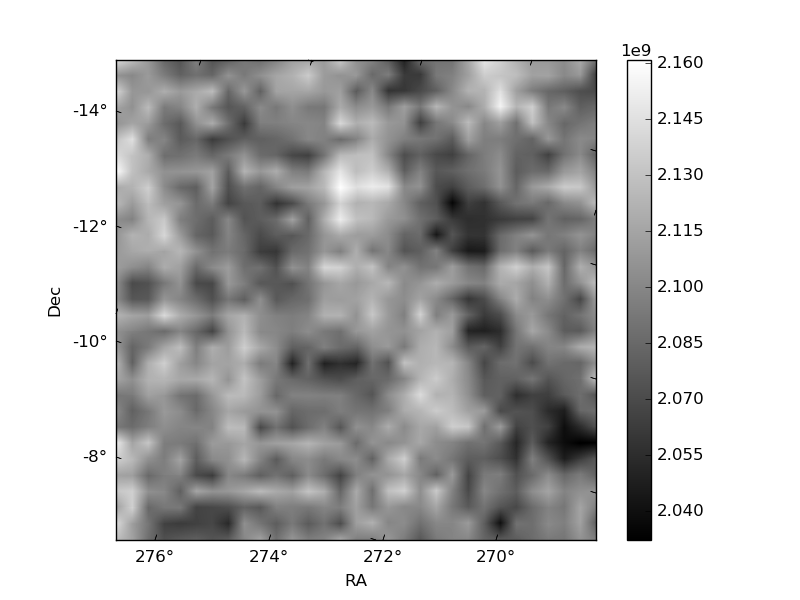
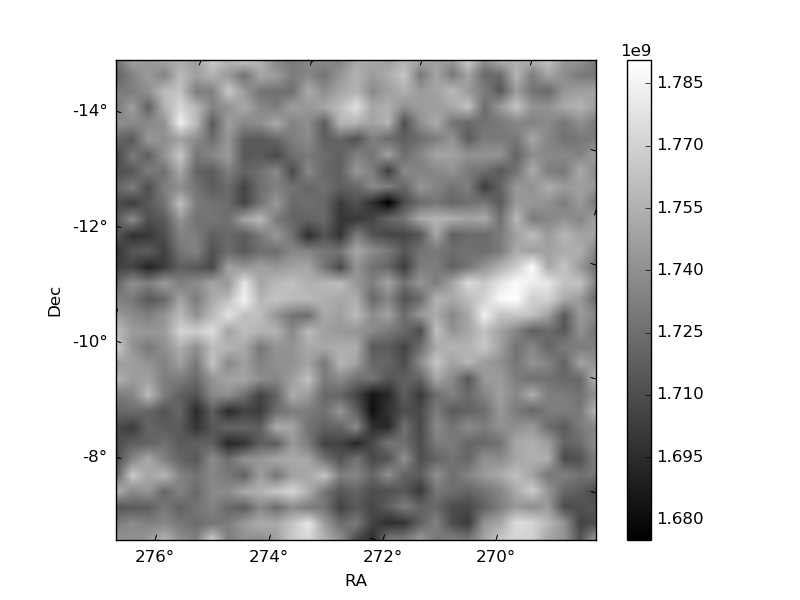
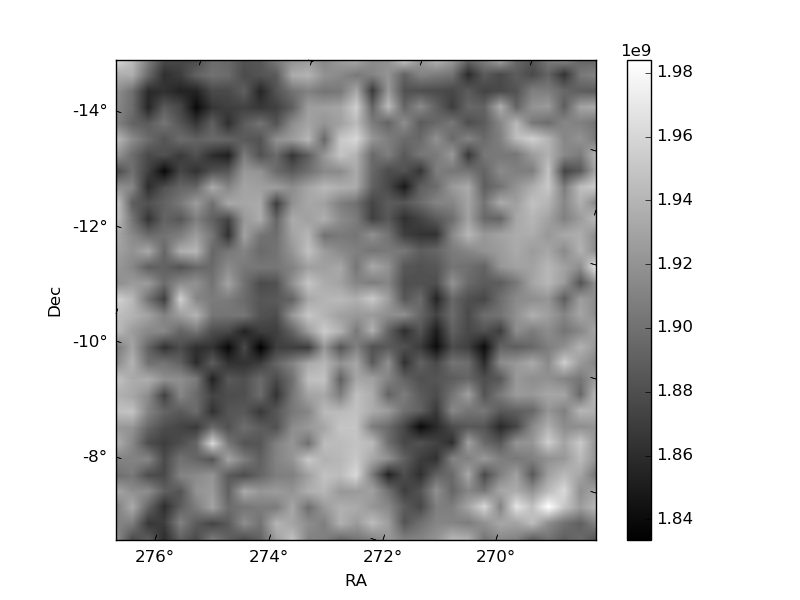
Histogram calculated using DETX and DETY for each event in the final _common_clean file
| Quadrant A | 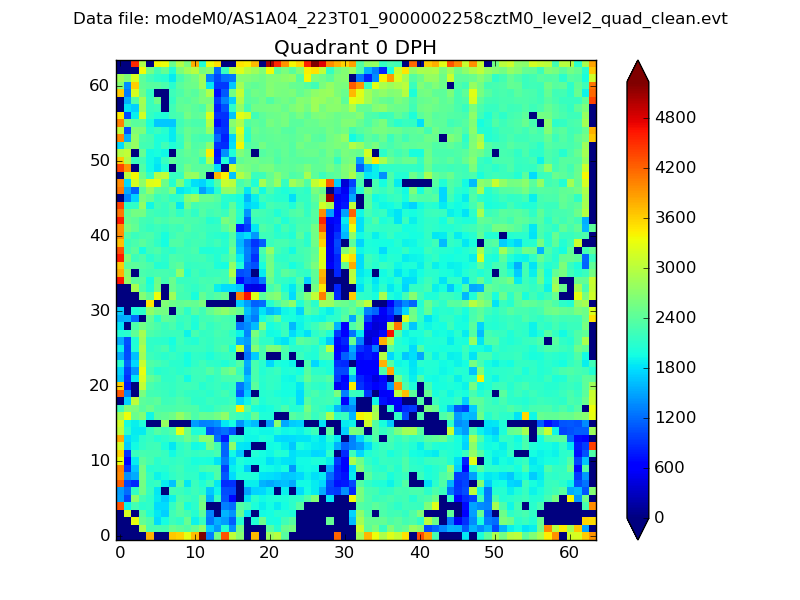 |
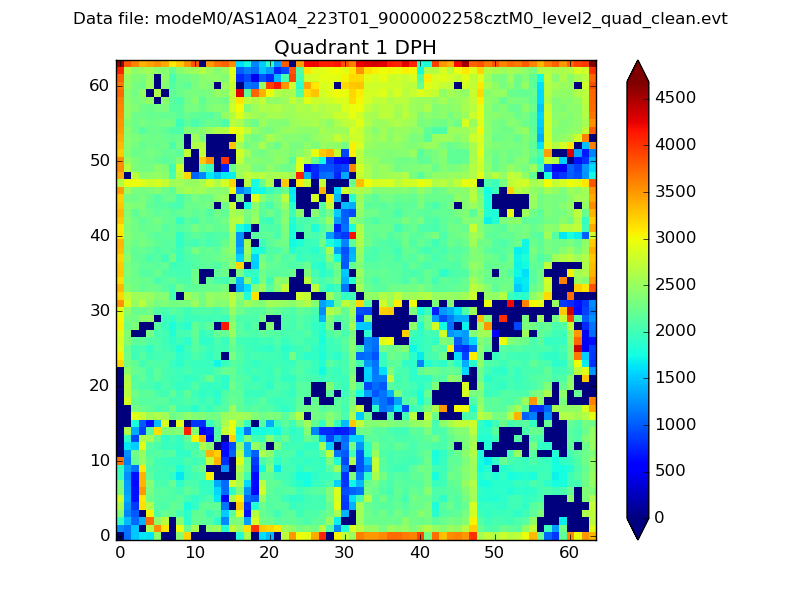 |
Quadrant B |
|---|---|---|---|
| Quadrant D | 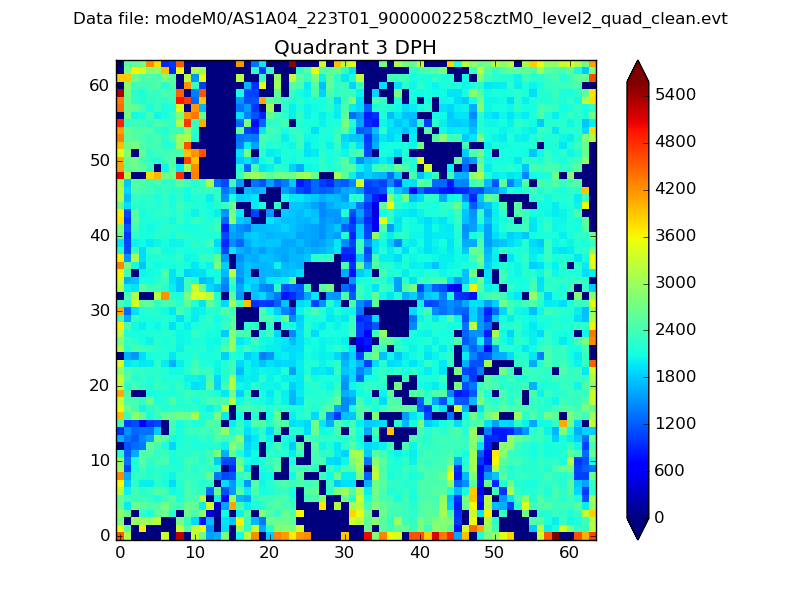 |
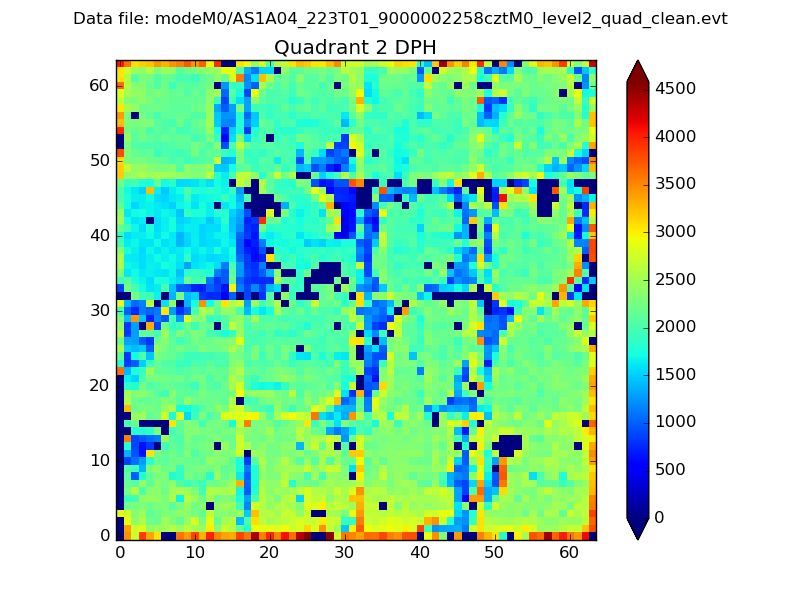 |
Quadrant C |
| Plot type | Count rate plots | Images |
|---|---|---|
| Comparison with Poisson distribution Blue bars denote a histogram of data divided into 1 sec bins. Red curve is a Poisson curve with rate = median count rate of data. |
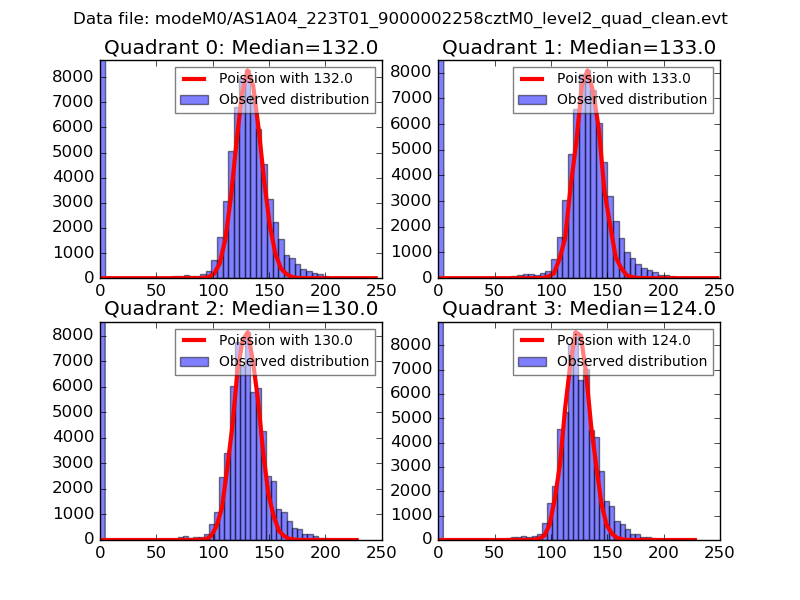 |
 |
| Quadrant-wise count rates Data is divided into 100 sec bins |
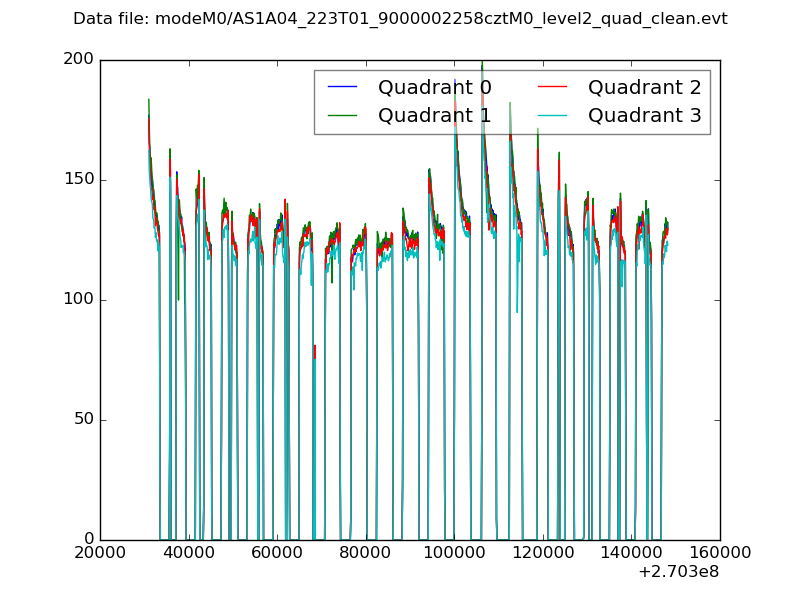 |
|
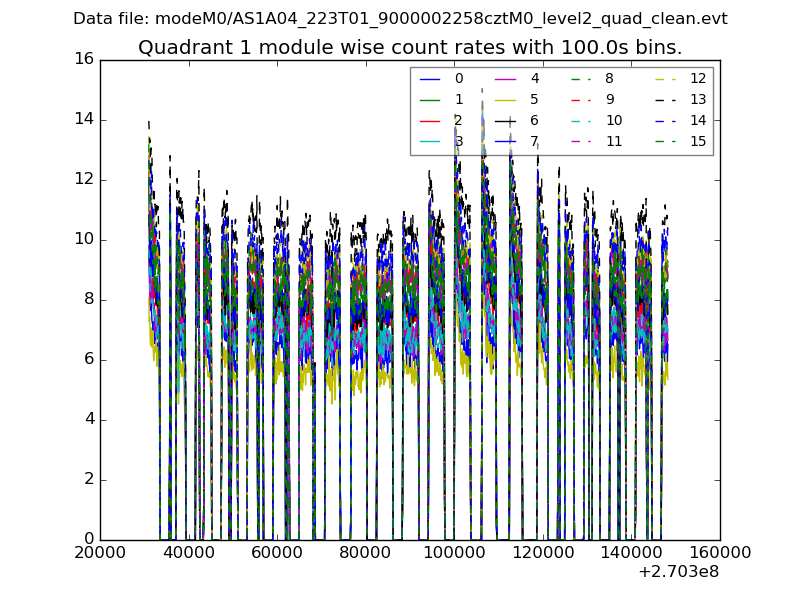
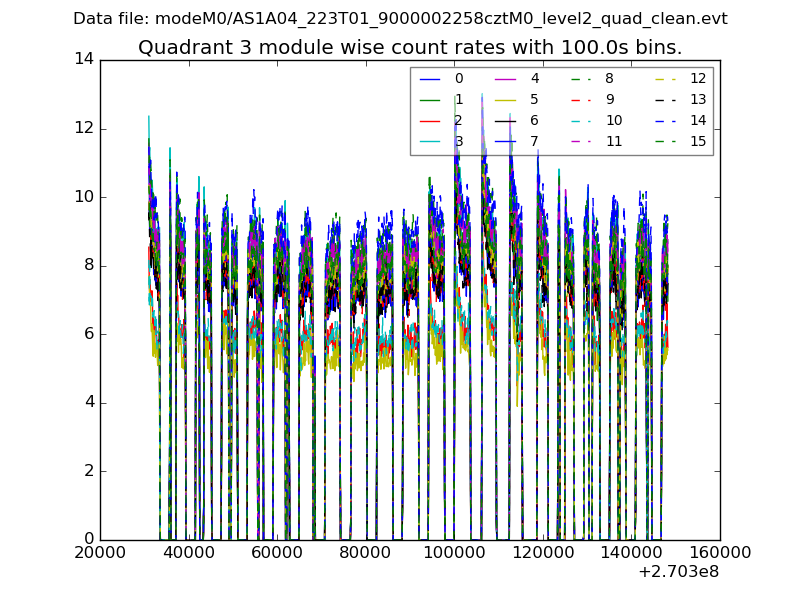
| Module-wise count rates for Quadrant A Data is divided into 100 sec bins |
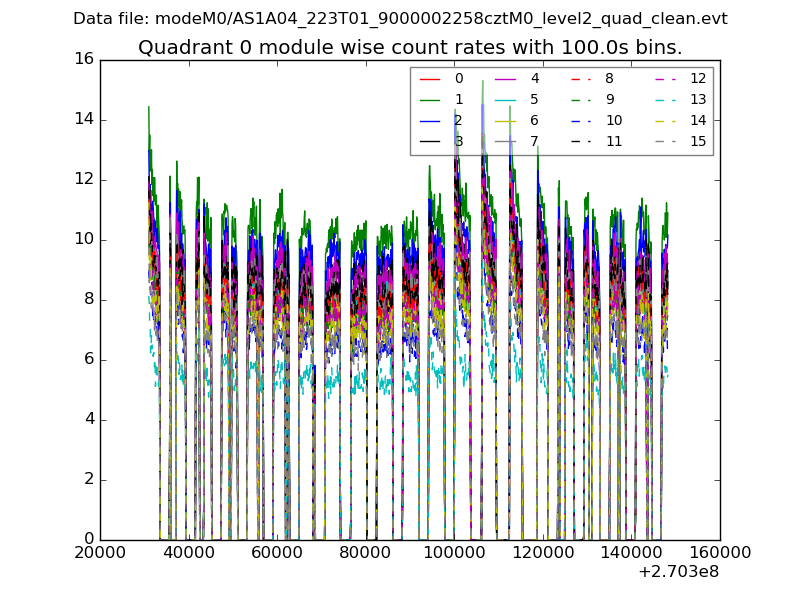 |
 |
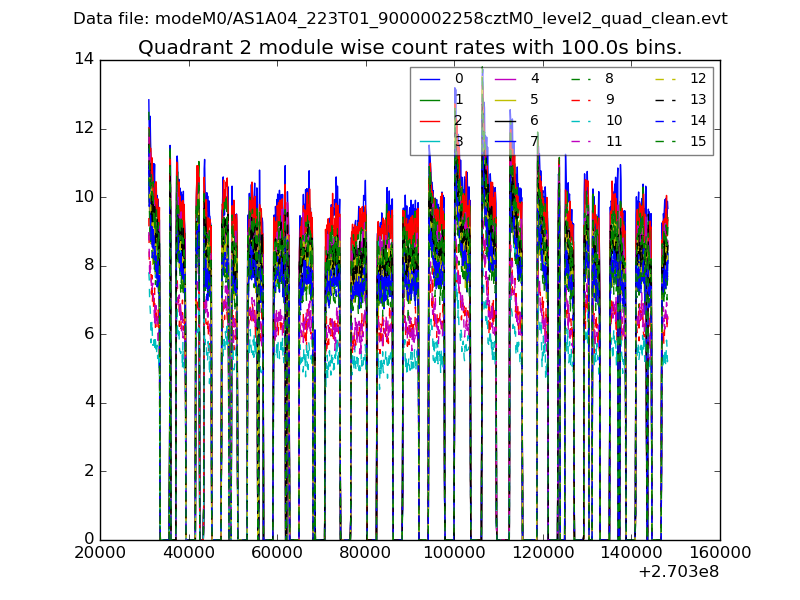
| Module-wise count rates for Quadrant B Data is divided into 100 sec bins |
 |
 |
| Module-wise count rates for Quadrant C Data is divided into 100 sec bins |
 |
 |
| Module-wise count rates for Quadrant D Data is divided into 100 sec bins |
 |
 |
| Parameter | Plot |
|---|---|
| CZT HV Monitor | 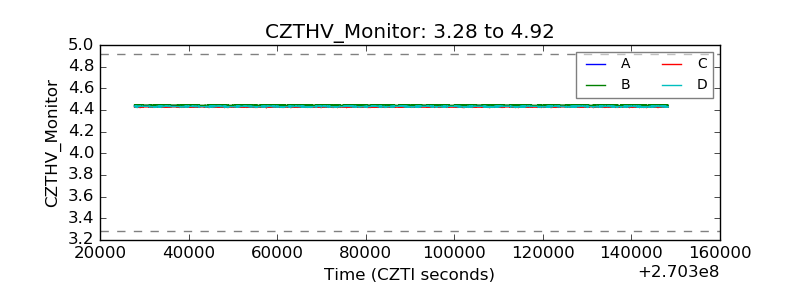 |
| D_VDD | 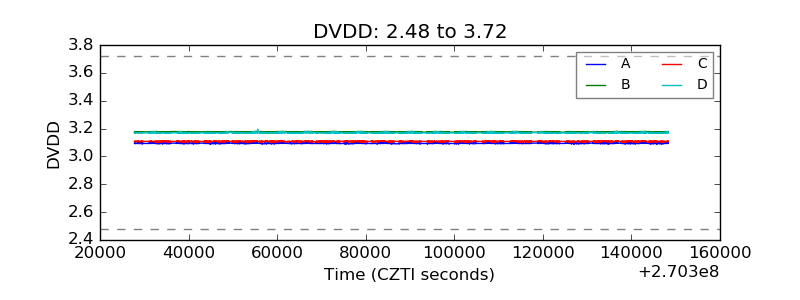 |
| Temperature 1 | 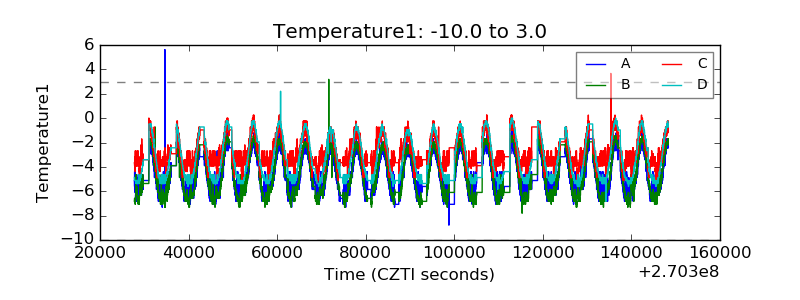 |
| Veto HV Monitor | 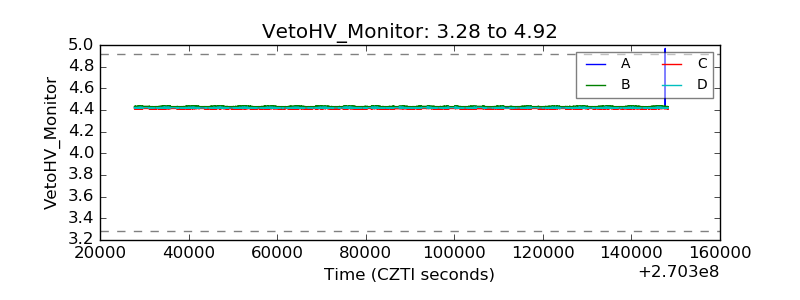 |
| Veto LLD | 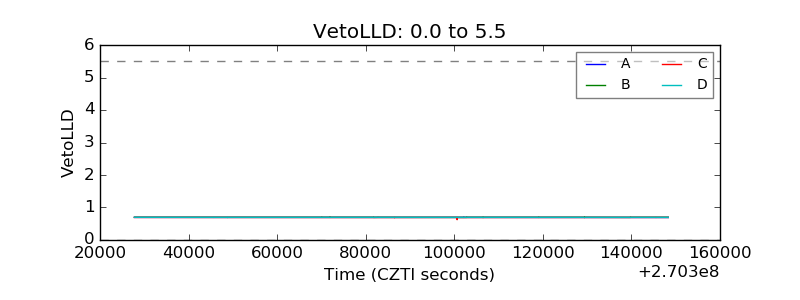 |
| Alpha Counter | 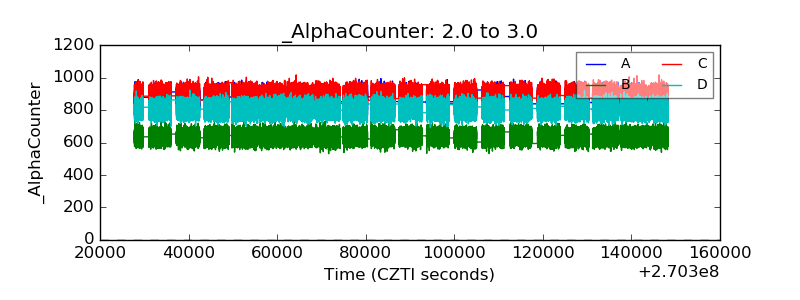 |
| _CPM_Rate | 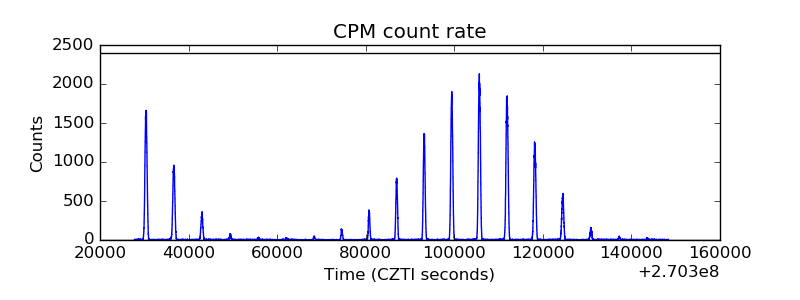 |
| CZT Counter | 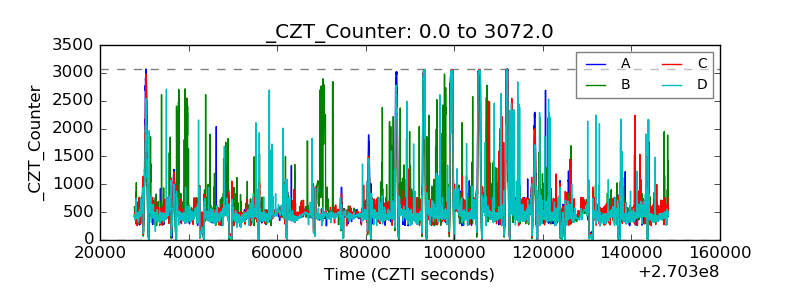 |
| +2.5 Volts monitor | 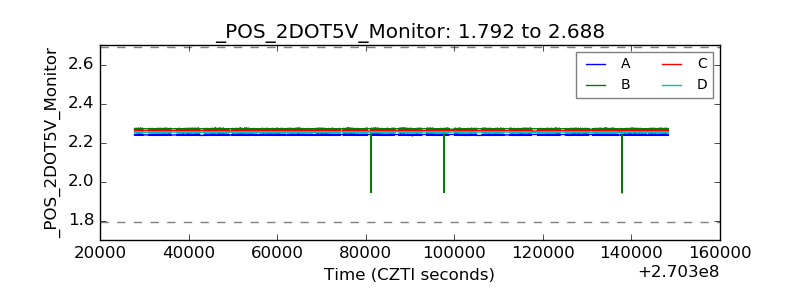 |
| +5 Volts monitor | 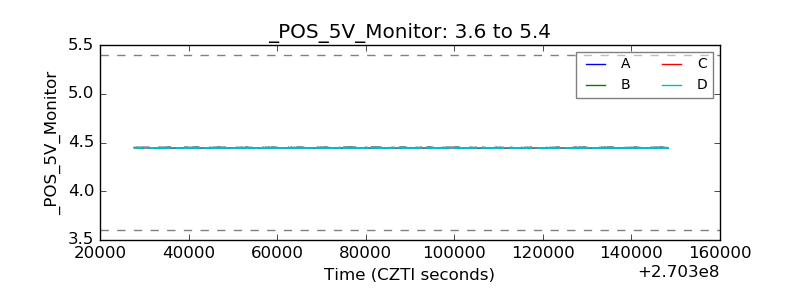 |
| _ROLL_ROT | 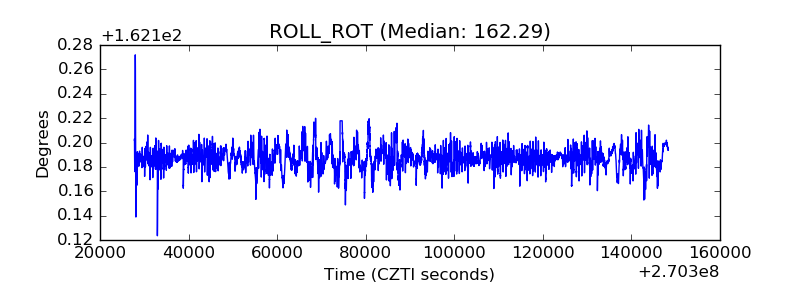 |
| _Roll_DEC | 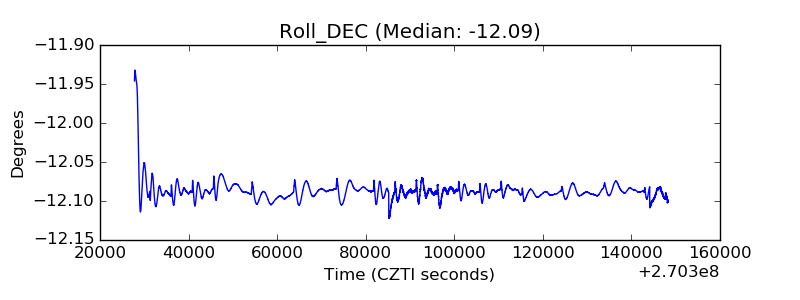 |
| _Roll_RA | 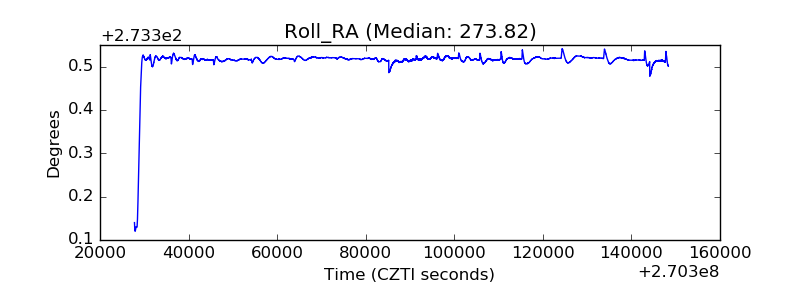 |
| Veto Counter | 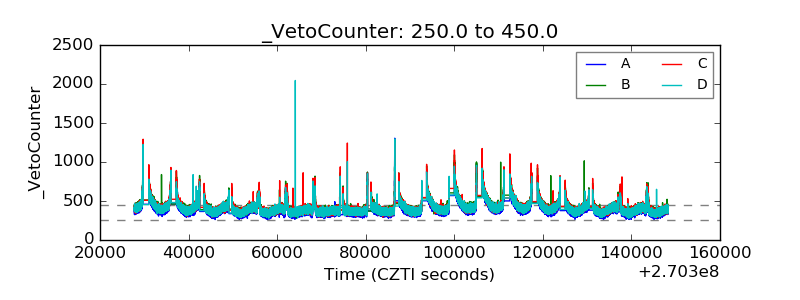 |