| Param | Original file | Final file |
|---|---|---|
| Filename | modeM0/AS1A04_223T01_9000002258_15285cztM0_level2.evt | modeM0/AS1A04_223T01_9000002258_15285cztM0_level2_quad_clean.evt |
| Size (bytes) | 246,631,680 | 34,591,680 |
| Size | 235.2 MB | 33.0 MB |
| Events in quadrant A | 1,736,535 | 206,543 |
| Events in quadrant B | 1,965,472 | 211,147 |
| Events in quadrant C | 1,825,891 | 202,112 |
| Events in quadrant D | 1,715,255 | 192,667 |
| Mode SS | |||
|---|---|---|---|
| Quadrant | BADHDUFLAG | Total packets | Discarded packets |
| A | 0 | 68 | 0 |
| B | 0 | 68 | 0 |
| C | 0 | 68 | 0 |
| D | 0 | 68 | 0 |
| Mode M9 | |||
|---|---|---|---|
| Quadrant | BADHDUFLAG | Total packets | Discarded packets |
| A | 0 | 13 | 0 |
| B | 0 | 13 | 0 |
| C | 0 | 13 | 0 |
| D | 0 | 13 | 0 |
| Mode M0 | |||
|---|---|---|---|
| Quadrant | BADHDUFLAG | Total packets | Discarded packets |
| A | 0 | 7184 | 2 |
| B | 0 | 7881 | 1 |
| C | 0 | 7414 | 1 |
| D | 0 | 7254 | 1 |
| Quadrant | Total seconds | Saturated seconds | Saturation percentage |
|---|---|---|---|
| A | 3303 | 127 | 3.844989% |
| B | 3303 | 149 | 4.511051% |
| C | 3303 | 107 | 3.239479% |
| D | 3303 | 116 | 3.511959% |
Noise dominated data is calculated using 1-second bins in cleaned event files. If a bin has >2000 counts, and if more than 50% of those come from <1% of pixels, then it is considered to be noise-dominated and hence unusable.
| Quadrant | # 1 sec bins | Bins with >0 counts | Bins with >2000 counts | High rate bins dominated by noise | Noise dominated (total time) | Noise dominated (detector-on time) | Marked lightcurve |
|---|---|---|---|---|---|---|---|
| A | 4589 | 3304 | 1 | 1 | 0.02% | 0.03% | 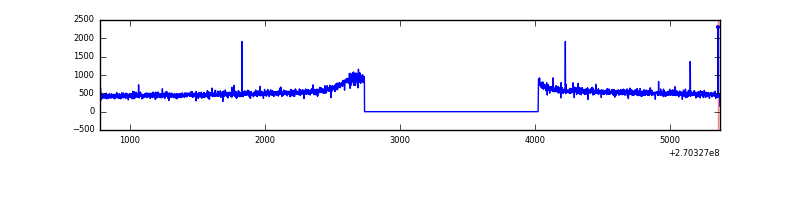 |
| B | 4589 | 3304 | 10 | 10 | 0.22% | 0.30% | 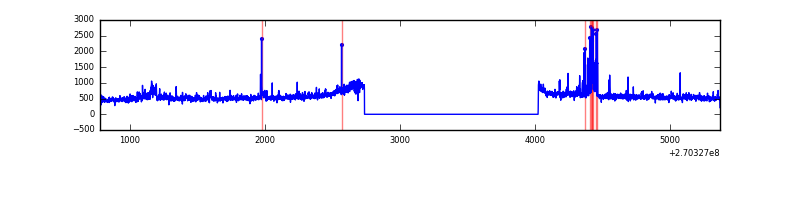 |
| C | 4589 | 3304 | 0 | 0 | 0.00% | 0.00% | 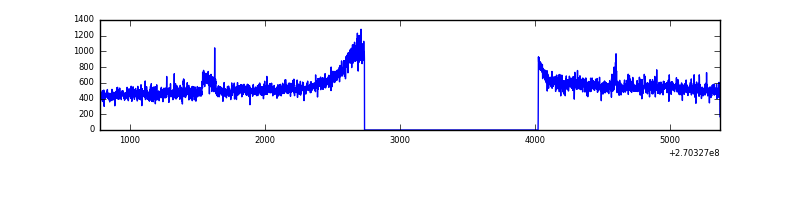 |
| D | 4589 | 3304 | 5 | 5 | 0.11% | 0.15% | 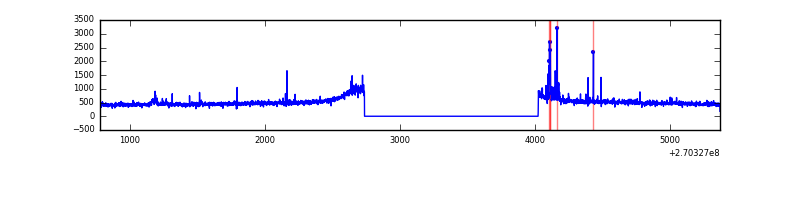 |
Top three noisy pixels from each quadrant. If the there are fewer than three noisy pixels in the level2.evt file, extra rows are filled as -1
| Pixel properties | Quadrant properties | ||||||
|---|---|---|---|---|---|---|---|
| Quadrant | DetID | PixID | Counts | Sigma | Mean | Median | Sigma |
| A | 9 | 143 | 6698 | 67.45 | 449 | 439 | 92.8 |
| A | 0 | 226 | 4080 | 39.24 | 449 | 439 | 92.8 |
| A | 12 | 189 | 3479 | 32.76 | 449 | 439 | 92.8 |
| B | 4 | 142 | 79223 | 907.36 | 446 | 436 | 86.8 |
| B | 10 | 16 | 59865 | 684.42 | 446 | 436 | 86.8 |
| B | 0 | 219 | 24608 | 278.38 | 446 | 436 | 86.8 |
| C | 3 | 233 | 134392 | 1307.78 | 433 | 436 | 102.4 |
| C | 4 | 238 | 4671 | 41.35 | 433 | 436 | 102.4 |
| C | 13 | 61 | 3139 | 26.39 | 433 | 436 | 102.4 |
| D | 10 | 70 | 38167 | 350.52 | 433 | 420 | 107.7 |
| D | 8 | 195 | 14411 | 129.92 | 433 | 420 | 107.7 |
| D | 2 | 234 | 12428 | 111.51 | 433 | 420 | 107.7 |
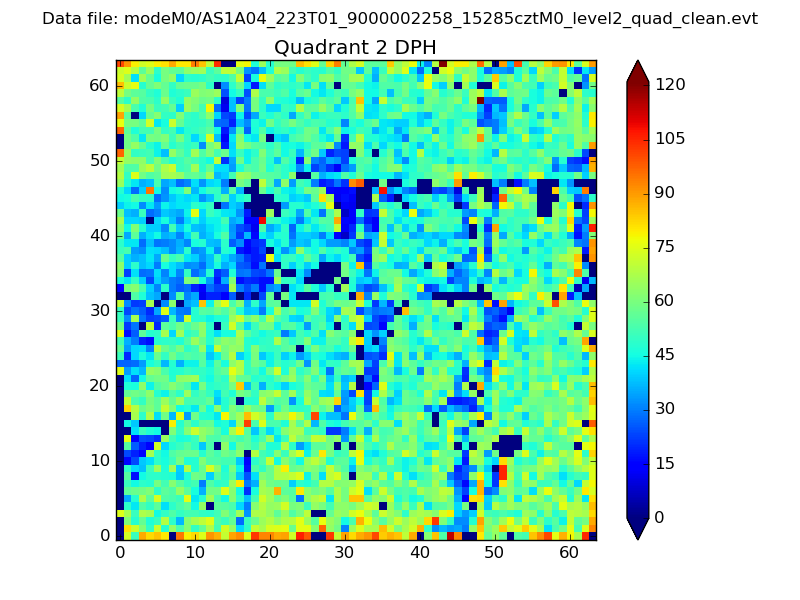
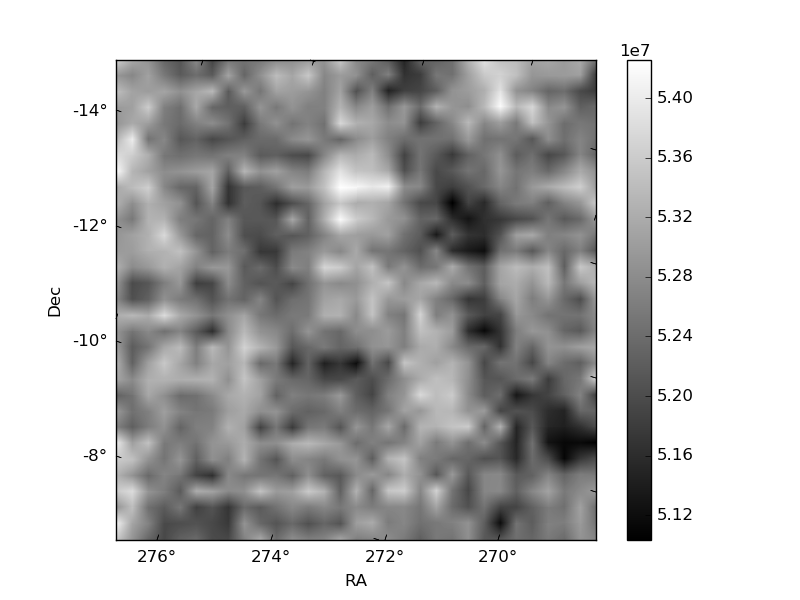
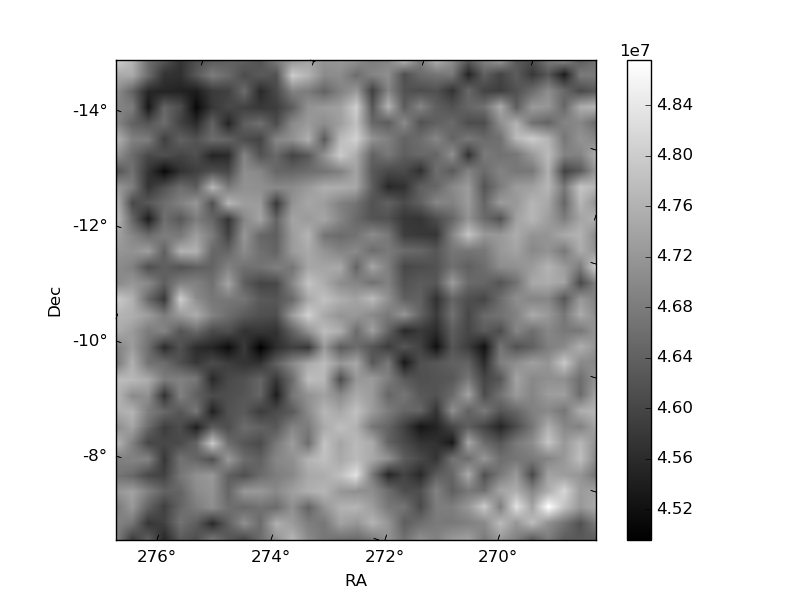
Histogram calculated using DETX and DETY for each event in the final _common_clean file
| Quadrant A | 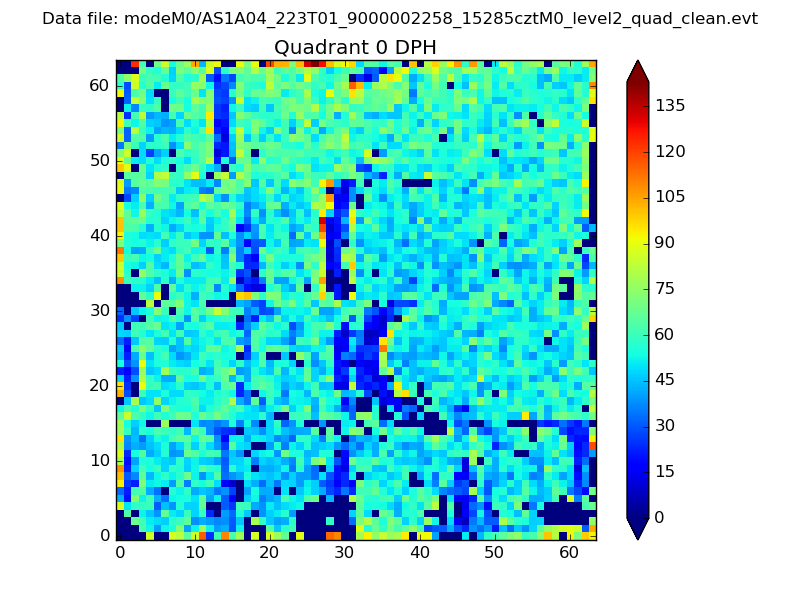 |
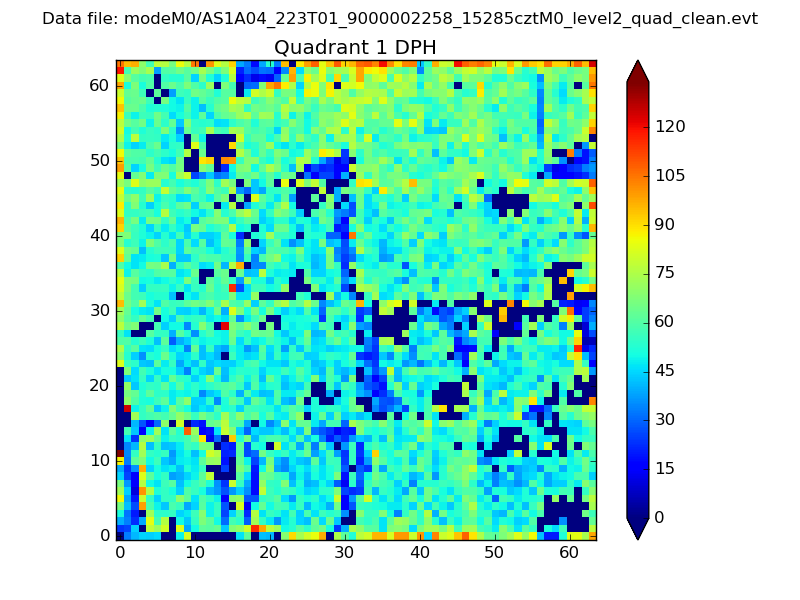 |
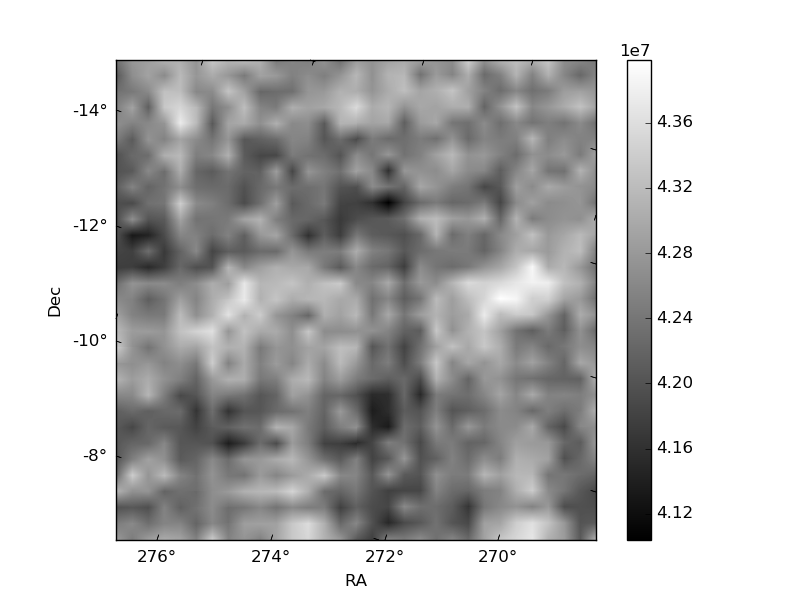
Quadrant B |
|---|---|---|---|
| Quadrant D | 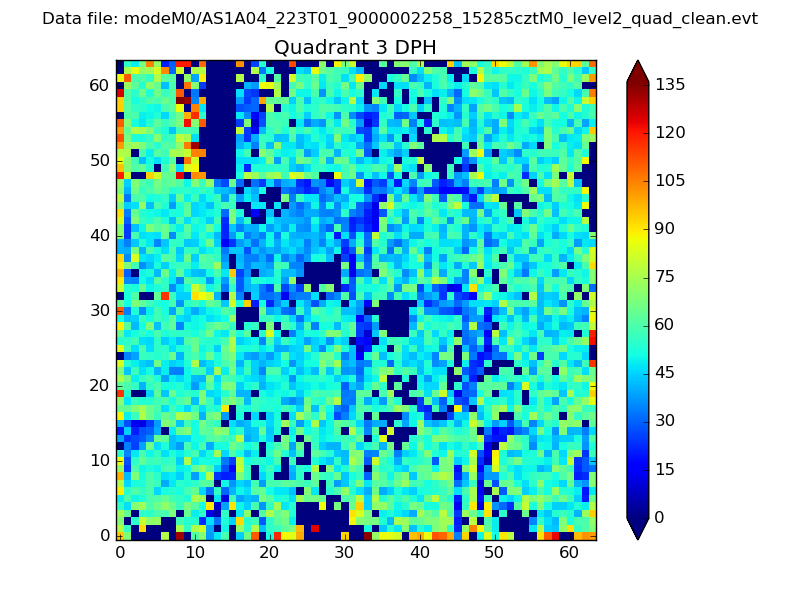 |
 |
Quadrant C |
| Plot type | Count rate plots | Images |
|---|---|---|
| Comparison with Poisson distribution Blue bars denote a histogram of data divided into 1 sec bins. Red curve is a Poisson curve with rate = median count rate of data. |
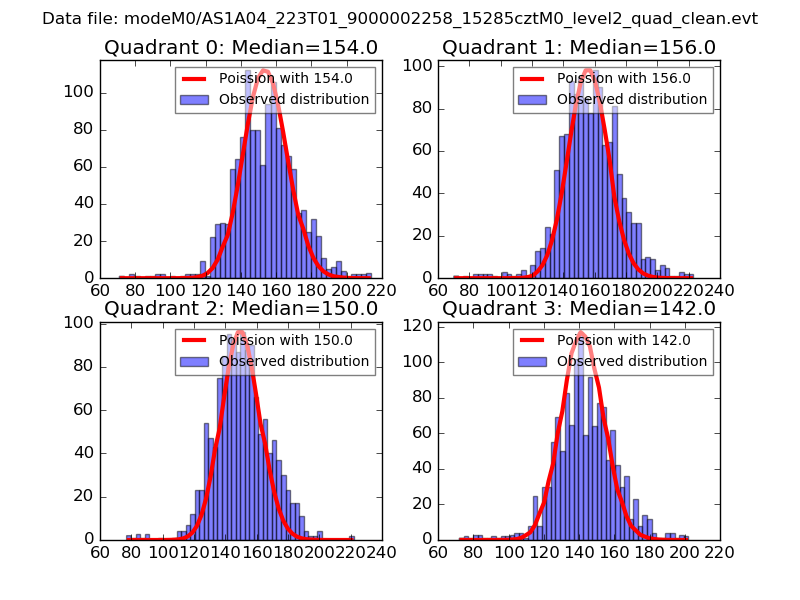 |
 |
| Quadrant-wise count rates Data is divided into 100 sec bins |
 |
|
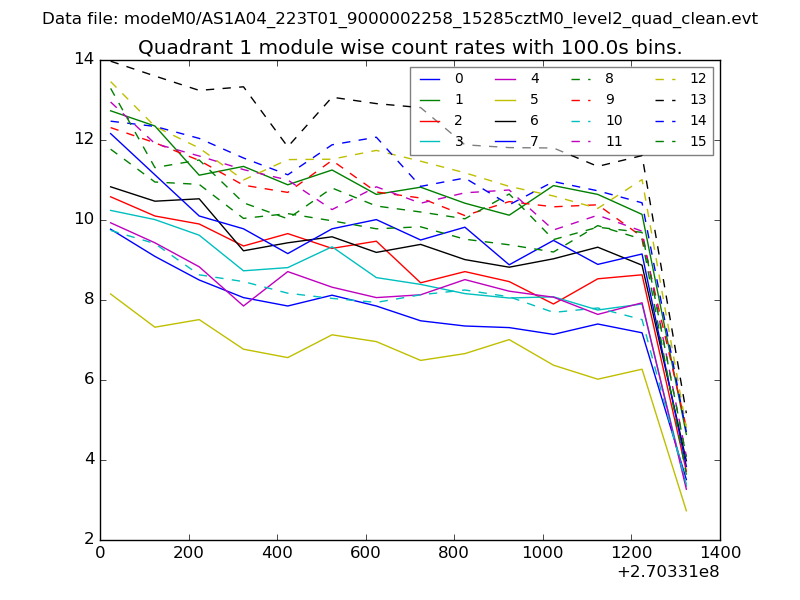
| Module-wise count rates for Quadrant A Data is divided into 100 sec bins |
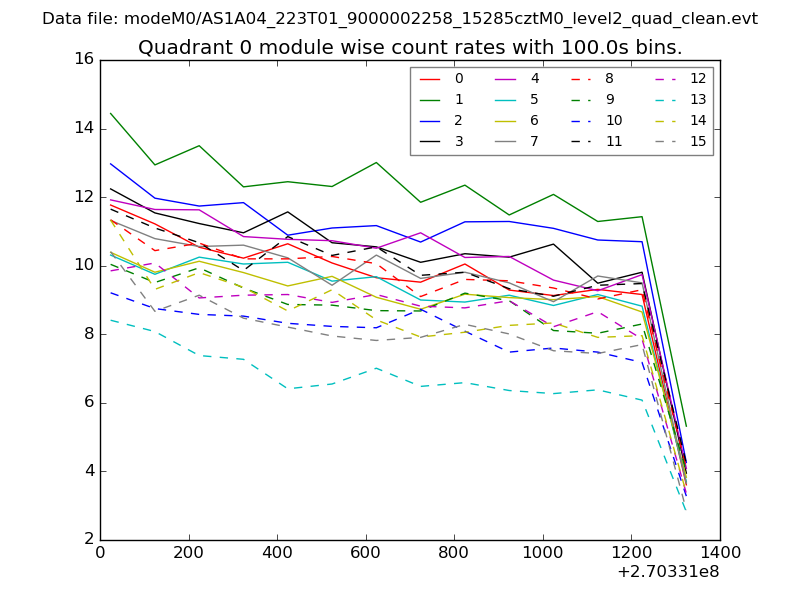 |
 |
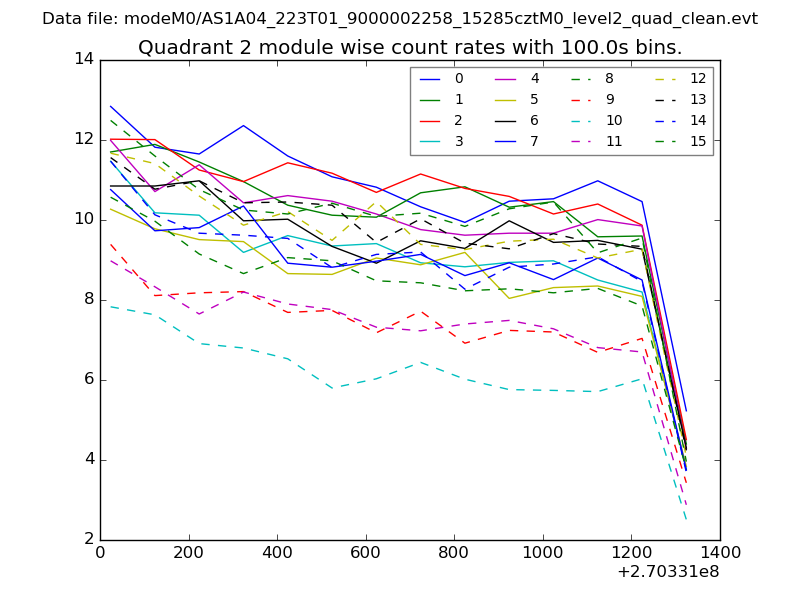
| Module-wise count rates for Quadrant B Data is divided into 100 sec bins |
 |
 |
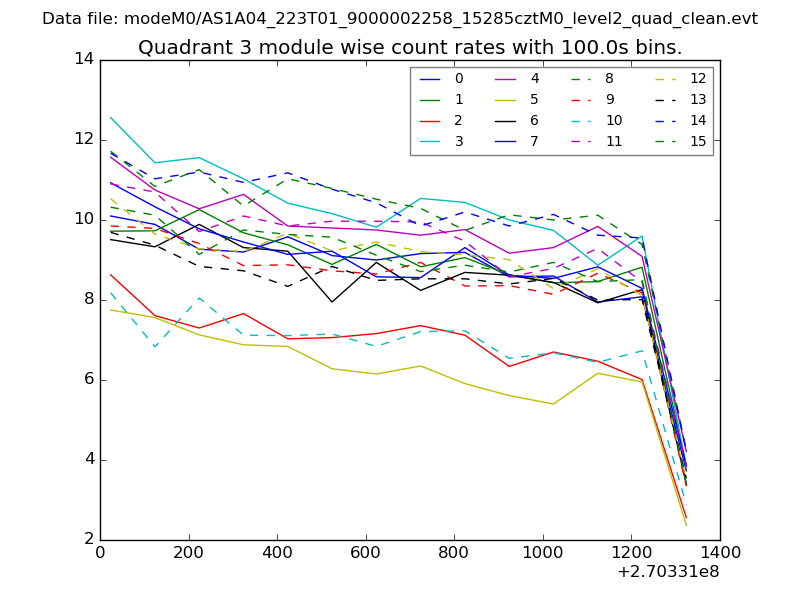
| Module-wise count rates for Quadrant C Data is divided into 100 sec bins |
 |
 |
| Module-wise count rates for Quadrant D Data is divided into 100 sec bins |
 |
 |
| Parameter | Plot |
|---|---|
| CZT HV Monitor | 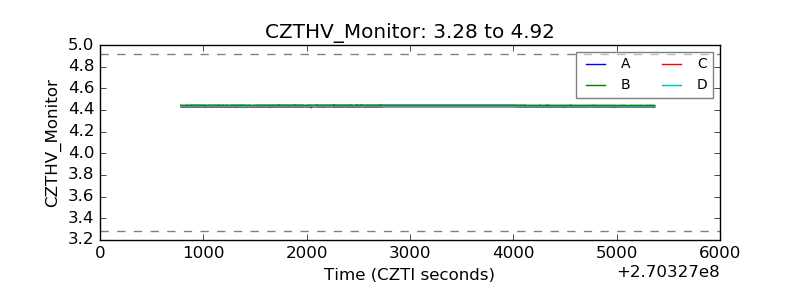 |
| D_VDD | 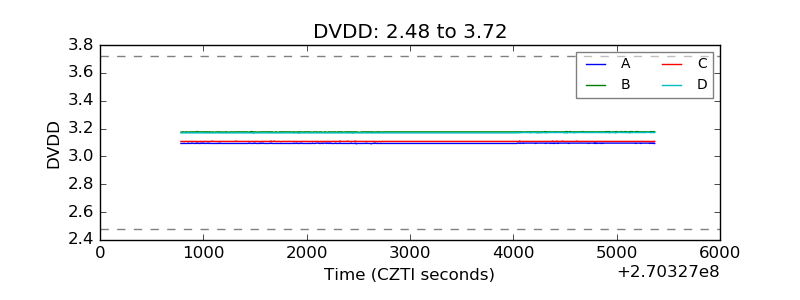 |
| Temperature 1 | 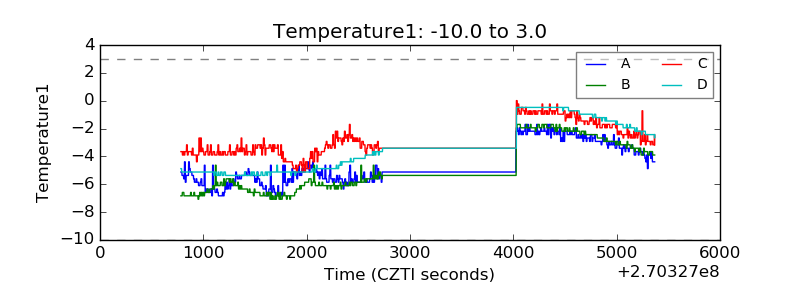 |
| Veto HV Monitor | 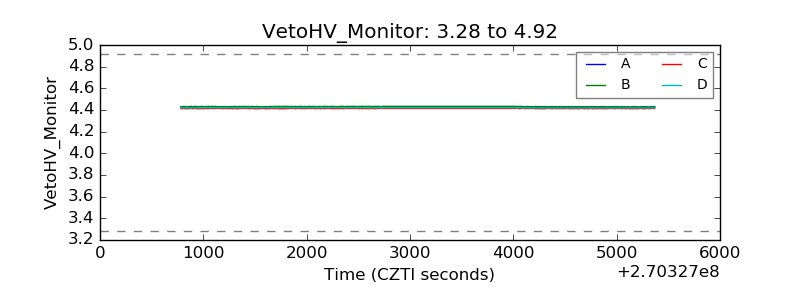 |
| Veto LLD | 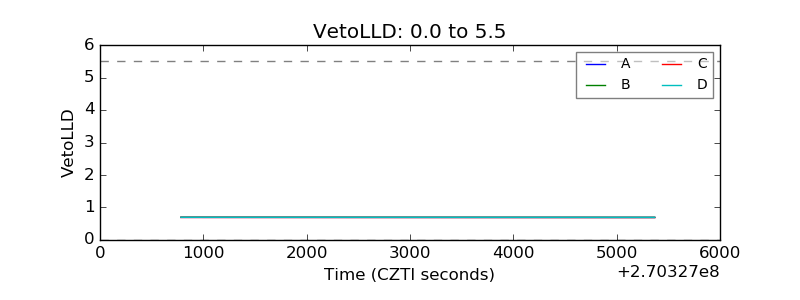 |
| Alpha Counter | 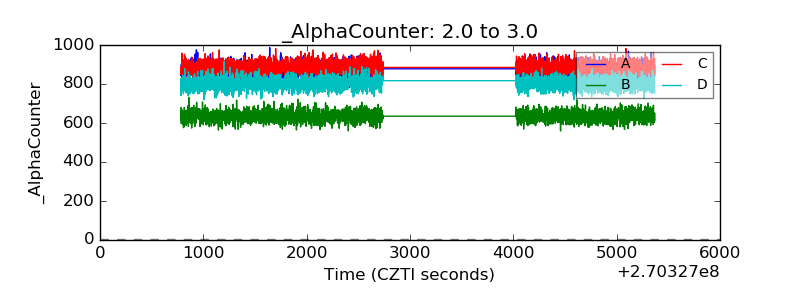 |
| _CPM_Rate | 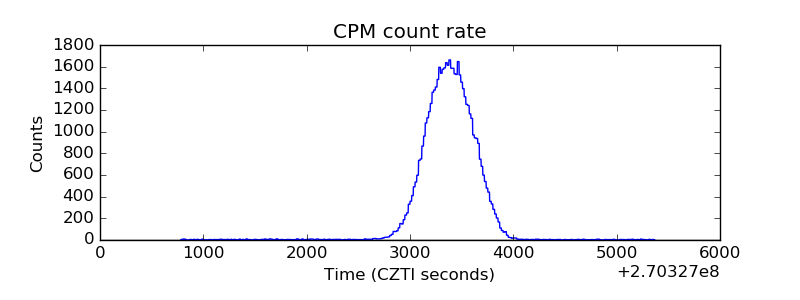 |
| CZT Counter | 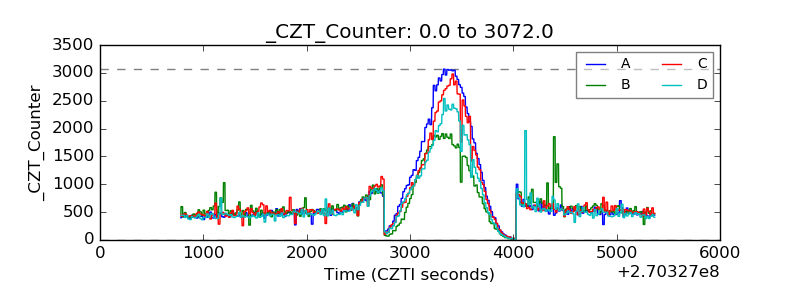 |
| +2.5 Volts monitor |  |
| +5 Volts monitor |  |
| _ROLL_ROT | 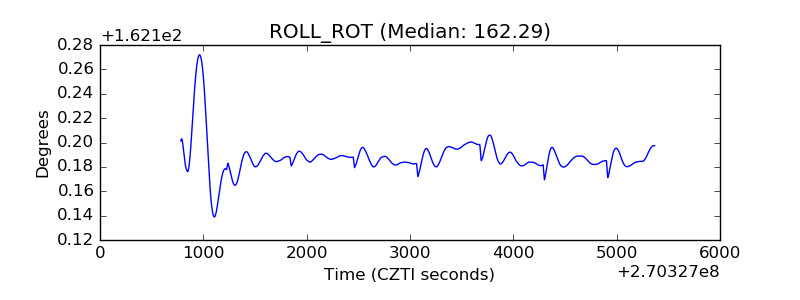 |
| _Roll_DEC | 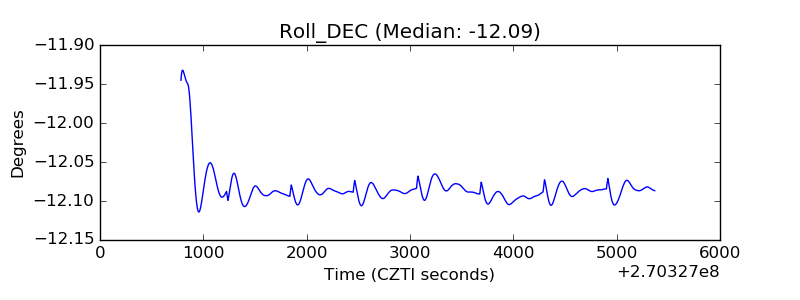 |
| _Roll_RA | 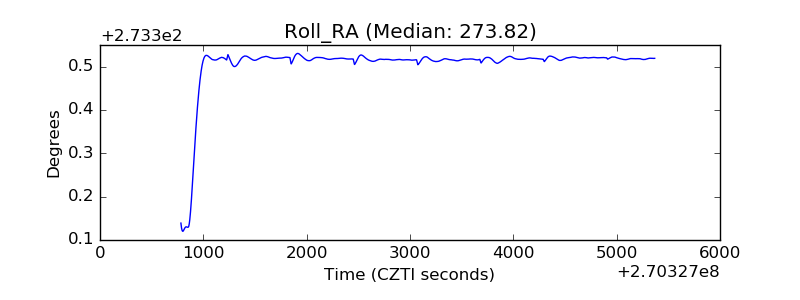 |
| Veto Counter | 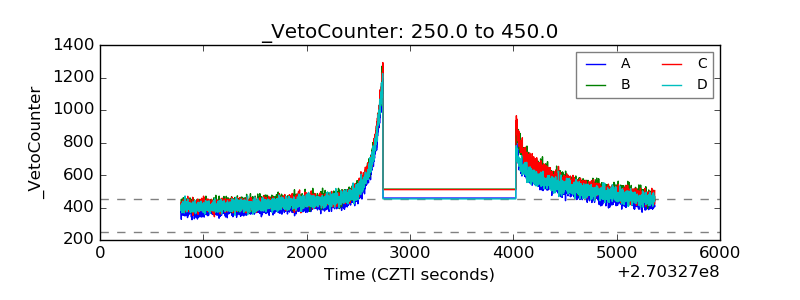 |