| Param | Original file | Final file |
|---|---|---|
| Filename | modeM0/AS1A04_223T01_9000002258_15286cztM0_level2.evt | modeM0/AS1A04_223T01_9000002258_15286cztM0_level2_quad_clean.evt |
| Size (bytes) | 454,680,000 | 90,406,080 |
| Size | 433.6 MB | 86.2 MB |
| Events in quadrant A | 3,132,178 | 587,558 |
| Events in quadrant B | 3,898,817 | 582,683 |
| Events in quadrant C | 3,252,898 | 577,086 |
| Events in quadrant D | 3,056,075 | 548,811 |
| Mode SS | |||
|---|---|---|---|
| Quadrant | BADHDUFLAG | Total packets | Discarded packets |
| A | 0 | 128 | 0 |
| B | 0 | 128 | 0 |
| C | 0 | 128 | 0 |
| D | 0 | 128 | 0 |
| Mode M9 | |||
|---|---|---|---|
| Quadrant | BADHDUFLAG | Total packets | Discarded packets |
| A | 0 | 20 | 0 |
| B | 0 | 20 | 0 |
| C | 0 | 20 | 0 |
| D | 0 | 21 | 0 |
| Mode M0 | |||
|---|---|---|---|
| Quadrant | BADHDUFLAG | Total packets | Discarded packets |
| A | 0 | 13421 | 3 |
| B | 0 | 15604 | 2 |
| C | 0 | 13615 | 2 |
| D | 0 | 13499 | 2 |
| Quadrant | Total seconds | Saturated seconds | Saturation percentage |
|---|---|---|---|
| A | 6330 | 74 | 1.169036% |
| B | 6330 | 305 | 4.818325% |
| C | 6330 | 47 | 0.742496% |
| D | 6330 | 56 | 0.884676% |
Noise dominated data is calculated using 1-second bins in cleaned event files. If a bin has >2000 counts, and if more than 50% of those come from <1% of pixels, then it is considered to be noise-dominated and hence unusable.
| Quadrant | # 1 sec bins | Bins with >0 counts | Bins with >2000 counts | High rate bins dominated by noise | Noise dominated (total time) | Noise dominated (detector-on time) | Marked lightcurve |
|---|---|---|---|---|---|---|---|
| A | 7566 | 6332 | 1 | 1 | 0.01% | 0.02% | 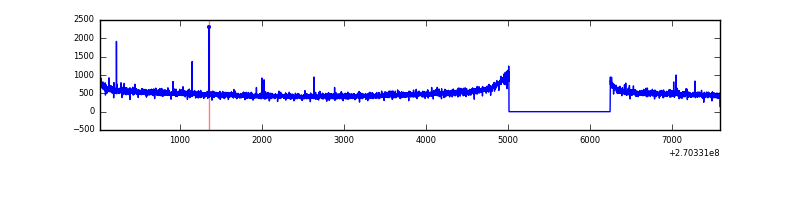 |
| B | 7566 | 6332 | 131 | 131 | 1.73% | 2.07% | 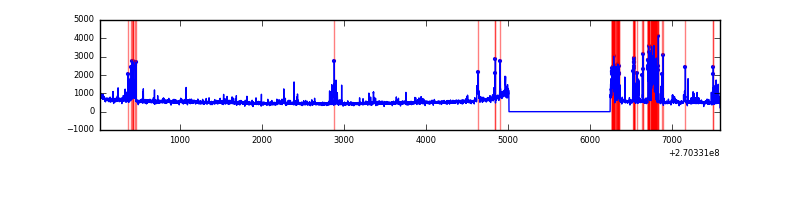 |
| C | 7566 | 6332 | 0 | 0 | 0.00% | 0.00% | 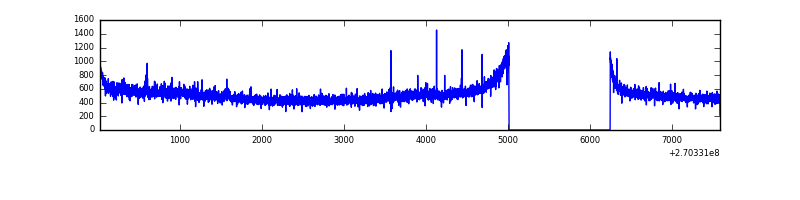 |
| D | 7566 | 6332 | 6 | 6 | 0.08% | 0.09% | 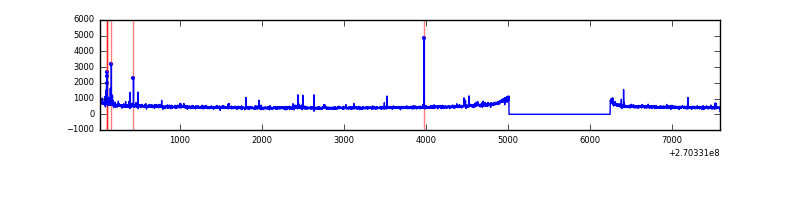 |
Top three noisy pixels from each quadrant. If the there are fewer than three noisy pixels in the level2.evt file, extra rows are filled as -1
| Pixel properties | Quadrant properties | ||||||
|---|---|---|---|---|---|---|---|
| Quadrant | DetID | PixID | Counts | Sigma | Mean | Median | Sigma |
| A | 9 | 143 | 12847 | 73.72 | 810 | 794 | 163.5 |
| A | 0 | 226 | 7252 | 39.5 | 810 | 794 | 163.5 |
| A | 12 | 194 | 6095 | 32.42 | 810 | 794 | 163.5 |
| B | 10 | 16 | 476951 | 3150.15 | 799 | 782 | 151.2 |
| B | 4 | 142 | 81977 | 537.15 | 799 | 782 | 151.2 |
| B | 0 | 219 | 57476 | 375.07 | 799 | 782 | 151.2 |
| C | 3 | 233 | 215144 | 1196.97 | 778 | 782 | 179.1 |
| C | 13 | 61 | 5513 | 26.42 | 778 | 782 | 179.1 |
| C | 14 | 234 | 3548 | 15.44 | 778 | 782 | 179.1 |
| D | 10 | 70 | 41642 | 214.35 | 779 | 757 | 190.7 |
| D | 2 | 33 | 26192 | 133.35 | 779 | 757 | 190.7 |
| D | 2 | 234 | 24276 | 123.3 | 779 | 757 | 190.7 |
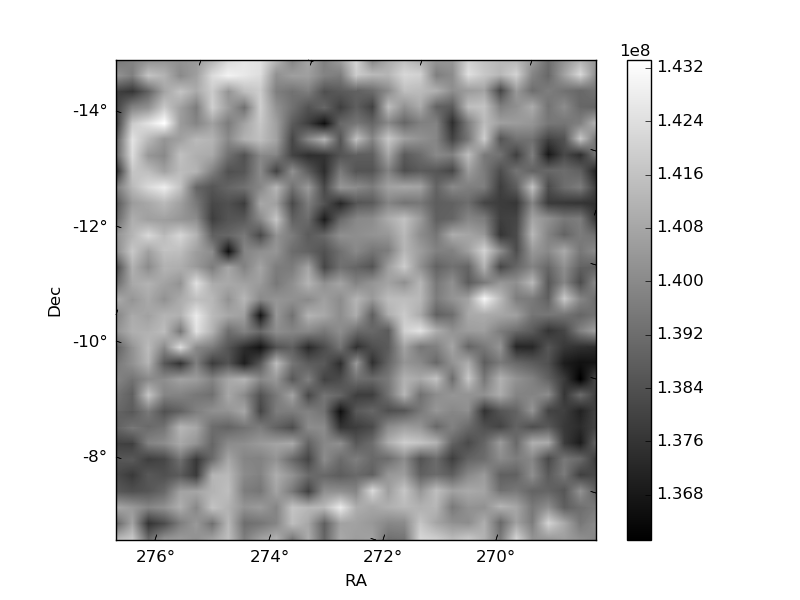
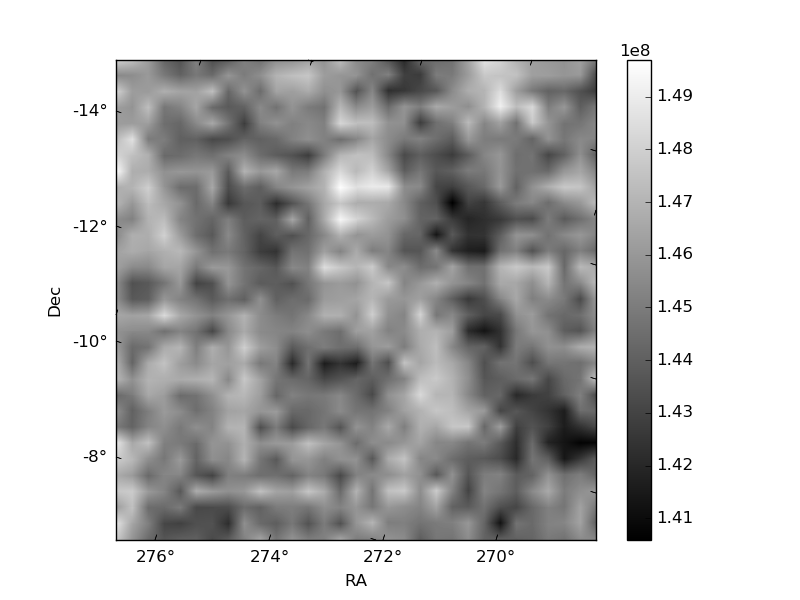
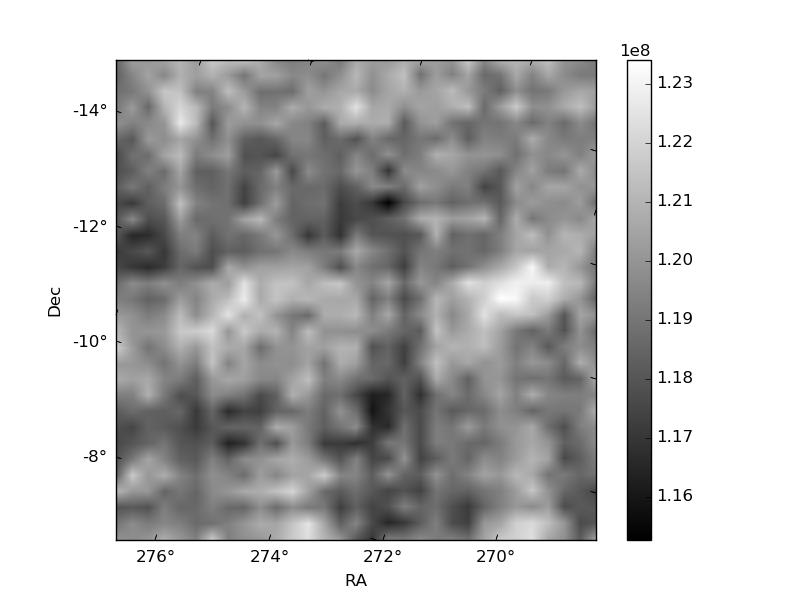
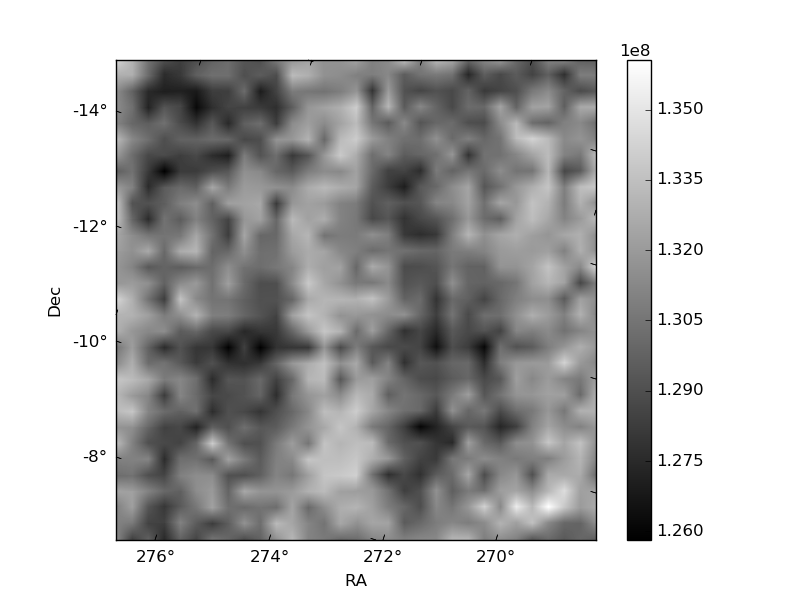
Histogram calculated using DETX and DETY for each event in the final _common_clean file
| Quadrant A | 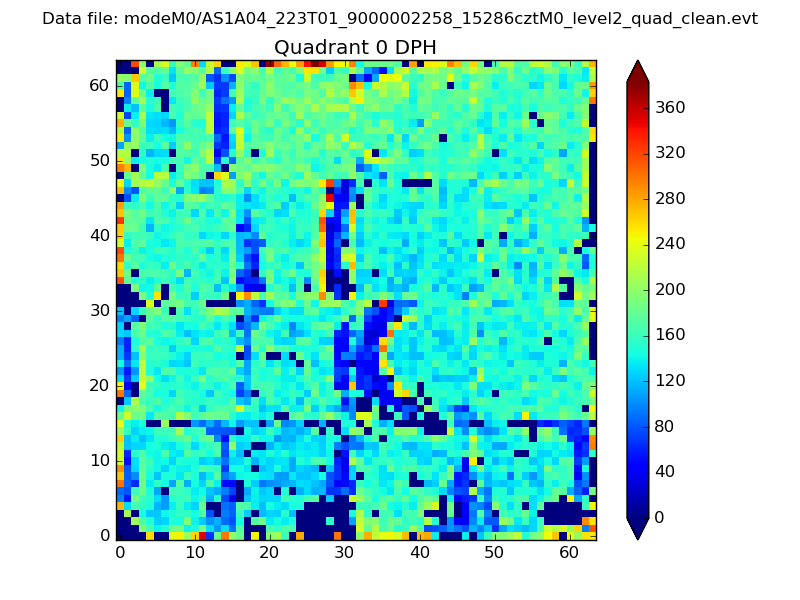 |
 |
Quadrant B |
|---|---|---|---|
| Quadrant D |  |
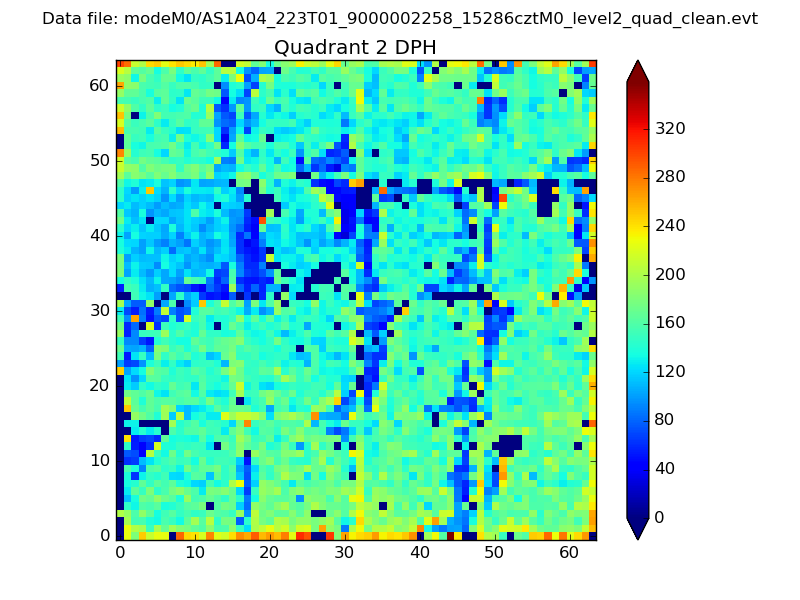 |
Quadrant C |
| Plot type | Count rate plots | Images |
|---|---|---|
| Comparison with Poisson distribution Blue bars denote a histogram of data divided into 1 sec bins. Red curve is a Poisson curve with rate = median count rate of data. |
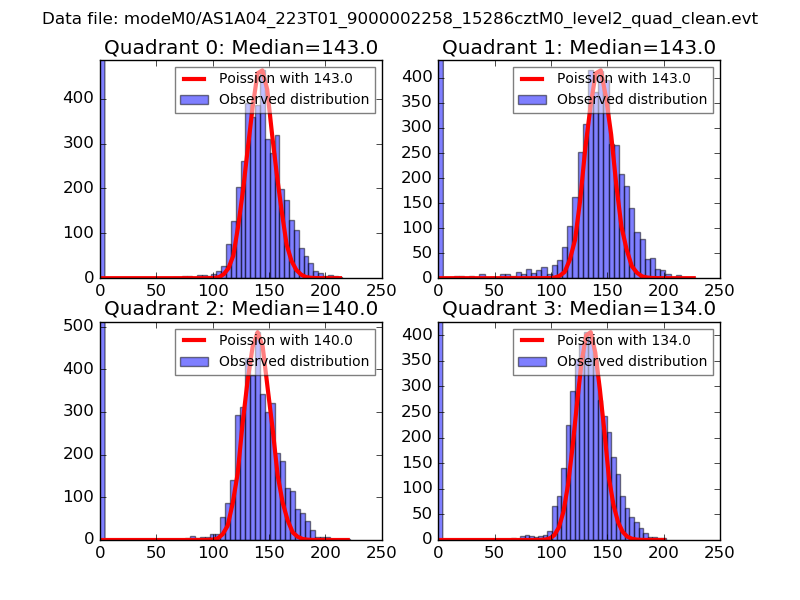 |
 |
| Quadrant-wise count rates Data is divided into 100 sec bins |
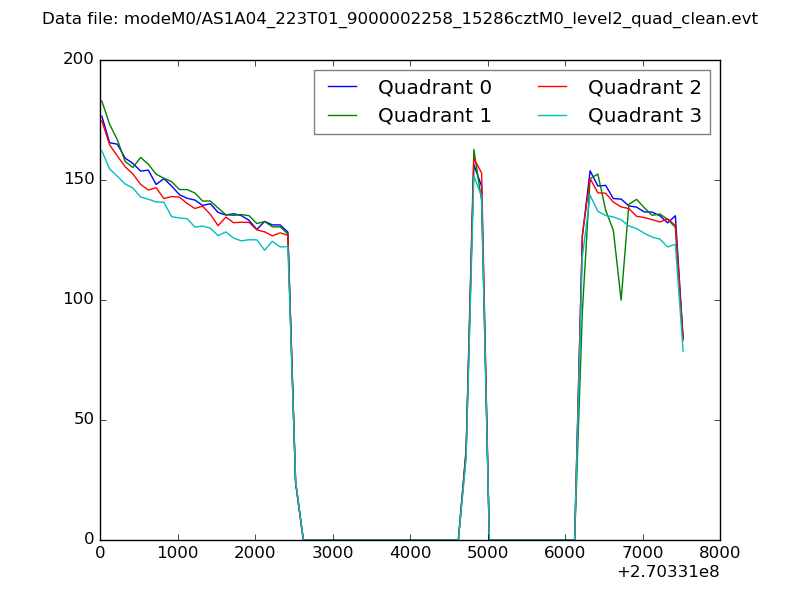 |
|
| Module-wise count rates for Quadrant A Data is divided into 100 sec bins |
 |
 |
| Module-wise count rates for Quadrant B Data is divided into 100 sec bins |
 |
 |
| Module-wise count rates for Quadrant C Data is divided into 100 sec bins |
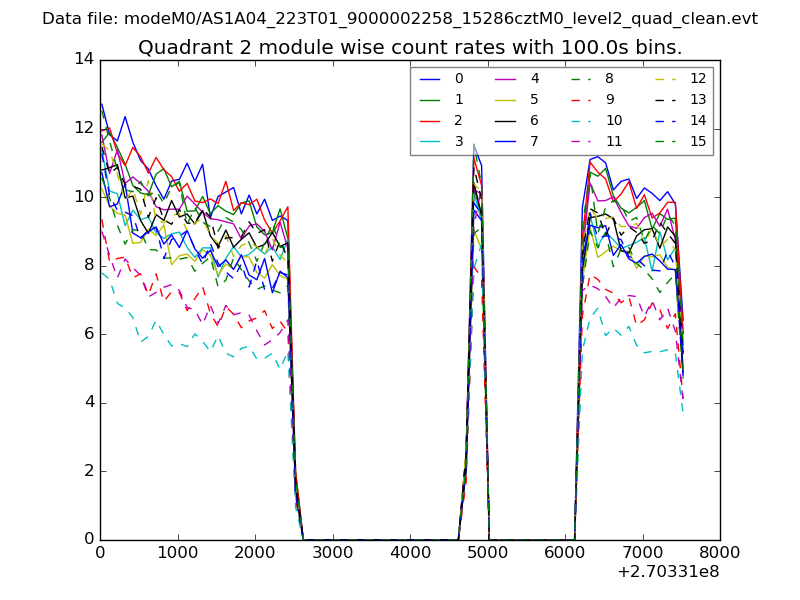 |
 |
| Module-wise count rates for Quadrant D Data is divided into 100 sec bins |
 |
 |
| Parameter | Plot |
|---|---|
| CZT HV Monitor | 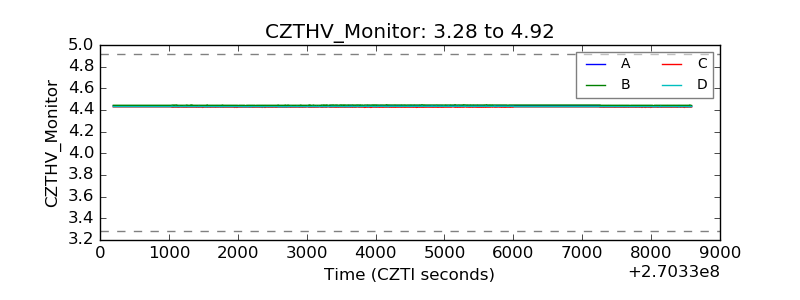 |
| D_VDD | 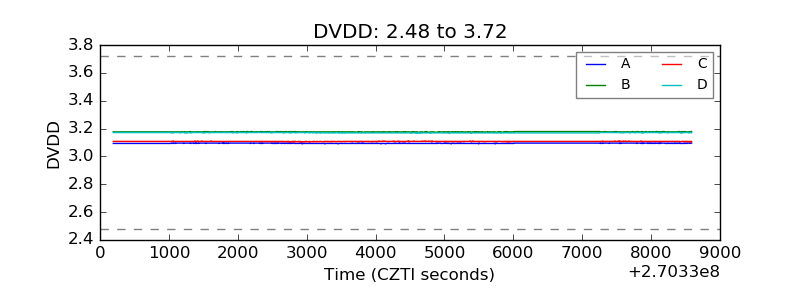 |
| Temperature 1 | 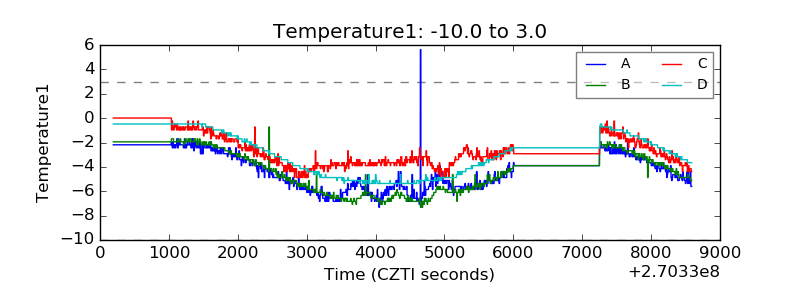 |
| Veto HV Monitor | 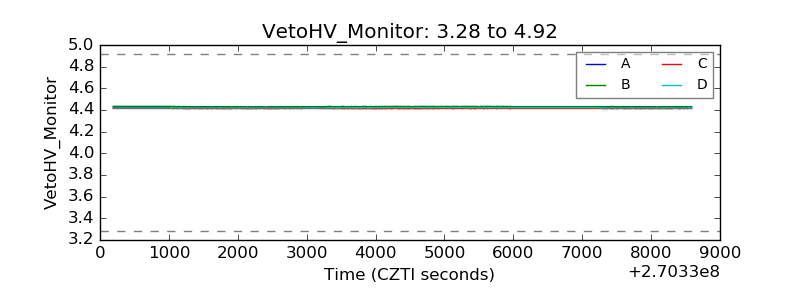 |
| Veto LLD | 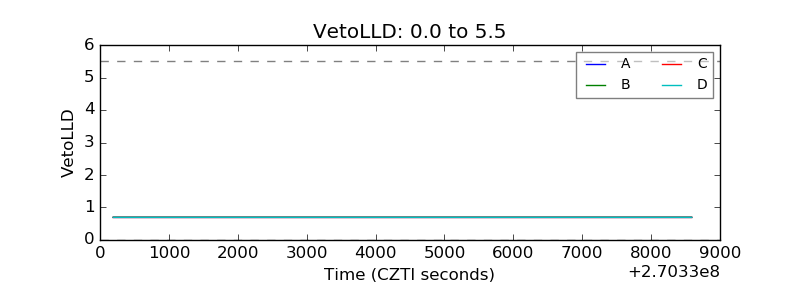 |
| Alpha Counter | 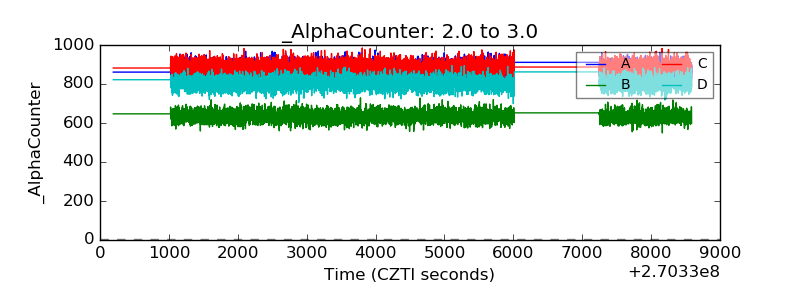 |
| _CPM_Rate | 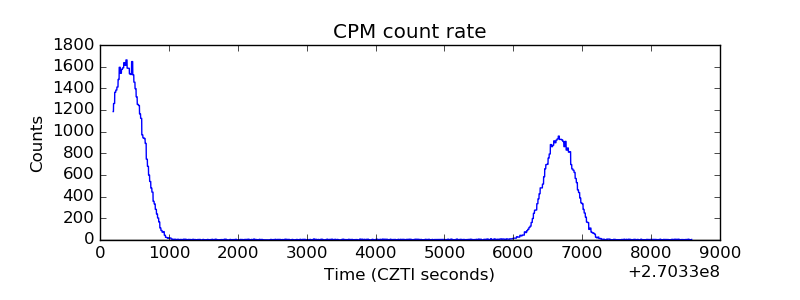 |
| CZT Counter | 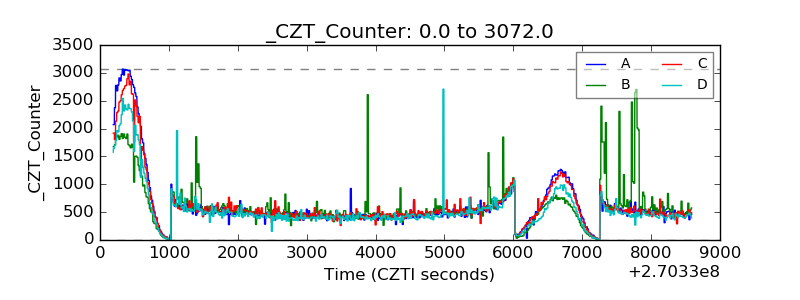 |
| +2.5 Volts monitor |  |
| +5 Volts monitor | 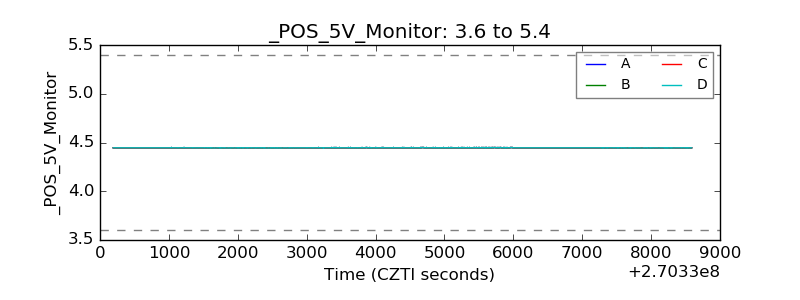 |
| _ROLL_ROT | 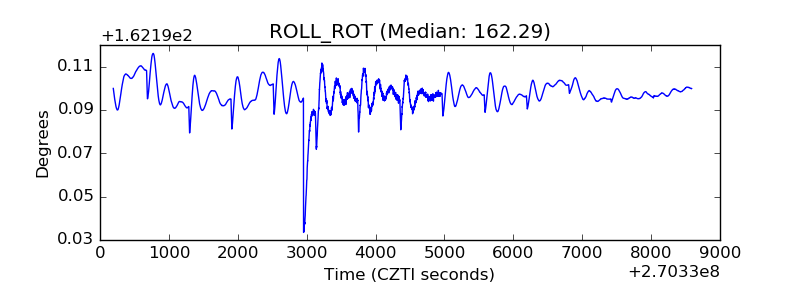 |
| _Roll_DEC | 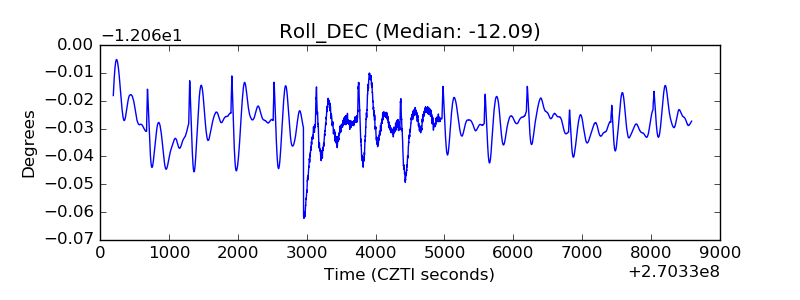 |
| _Roll_RA | 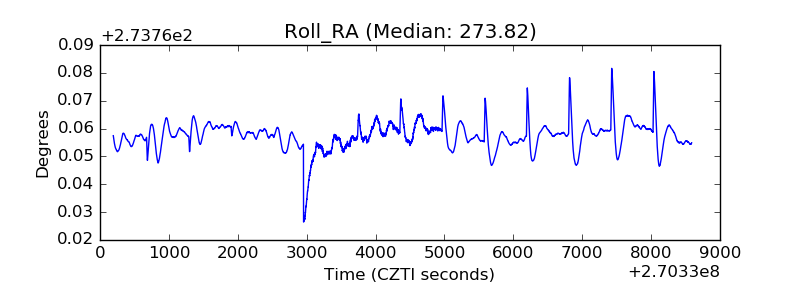 |
| Veto Counter | 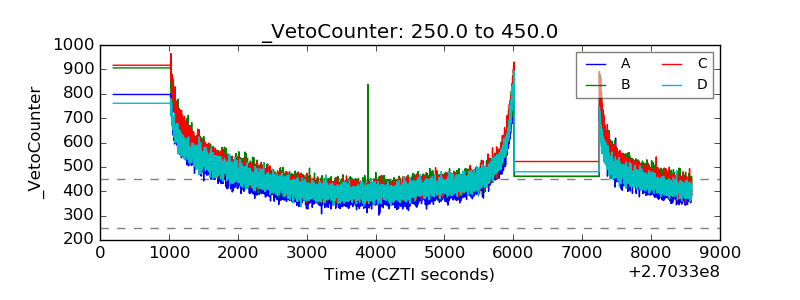 |