| Param | Original file | Final file |
|---|---|---|
| Filename | modeM0/AS1A04_223T01_9000002258_15287cztM0_level2.evt | modeM0/AS1A04_223T01_9000002258_15287cztM0_level2_quad_clean.evt |
| Size (bytes) | 478,975,680 | 91,247,040 |
| Size | 456.8 MB | 87.0 MB |
| Events in quadrant A | 3,143,216 | 588,470 |
| Events in quadrant B | 4,679,830 | 577,974 |
| Events in quadrant C | 3,196,341 | 583,380 |
| Events in quadrant D | 3,038,956 | 554,185 |
| Mode SS | |||
|---|---|---|---|
| Quadrant | BADHDUFLAG | Total packets | Discarded packets |
| A | 0 | 132 | 0 |
| B | 0 | 132 | 0 |
| C | 0 | 132 | 0 |
| D | 0 | 132 | 0 |
| Mode M9 | |||
|---|---|---|---|
| Quadrant | BADHDUFLAG | Total packets | Discarded packets |
| A | 0 | 14 | 0 |
| B | 0 | 14 | 0 |
| C | 0 | 14 | 0 |
| D | 0 | 15 | 0 |
| Mode M0 | |||
|---|---|---|---|
| Quadrant | BADHDUFLAG | Total packets | Discarded packets |
| A | 0 | 13739 | 3 |
| B | 0 | 18041 | 2 |
| C | 0 | 13757 | 2 |
| D | 0 | 13726 | 2 |
| Quadrant | Total seconds | Saturated seconds | Saturation percentage |
|---|---|---|---|
| A | 6589 | 38 | 0.576719% |
| B | 6589 | 536 | 8.134770% |
| C | 6589 | 18 | 0.273183% |
| D | 6589 | 31 | 0.470481% |
Noise dominated data is calculated using 1-second bins in cleaned event files. If a bin has >2000 counts, and if more than 50% of those come from <1% of pixels, then it is considered to be noise-dominated and hence unusable.
| Quadrant | # 1 sec bins | Bins with >0 counts | Bins with >2000 counts | High rate bins dominated by noise | Noise dominated (total time) | Noise dominated (detector-on time) | Marked lightcurve |
|---|---|---|---|---|---|---|---|
| A | 7615 | 6591 | 1 | 1 | 0.01% | 0.02% | 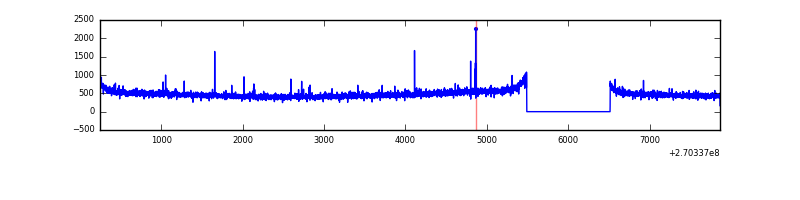 |
| B | 7615 | 6591 | 387 | 387 | 5.08% | 5.87% | 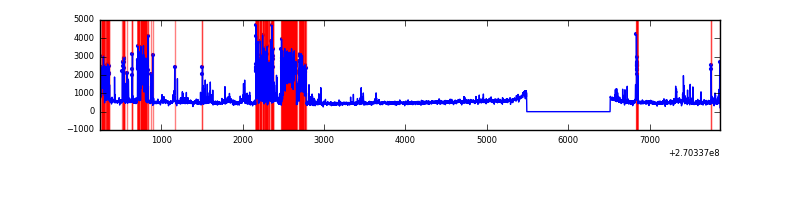 |
| C | 7615 | 6591 | 0 | 0 | 0.00% | 0.00% | 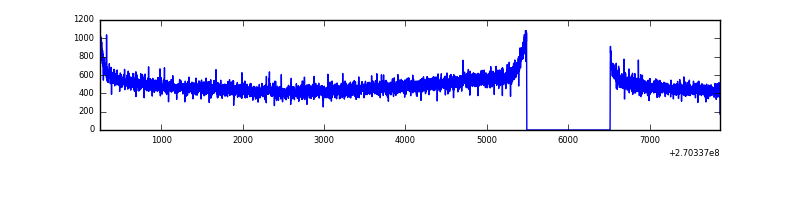 |
| D | 7615 | 6591 | 3 | 3 | 0.04% | 0.05% | 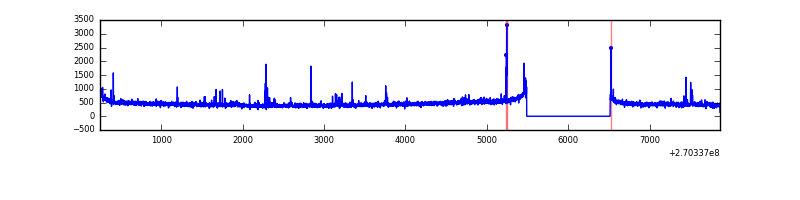 |
Top three noisy pixels from each quadrant. If the there are fewer than three noisy pixels in the level2.evt file, extra rows are filled as -1
| Pixel properties | Quadrant properties | ||||||
|---|---|---|---|---|---|---|---|
| Quadrant | DetID | PixID | Counts | Sigma | Mean | Median | Sigma |
| A | 9 | 143 | 19167 | 111.43 | 812 | 797 | 164.9 |
| A | 0 | 226 | 7263 | 39.22 | 812 | 797 | 164.9 |
| A | 12 | 194 | 6170 | 32.59 | 812 | 797 | 164.9 |
| B | 10 | 16 | 1231453 | 8175.56 | 788 | 769 | 150.5 |
| B | 3 | 64 | 78945 | 519.33 | 788 | 769 | 150.5 |
| B | 0 | 219 | 52280 | 342.19 | 788 | 769 | 150.5 |
| C | 3 | 233 | 145659 | 803.73 | 780 | 784 | 180.3 |
| C | 4 | 238 | 7151 | 35.32 | 780 | 784 | 180.3 |
| C | 13 | 61 | 5546 | 26.42 | 780 | 784 | 180.3 |
| D | 2 | 234 | 25780 | 131.7 | 777 | 754 | 190.0 |
| D | 10 | 70 | 20694 | 104.94 | 777 | 754 | 190.0 |
| D | 2 | 152 | 19486 | 98.58 | 777 | 754 | 190.0 |
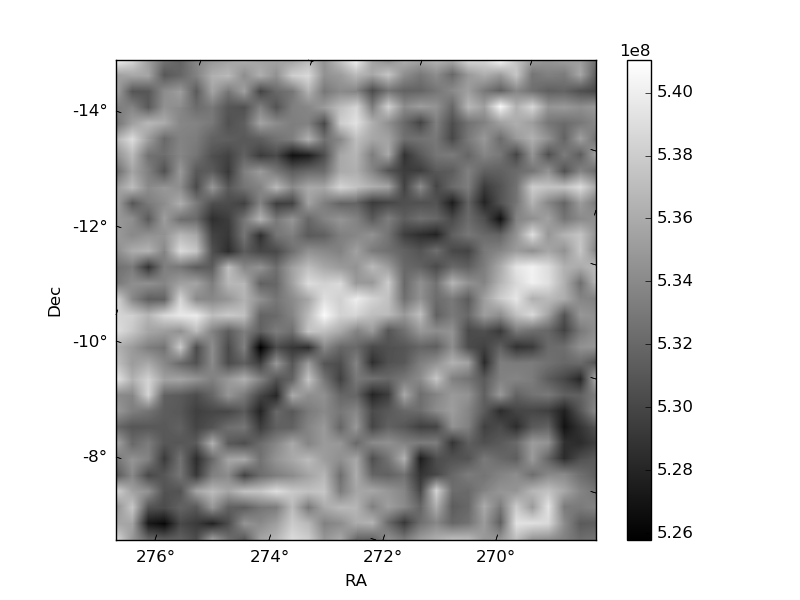
Histogram calculated using DETX and DETY for each event in the final _common_clean file
| Quadrant A | 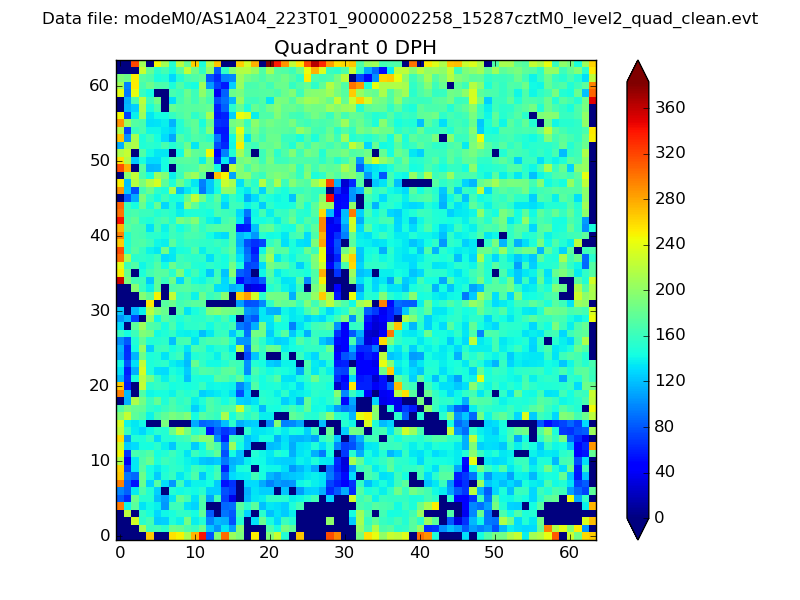 |
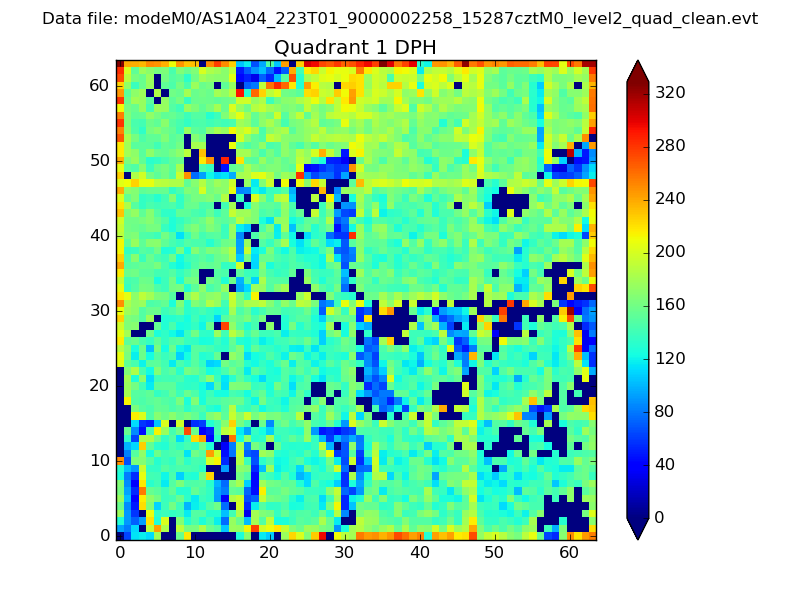 |
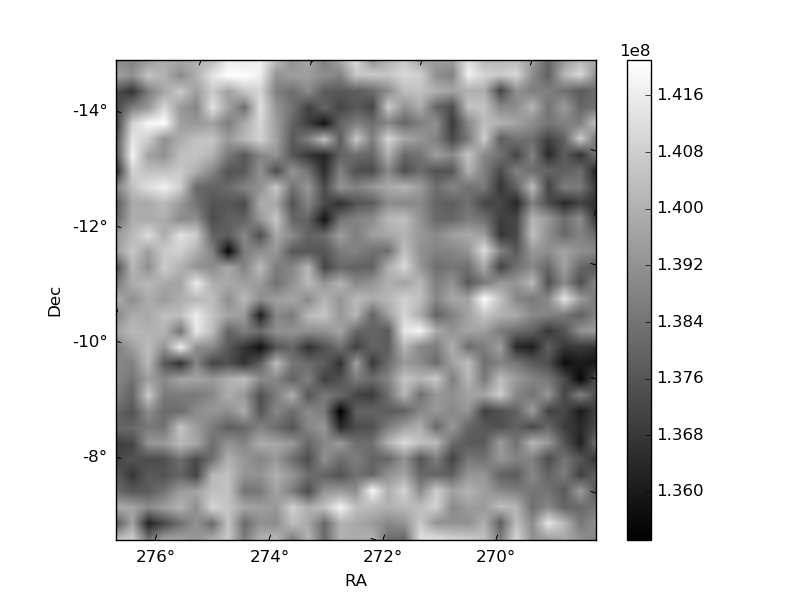
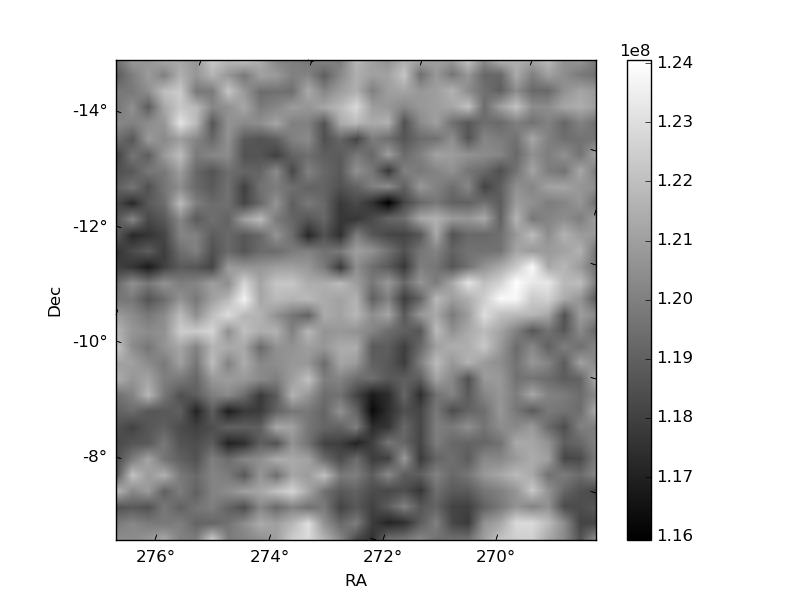
Quadrant B |
|---|---|---|---|
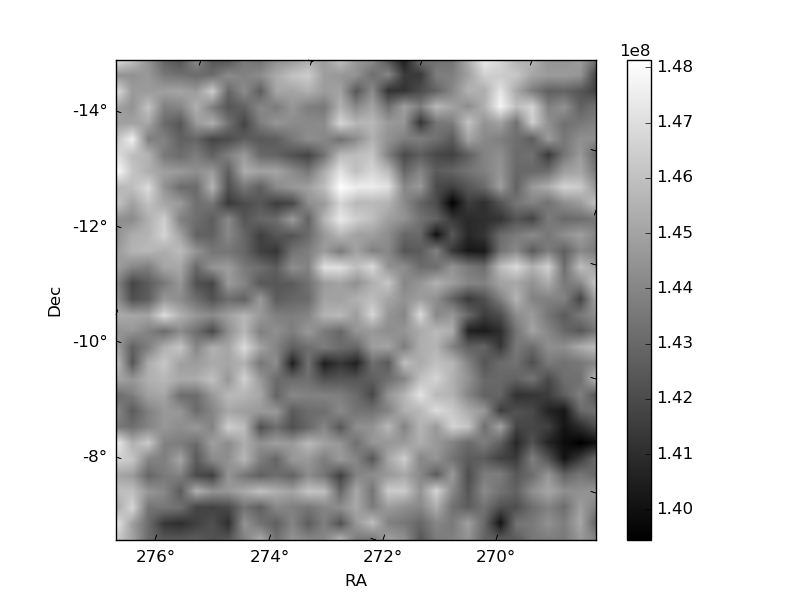
| Quadrant D | 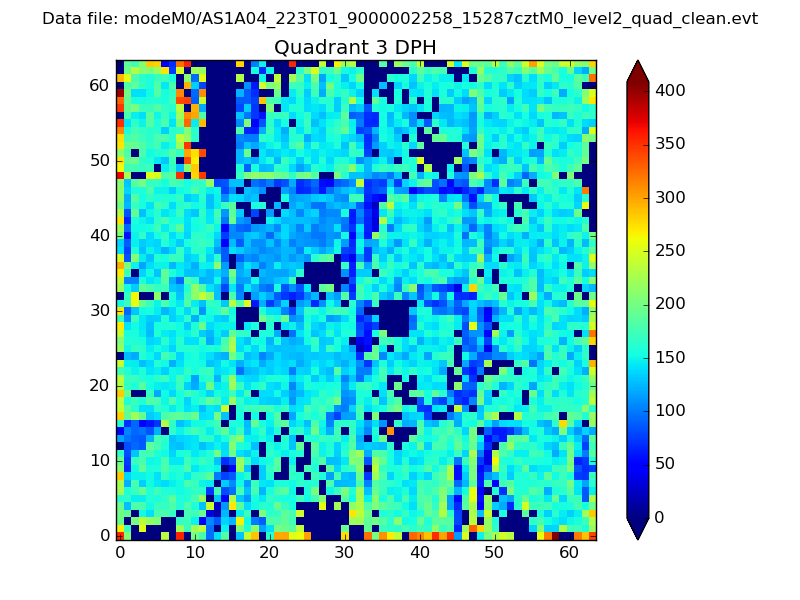 |
 |
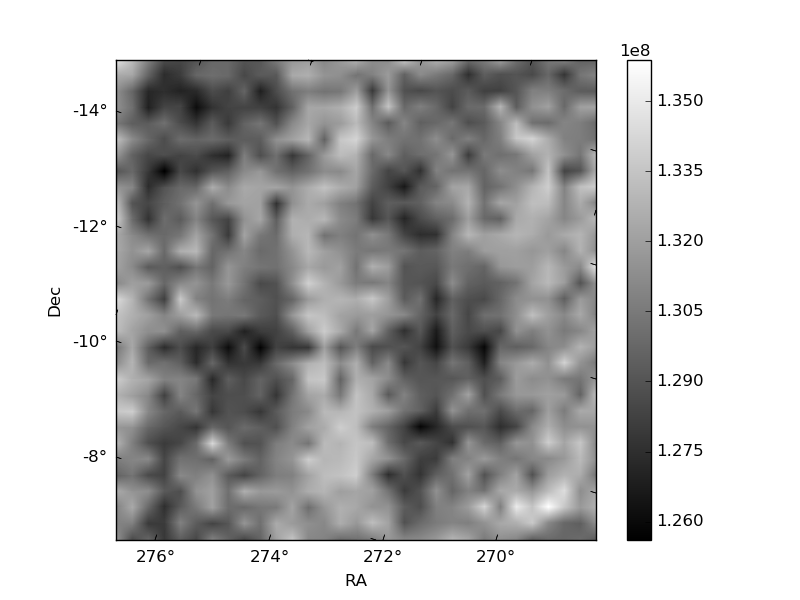
Quadrant C |
| Plot type | Count rate plots | Images |
|---|---|---|
| Comparison with Poisson distribution Blue bars denote a histogram of data divided into 1 sec bins. Red curve is a Poisson curve with rate = median count rate of data. |
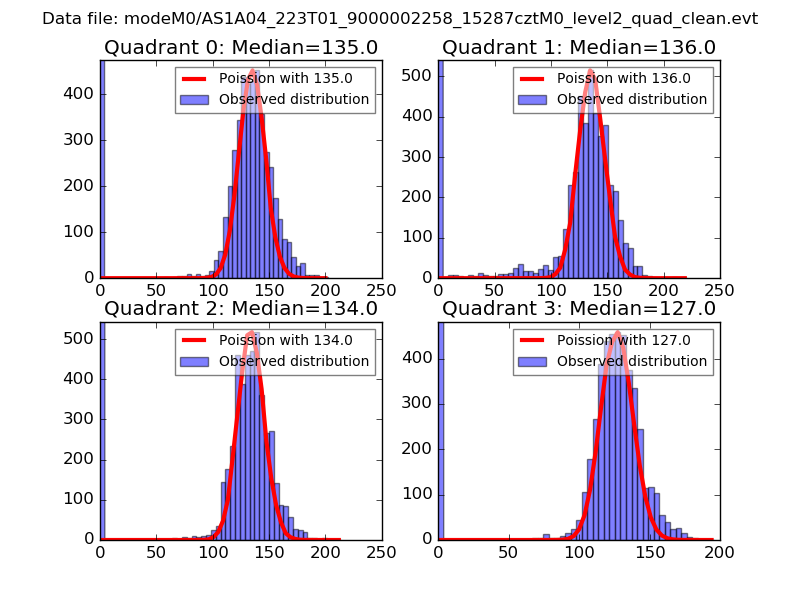 |
 |
| Quadrant-wise count rates Data is divided into 100 sec bins |
 |
|
| Module-wise count rates for Quadrant A Data is divided into 100 sec bins |
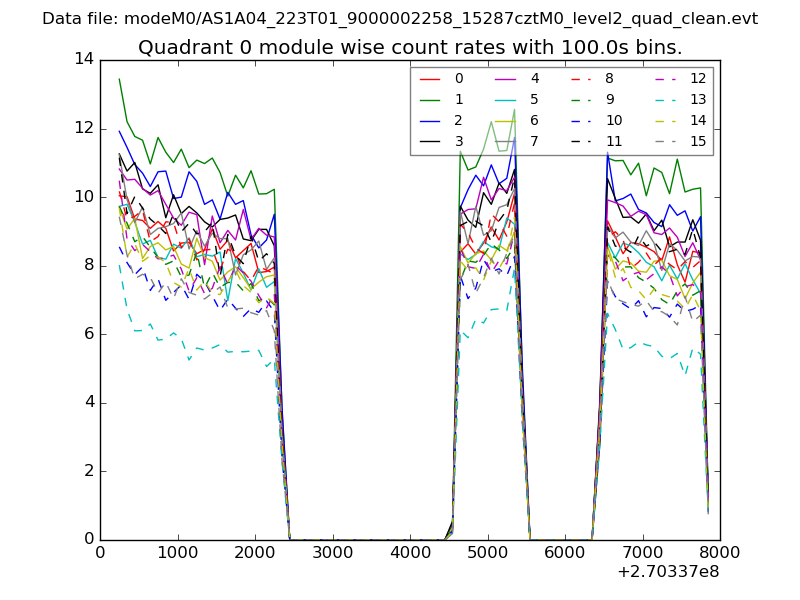 |
 |
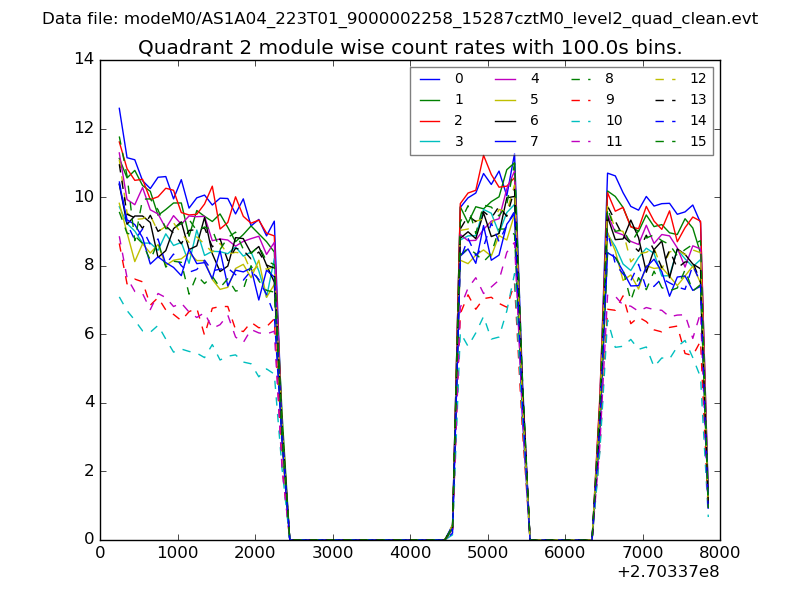
| Module-wise count rates for Quadrant B Data is divided into 100 sec bins |
 |
 |
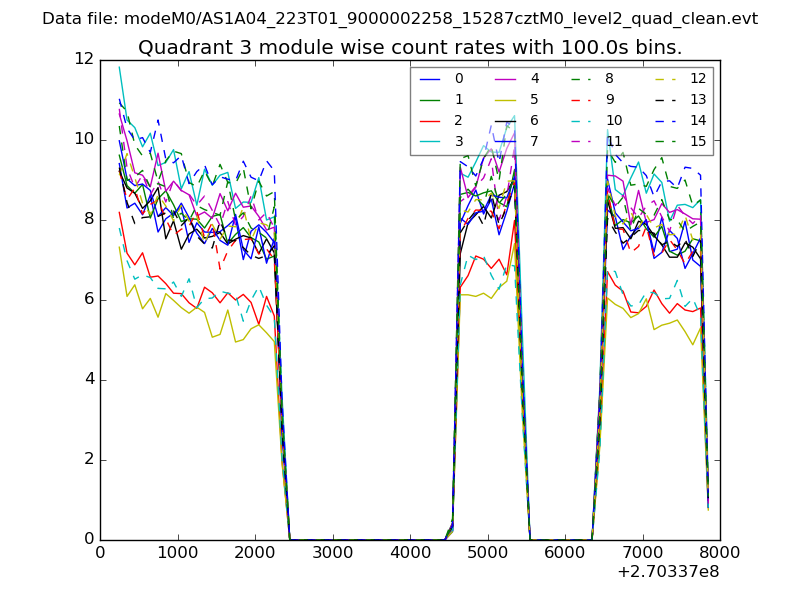
| Module-wise count rates for Quadrant C Data is divided into 100 sec bins |
 |
 |
| Module-wise count rates for Quadrant D Data is divided into 100 sec bins |
 |
 |
| Parameter | Plot |
|---|---|
| CZT HV Monitor | 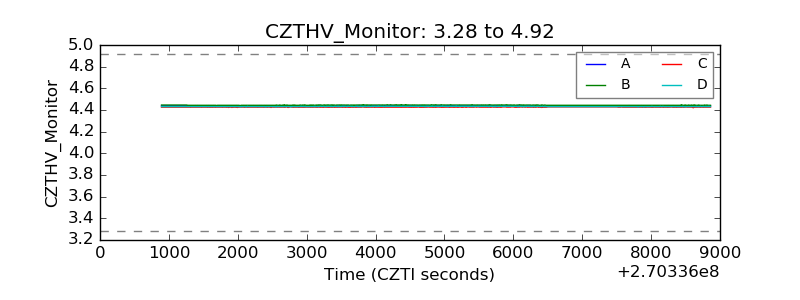 |
| D_VDD | 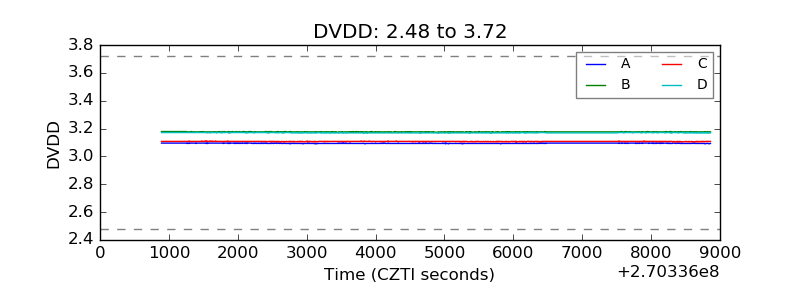 |
| Temperature 1 | 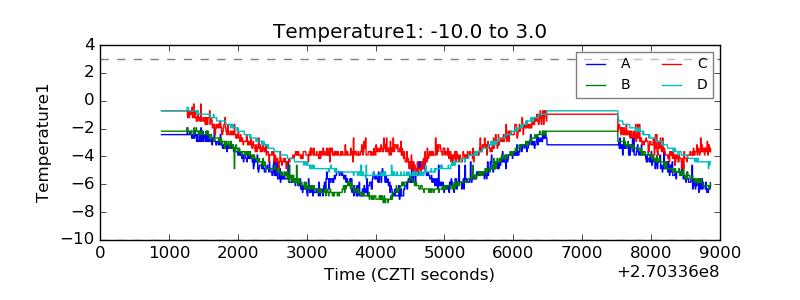 |
| Veto HV Monitor | 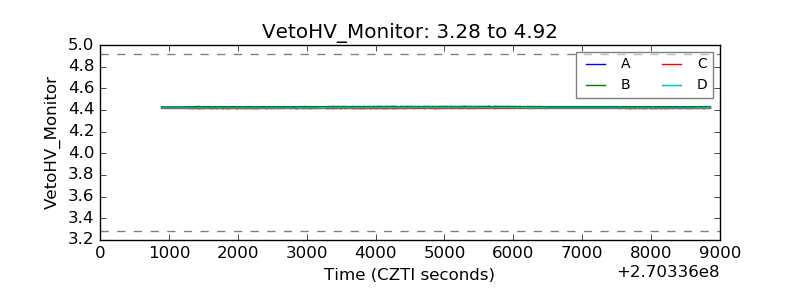 |
| Veto LLD | 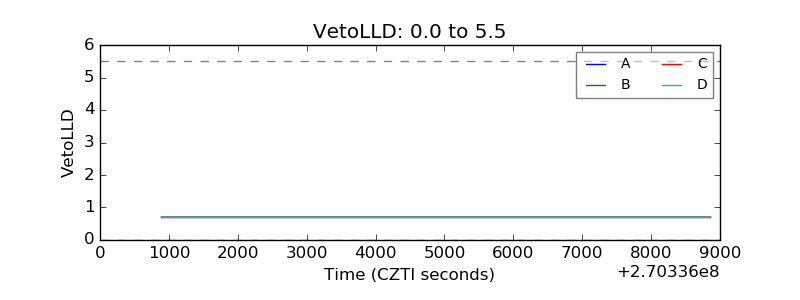 |
| Alpha Counter | 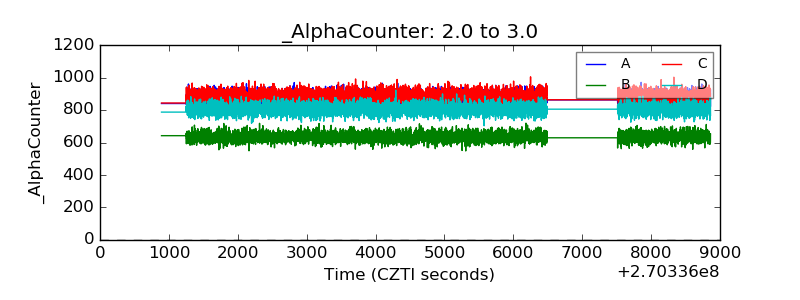 |
| _CPM_Rate | 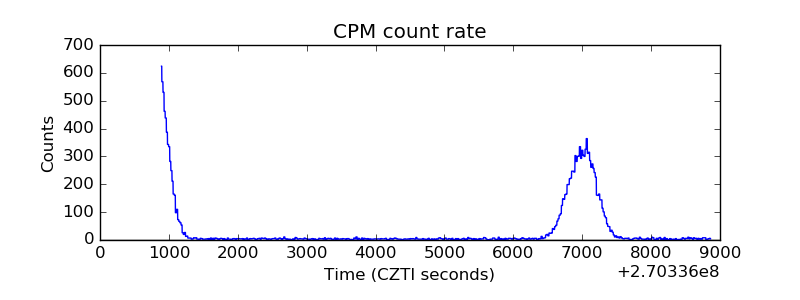 |
| CZT Counter | 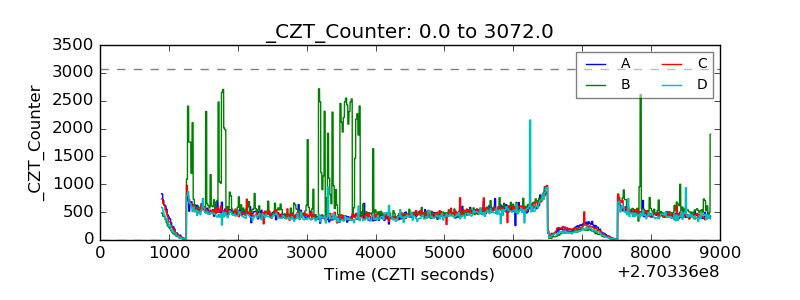 |
| +2.5 Volts monitor |  |
| +5 Volts monitor |  |
| _ROLL_ROT |  |
| _Roll_DEC | 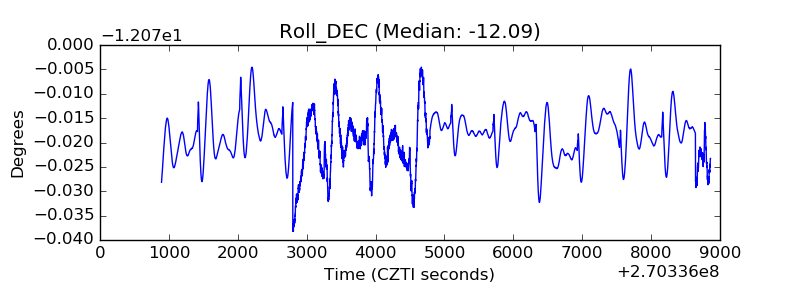 |
| _Roll_RA | 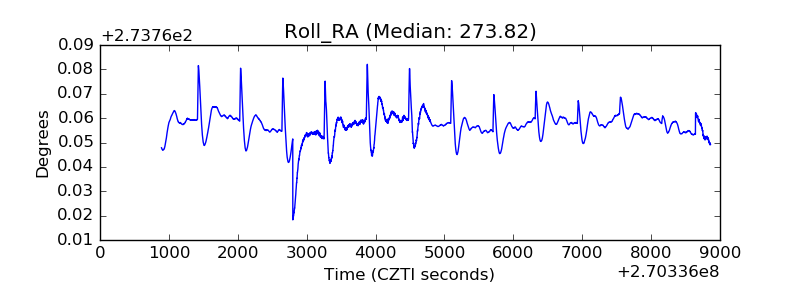 |
| Veto Counter | 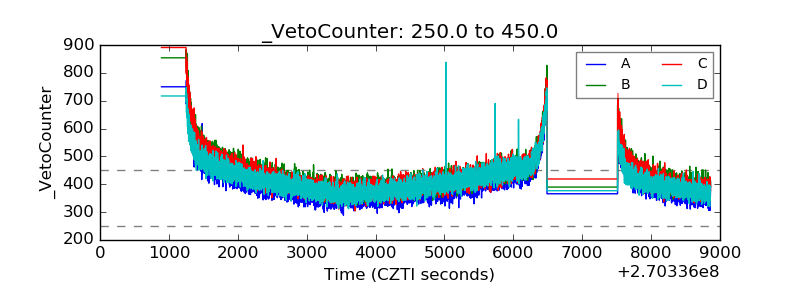 |