| Param | Original file | Final file |
|---|---|---|
| Filename | modeM0/AS1A04_223T01_9000002258_15288cztM0_level2.evt | modeM0/AS1A04_223T01_9000002258_15288cztM0_level2_quad_clean.evt |
| Size (bytes) | 493,986,240 | 100,955,520 |
| Size | 471.1 MB | 96.3 MB |
| Events in quadrant A | 3,433,100 | 645,154 |
| Events in quadrant B | 4,081,575 | 652,067 |
| Events in quadrant C | 3,591,825 | 642,164 |
| Events in quadrant D | 3,360,230 | 612,127 |
| Mode SS | |||
|---|---|---|---|
| Quadrant | BADHDUFLAG | Total packets | Discarded packets |
| A | 0 | 148 | 0 |
| B | 0 | 148 | 0 |
| C | 0 | 148 | 0 |
| D | 0 | 148 | 0 |
| Mode M9 | |||
|---|---|---|---|
| Quadrant | BADHDUFLAG | Total packets | Discarded packets |
| A | 0 | 17 | 0 |
| B | 0 | 17 | 0 |
| C | 0 | 17 | 0 |
| D | 0 | 17 | 0 |
| Mode M0 | |||
|---|---|---|---|
| Quadrant | BADHDUFLAG | Total packets | Discarded packets |
| A | 0 | 15111 | 3 |
| B | 0 | 16815 | 2 |
| C | 0 | 15459 | 2 |
| D | 0 | 15173 | 2 |
| Quadrant | Total seconds | Saturated seconds | Saturation percentage |
|---|---|---|---|
| A | 7272 | 42 | 0.577558% |
| B | 7272 | 117 | 1.608911% |
| C | 7272 | 29 | 0.398790% |
| D | 7272 | 37 | 0.508801% |
Noise dominated data is calculated using 1-second bins in cleaned event files. If a bin has >2000 counts, and if more than 50% of those come from <1% of pixels, then it is considered to be noise-dominated and hence unusable.
| Quadrant | # 1 sec bins | Bins with >0 counts | Bins with >2000 counts | High rate bins dominated by noise | Noise dominated (total time) | Noise dominated (detector-on time) | Marked lightcurve |
|---|---|---|---|---|---|---|---|
| A | 8943 | 7275 | 0 | 0 | 0.00% | 0.00% | 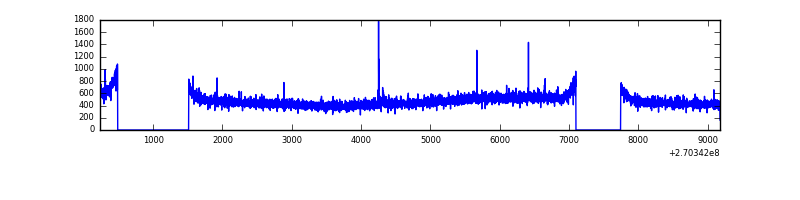 |
| B | 8943 | 7275 | 41 | 41 | 0.46% | 0.56% | 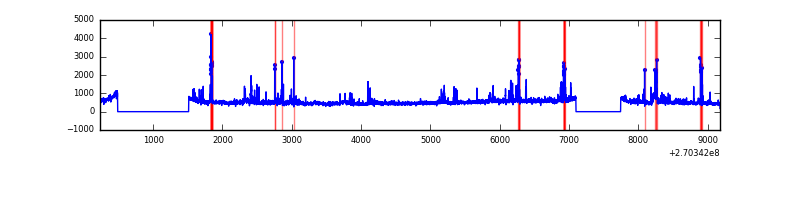 |
| C | 8943 | 7275 | 0 | 0 | 0.00% | 0.00% | 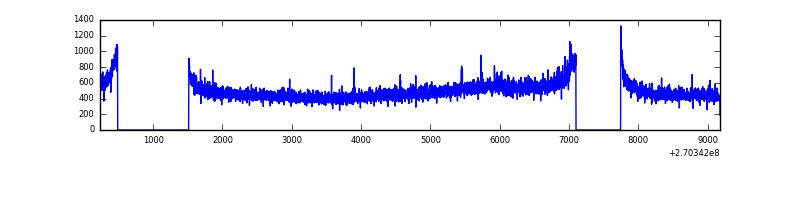 |
| D | 8943 | 7275 | 8 | 8 | 0.09% | 0.11% | 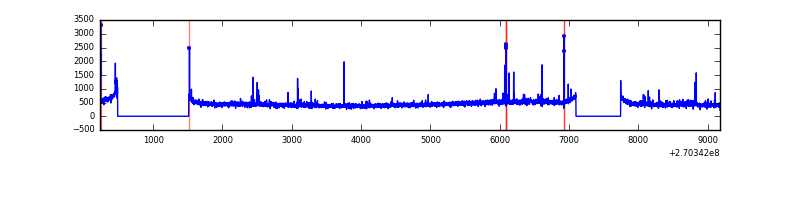 |
Top three noisy pixels from each quadrant. If the there are fewer than three noisy pixels in the level2.evt file, extra rows are filled as -1
| Pixel properties | Quadrant properties | ||||||
|---|---|---|---|---|---|---|---|
| Quadrant | DetID | PixID | Counts | Sigma | Mean | Median | Sigma |
| A | 9 | 143 | 16775 | 87.66 | 888 | 870 | 181.4 |
| A | 0 | 226 | 8023 | 39.42 | 888 | 870 | 181.4 |
| A | 12 | 194 | 6613 | 31.65 | 888 | 870 | 181.4 |
| B | 10 | 16 | 192935 | 1130.95 | 884 | 864 | 169.8 |
| B | 3 | 64 | 151019 | 884.14 | 884 | 864 | 169.8 |
| B | 0 | 205 | 73163 | 425.71 | 884 | 864 | 169.8 |
| C | 3 | 233 | 247634 | 1234.94 | 856 | 862 | 199.8 |
| C | 10 | 22 | 6463 | 28.03 | 856 | 862 | 199.8 |
| C | 13 | 61 | 6193 | 26.68 | 856 | 862 | 199.8 |
| D | 2 | 152 | 36777 | 169.79 | 853 | 828 | 211.7 |
| D | 10 | 70 | 34996 | 161.37 | 853 | 828 | 211.7 |
| D | 2 | 234 | 29296 | 134.45 | 853 | 828 | 211.7 |
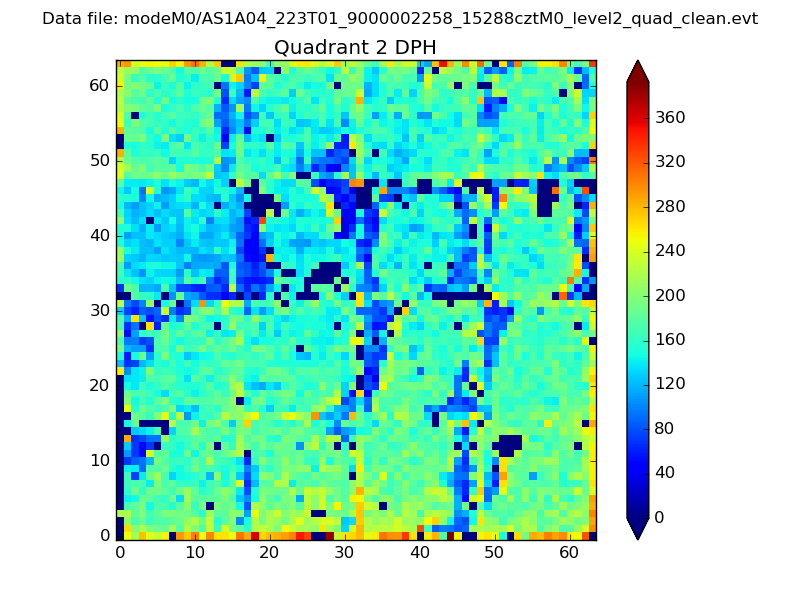
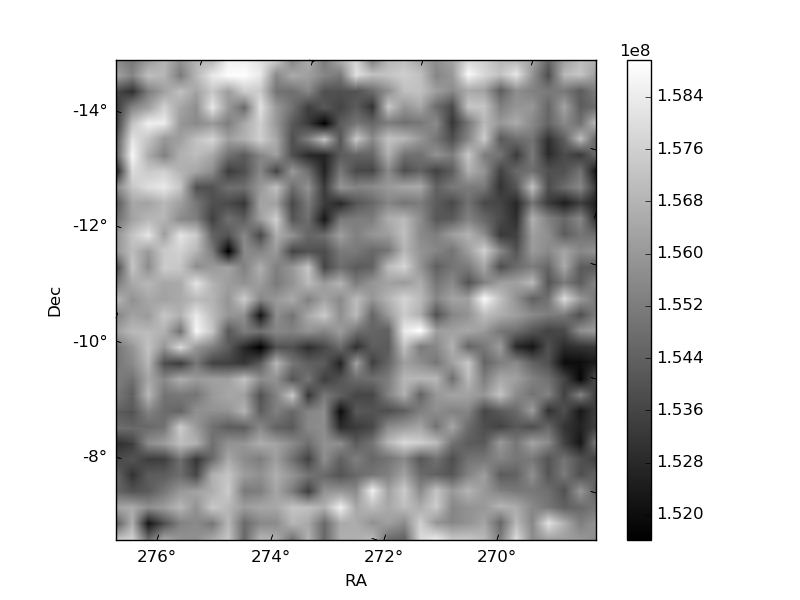
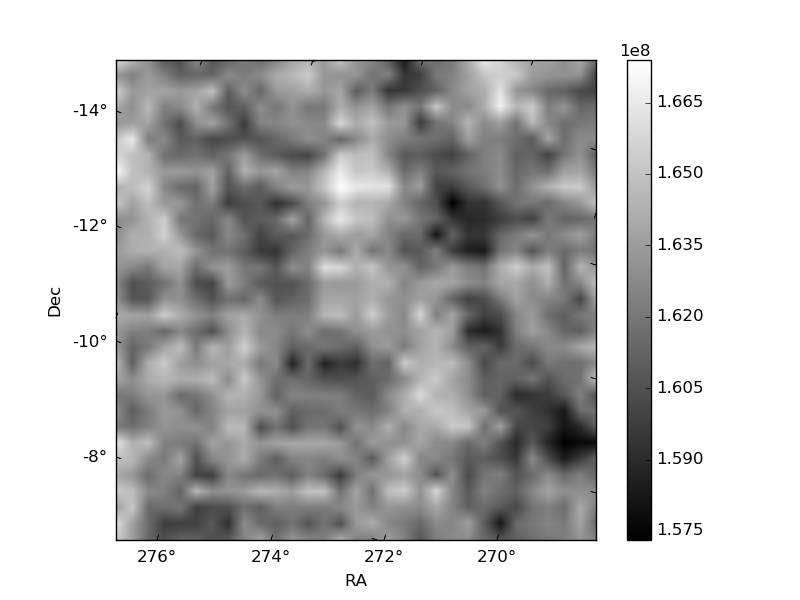
Histogram calculated using DETX and DETY for each event in the final _common_clean file
| Quadrant A |  |
 |
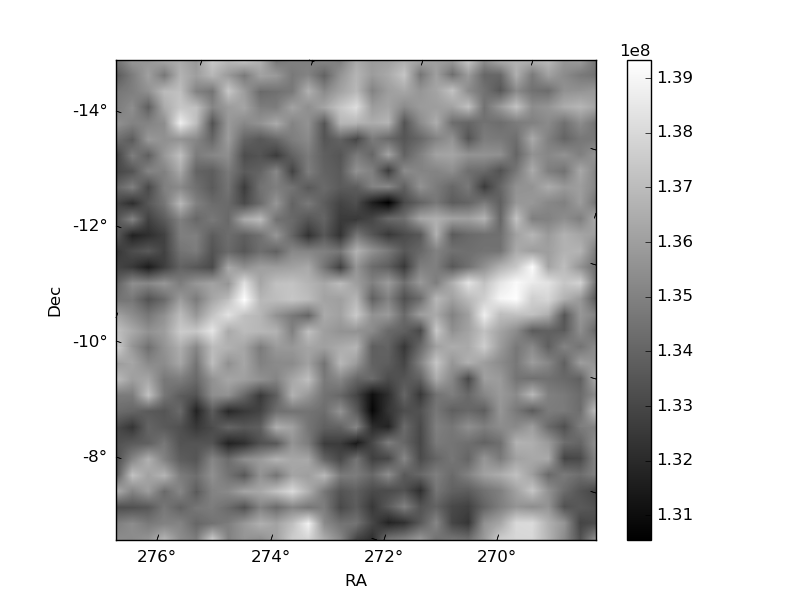
Quadrant B |
|---|---|---|---|
| Quadrant D | 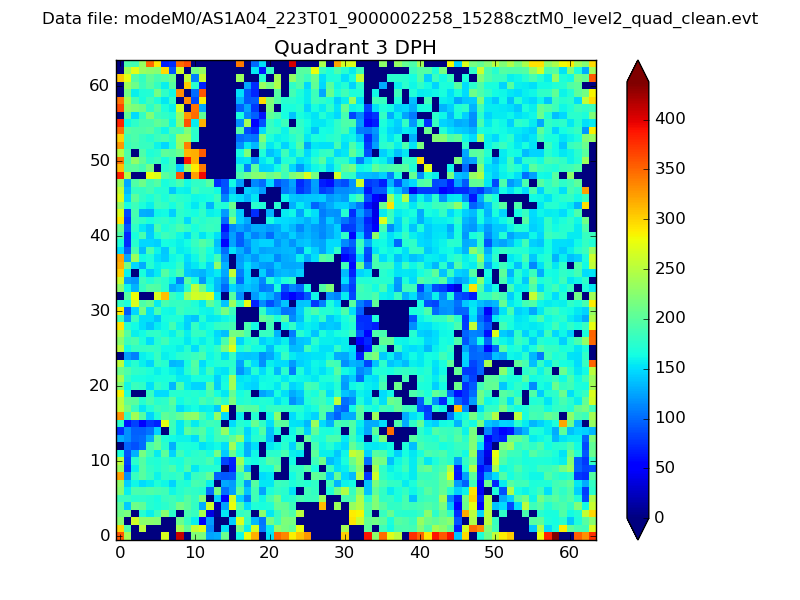 |
 |
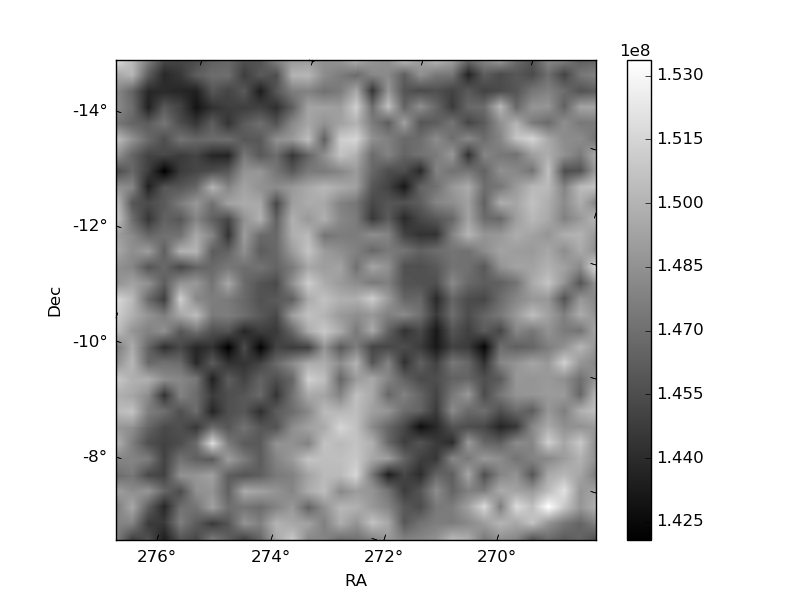
Quadrant C |
| Plot type | Count rate plots | Images |
|---|---|---|
| Comparison with Poisson distribution Blue bars denote a histogram of data divided into 1 sec bins. Red curve is a Poisson curve with rate = median count rate of data. |
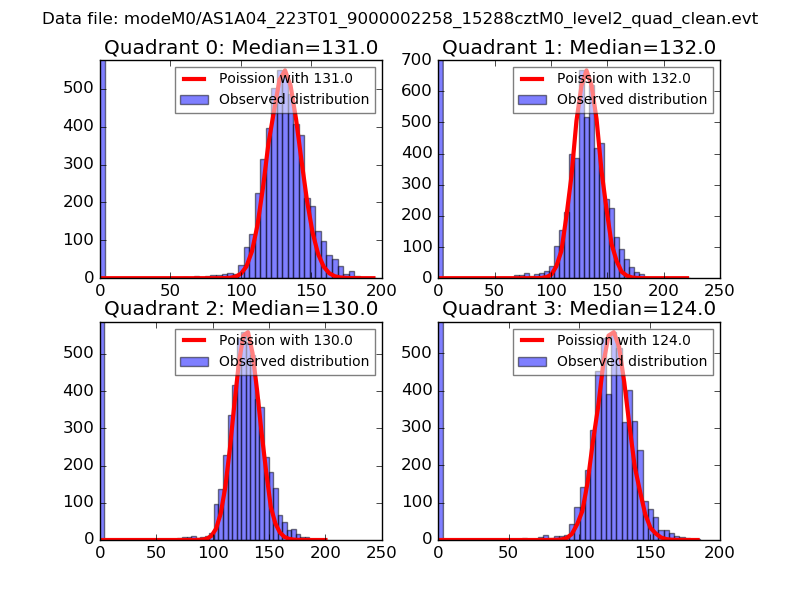 |
 |
| Quadrant-wise count rates Data is divided into 100 sec bins |
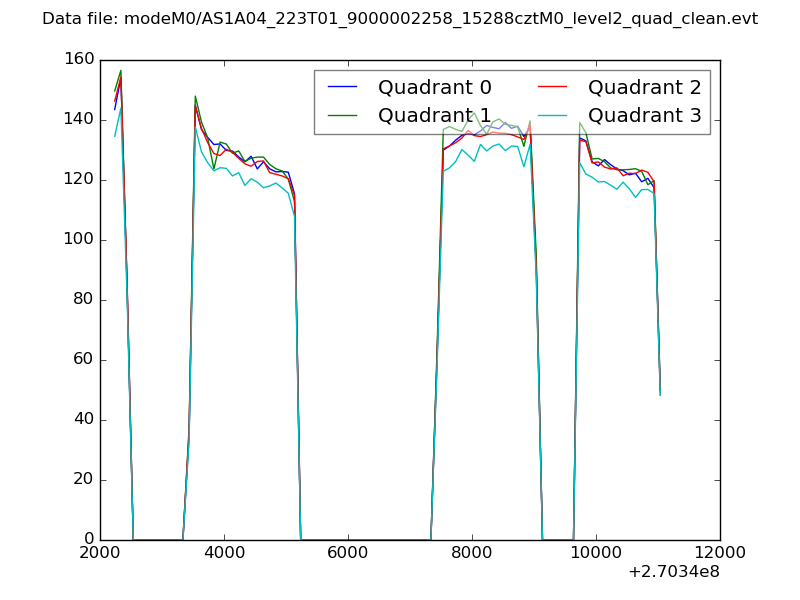 |
|
| Module-wise count rates for Quadrant A Data is divided into 100 sec bins |
 |
 |
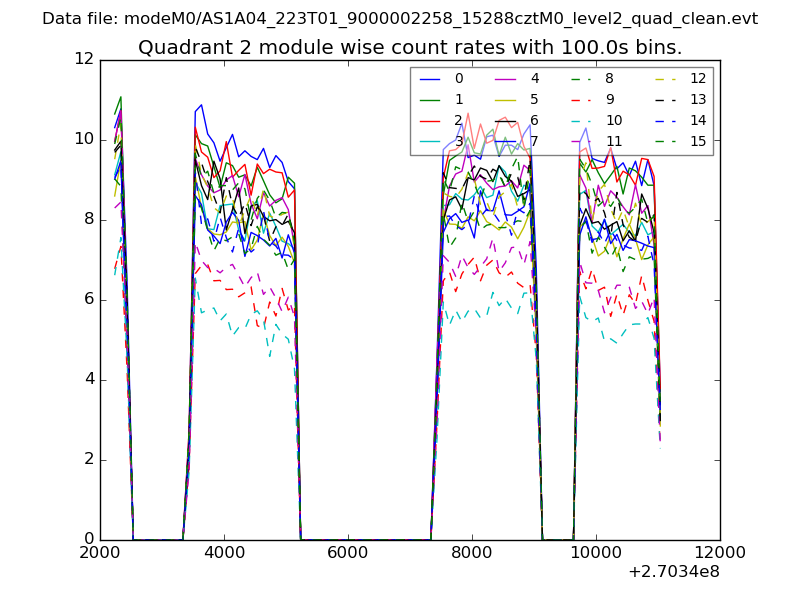
| Module-wise count rates for Quadrant B Data is divided into 100 sec bins |
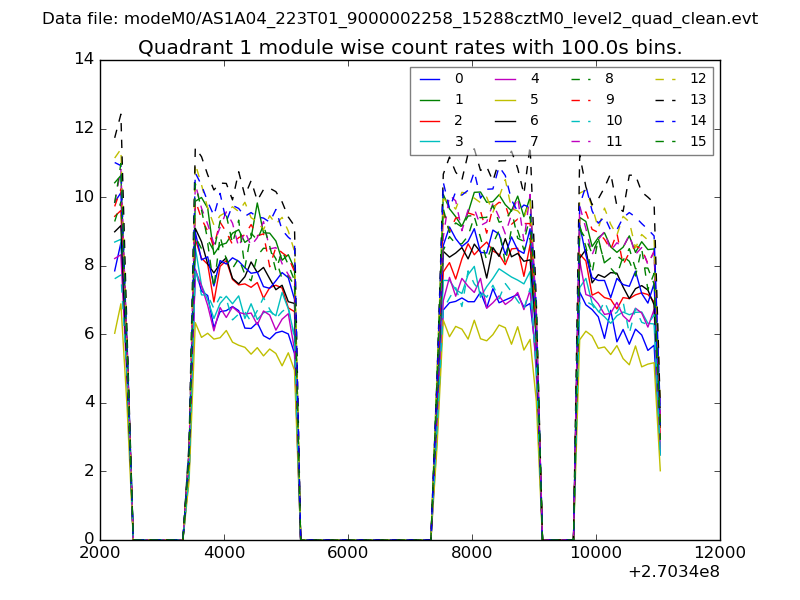 |
 |
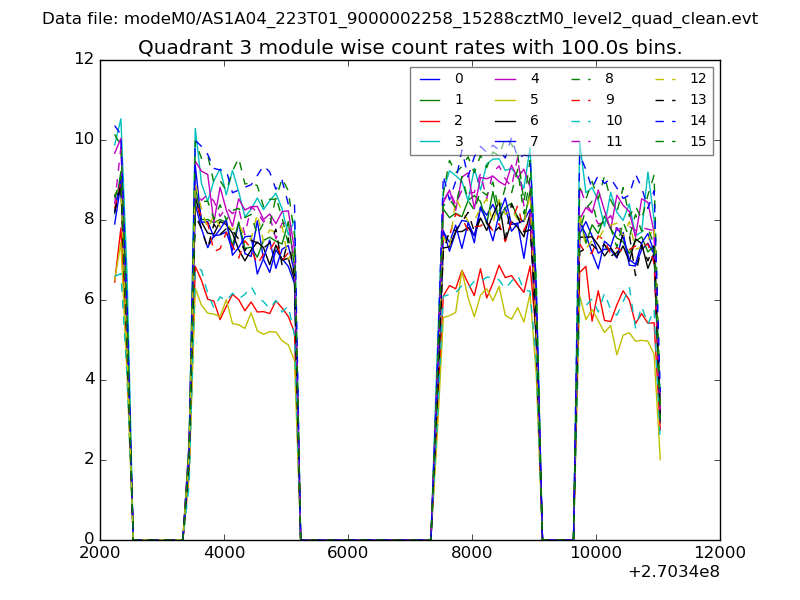
| Module-wise count rates for Quadrant C Data is divided into 100 sec bins |
 |
 |
| Module-wise count rates for Quadrant D Data is divided into 100 sec bins |
 |
 |
| Parameter | Plot |
|---|---|
| CZT HV Monitor | 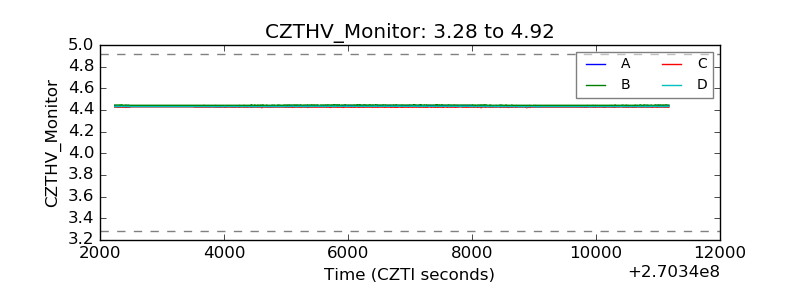 |
| D_VDD | 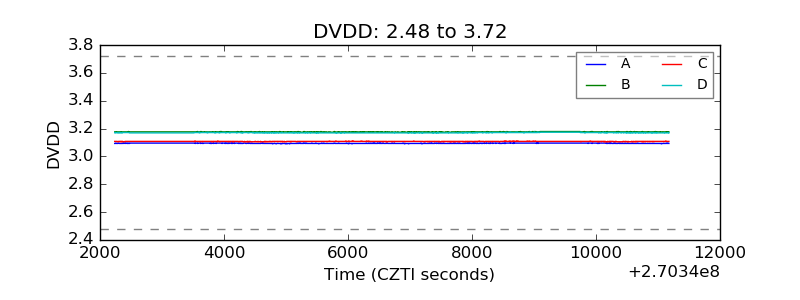 |
| Temperature 1 | 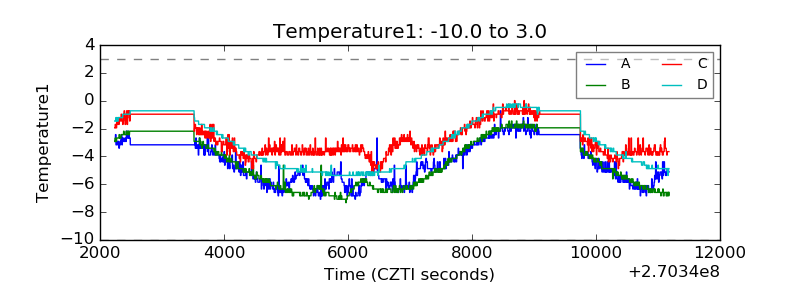 |
| Veto HV Monitor | 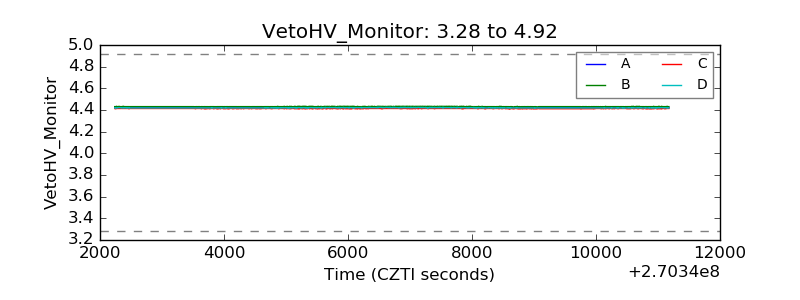 |
| Veto LLD | 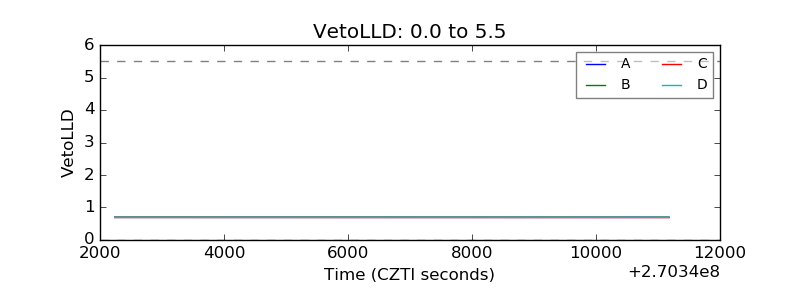 |
| Alpha Counter |  |
| _CPM_Rate | 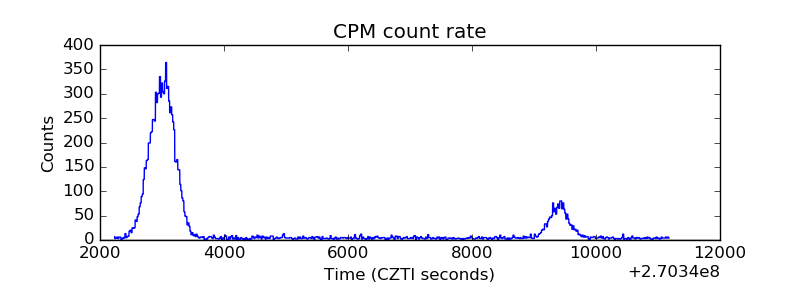 |
| CZT Counter | 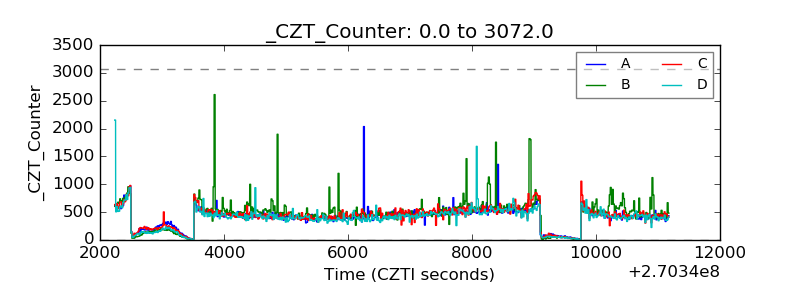 |
| +2.5 Volts monitor |  |
| +5 Volts monitor | 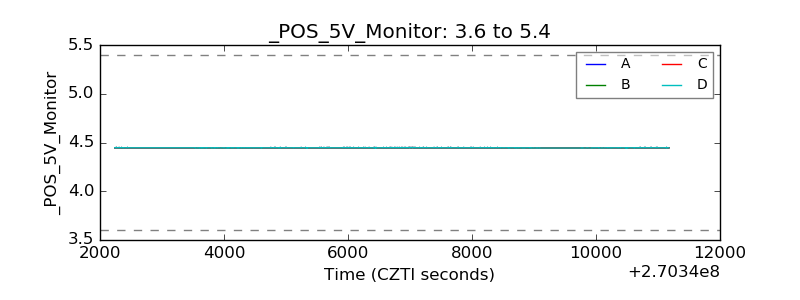 |
| _ROLL_ROT | 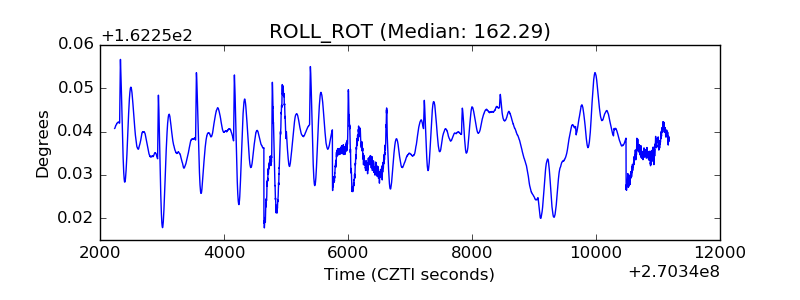 |
| _Roll_DEC | 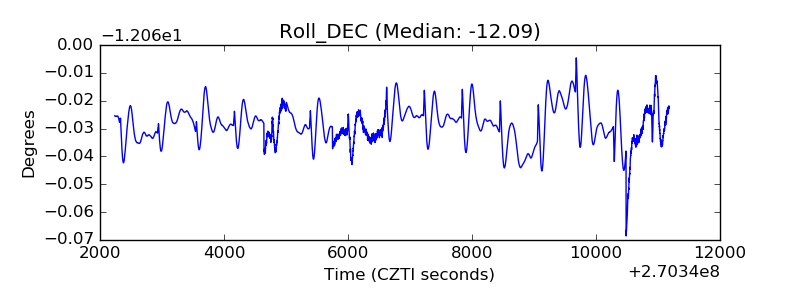 |
| _Roll_RA | 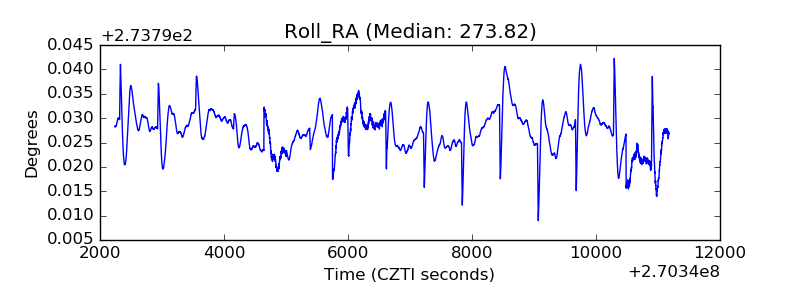 |
| Veto Counter | 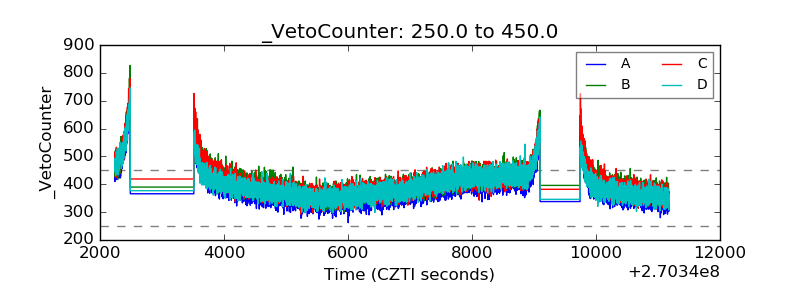 |