| Param | Original file | Final file |
|---|---|---|
| Filename | modeM0/AS1A04_223T01_9000002258_15290cztM0_level2.evt | modeM0/AS1A04_223T01_9000002258_15290cztM0_level2_quad_clean.evt |
| Size (bytes) | 558,593,280 | 103,213,440 |
| Size | 532.7 MB | 98.4 MB |
| Events in quadrant A | 3,869,955 | 643,109 |
| Events in quadrant B | 4,190,449 | 654,406 |
| Events in quadrant C | 4,077,497 | 640,952 |
| Events in quadrant D | 4,216,741 | 611,601 |
| Mode SS | |||
|---|---|---|---|
| Quadrant | BADHDUFLAG | Total packets | Discarded packets |
| A | 0 | 170 | 0 |
| B | 0 | 170 | 0 |
| C | 0 | 170 | 0 |
| D | 0 | 170 | 0 |
| Mode M9 | |||
|---|---|---|---|
| Quadrant | BADHDUFLAG | Total packets | Discarded packets |
| A | 0 | 6 | 0 |
| B | 0 | 6 | 0 |
| C | 0 | 6 | 0 |
| D | 0 | 6 | 0 |
| Mode M0 | |||
|---|---|---|---|
| Quadrant | BADHDUFLAG | Total packets | Discarded packets |
| A | 0 | 17090 | 3 |
| B | 0 | 17722 | 2 |
| C | 0 | 17324 | 2 |
| D | 0 | 18396 | 2 |
| Quadrant | Total seconds | Saturated seconds | Saturation percentage |
|---|---|---|---|
| A | 8285 | 66 | 0.796620% |
| B | 8285 | 120 | 1.448401% |
| C | 8285 | 41 | 0.494870% |
| D | 8285 | 95 | 1.146651% |
Noise dominated data is calculated using 1-second bins in cleaned event files. If a bin has >2000 counts, and if more than 50% of those come from <1% of pixels, then it is considered to be noise-dominated and hence unusable.
| Quadrant | # 1 sec bins | Bins with >0 counts | Bins with >2000 counts | High rate bins dominated by noise | Noise dominated (total time) | Noise dominated (detector-on time) | Marked lightcurve |
|---|---|---|---|---|---|---|---|
| A | 8976 | 8288 | 0 | 0 | 0.00% | 0.00% | 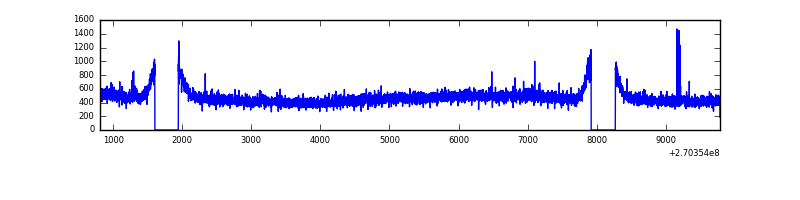 |
| B | 8976 | 8288 | 11 | 11 | 0.12% | 0.13% | 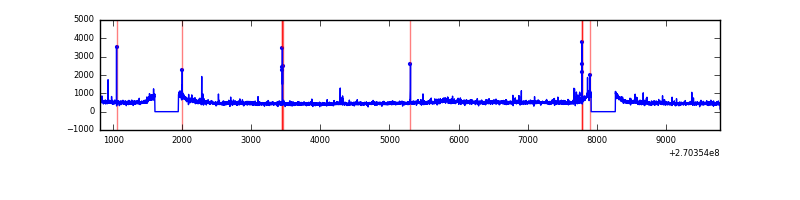 |
| C | 8976 | 8288 | 0 | 0 | 0.00% | 0.00% | 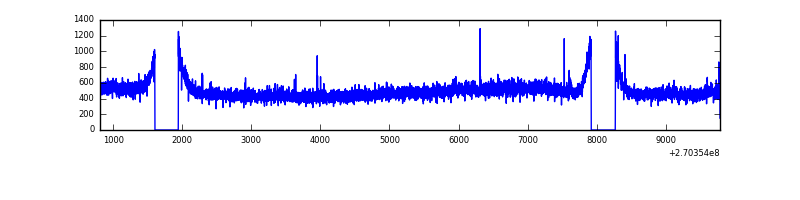 |
| D | 8976 | 8288 | 59 | 59 | 0.66% | 0.71% | 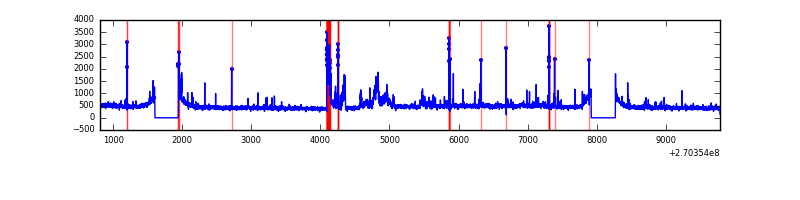 |
Top three noisy pixels from each quadrant. If the there are fewer than three noisy pixels in the level2.evt file, extra rows are filled as -1
| Pixel properties | Quadrant properties | ||||||
|---|---|---|---|---|---|---|---|
| Quadrant | DetID | PixID | Counts | Sigma | Mean | Median | Sigma |
| A | 9 | 143 | 15797 | 72.56 | 1001 | 978 | 204.2 |
| A | 0 | 226 | 8821 | 38.4 | 1001 | 978 | 204.2 |
| A | 12 | 194 | 7352 | 31.21 | 1001 | 978 | 204.2 |
| B | 0 | 229 | 84759 | 426.87 | 1007 | 981 | 196.3 |
| B | 3 | 209 | 28714 | 141.31 | 1007 | 981 | 196.3 |
| B | 0 | 197 | 27044 | 132.8 | 1007 | 981 | 196.3 |
| C | 3 | 233 | 286172 | 1260.56 | 971 | 977 | 226.2 |
| C | 13 | 61 | 7072 | 26.94 | 971 | 977 | 226.2 |
| C | 7 | 247 | 3131 | 9.52 | 971 | 977 | 226.2 |
| D | 2 | 33 | 271643 | 1133.6 | 965 | 938 | 238.8 |
| D | 12 | 110 | 128089 | 532.46 | 965 | 938 | 238.8 |
| D | 7 | 38 | 75187 | 310.92 | 965 | 938 | 238.8 |
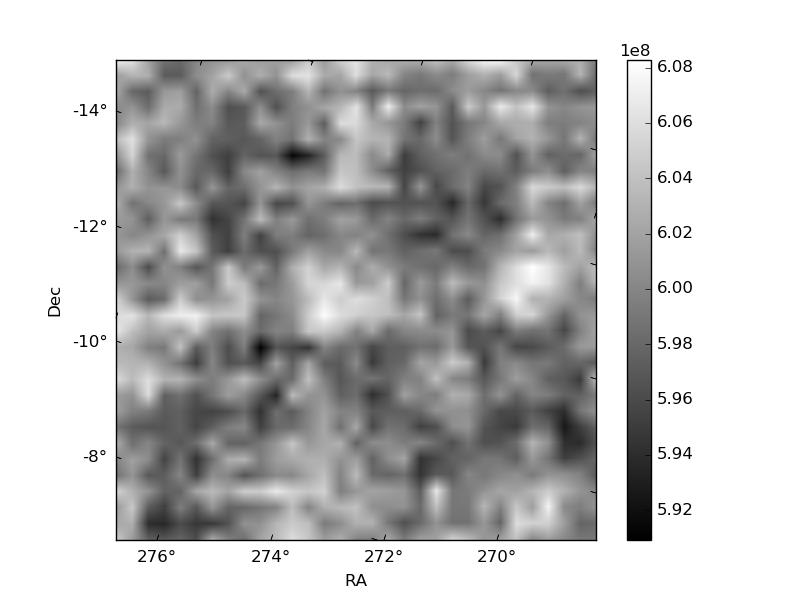
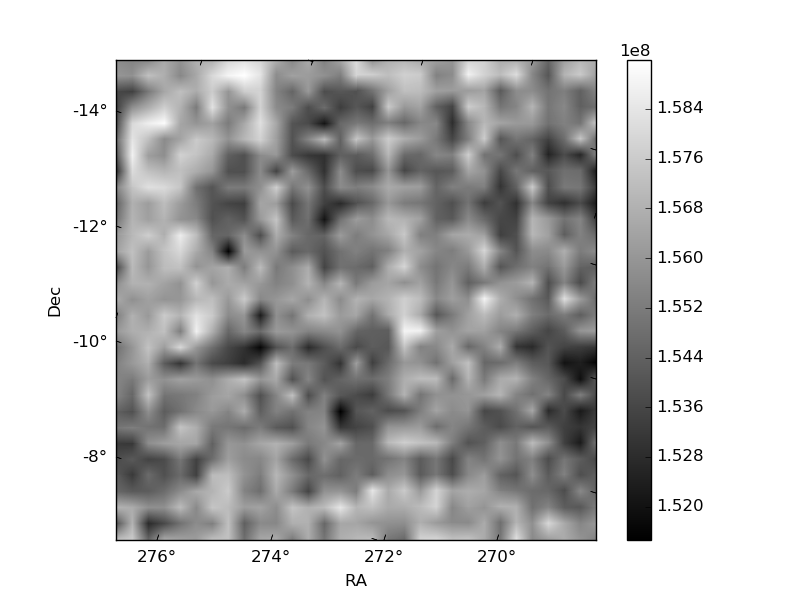
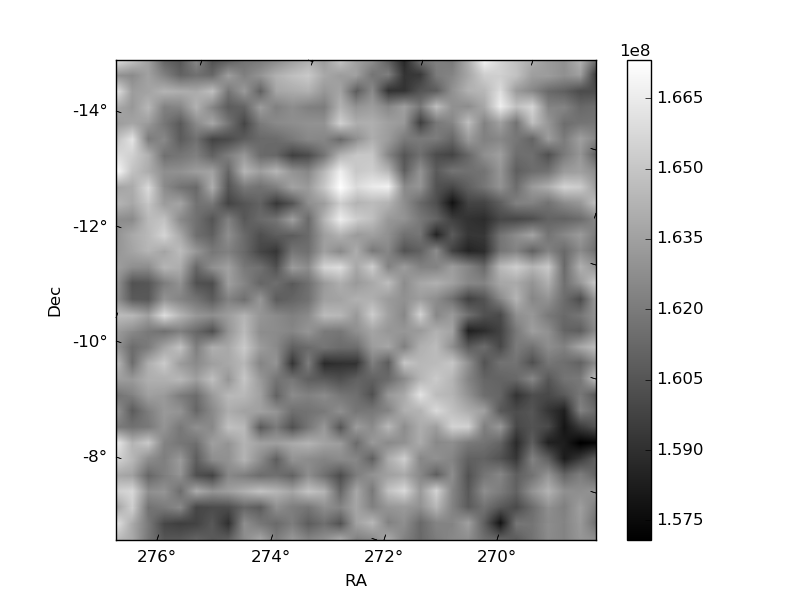
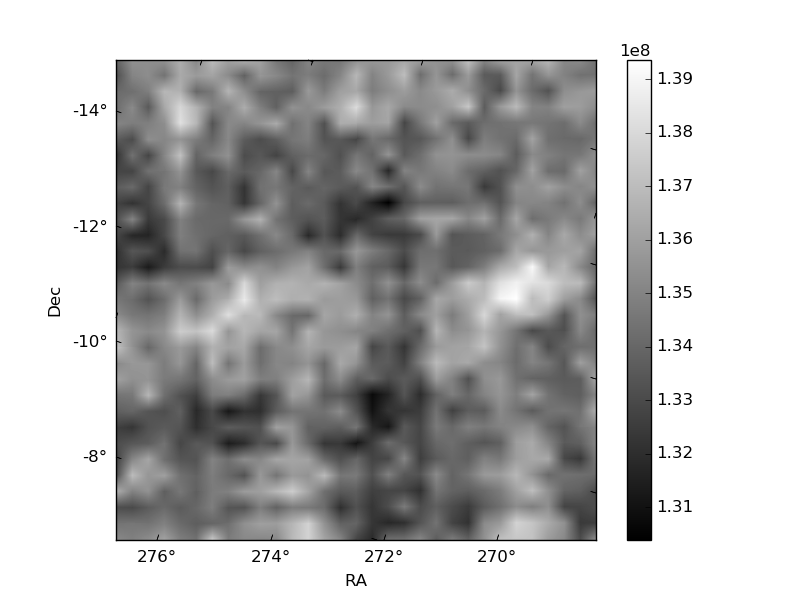
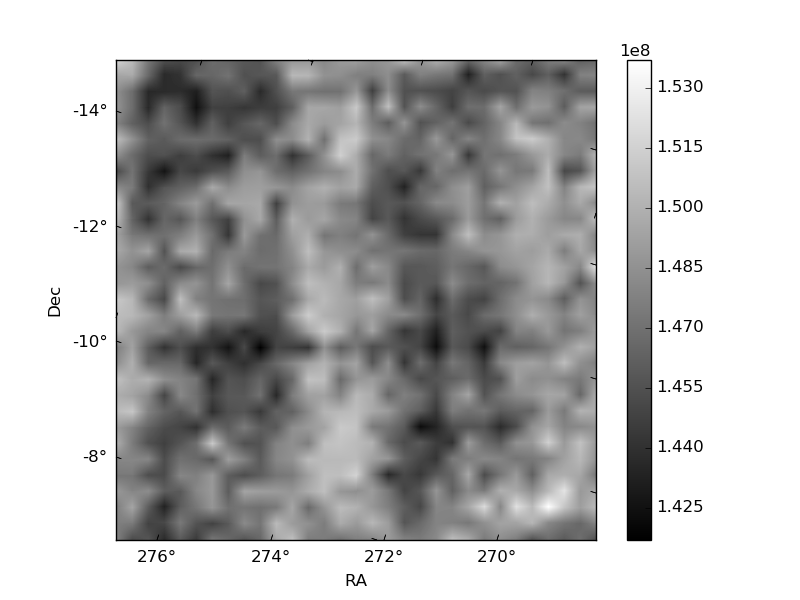
Histogram calculated using DETX and DETY for each event in the final _common_clean file
| Quadrant A | 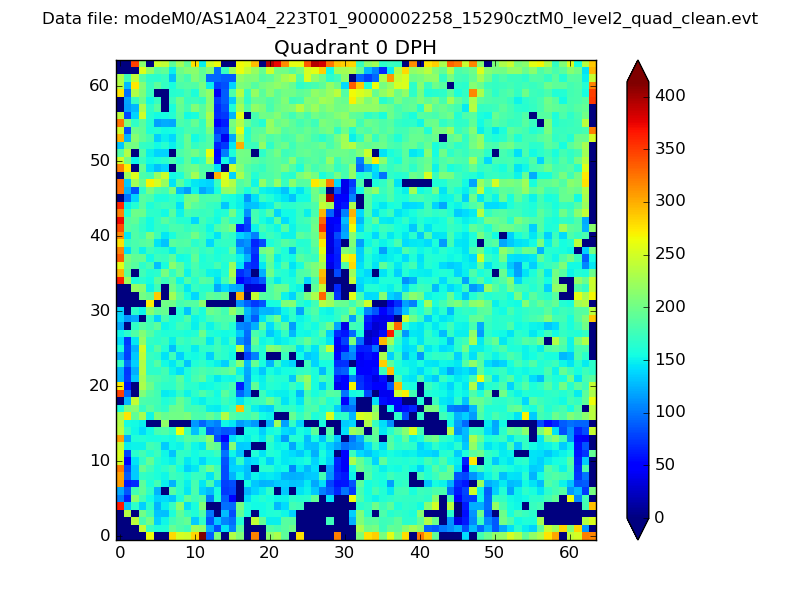 |
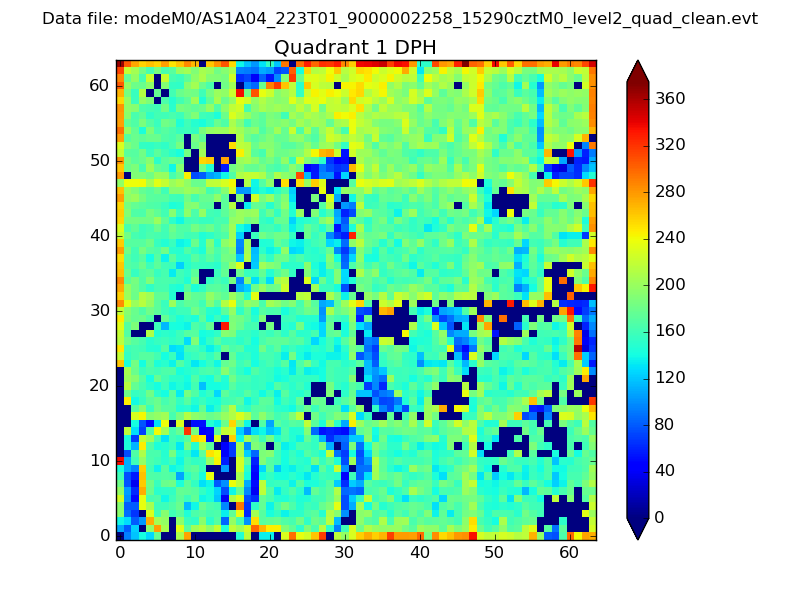 |
Quadrant B |
|---|---|---|---|
| Quadrant D | 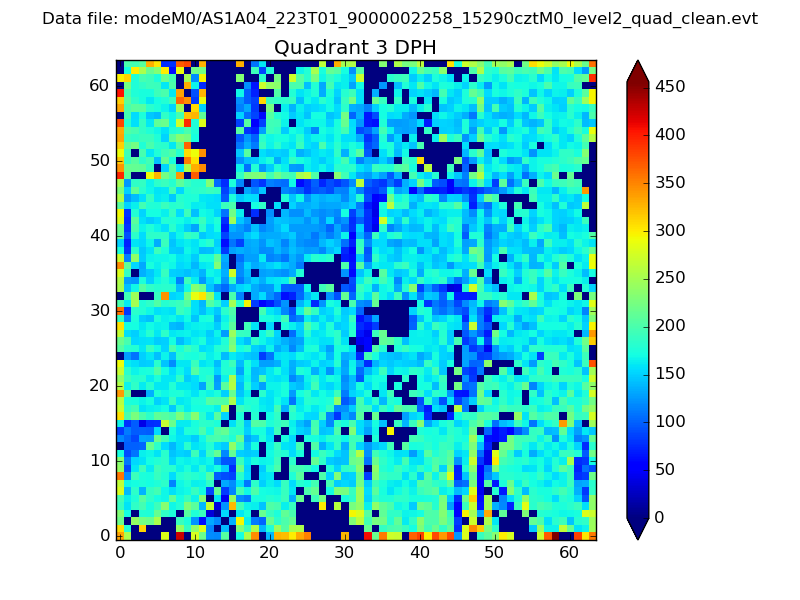 |
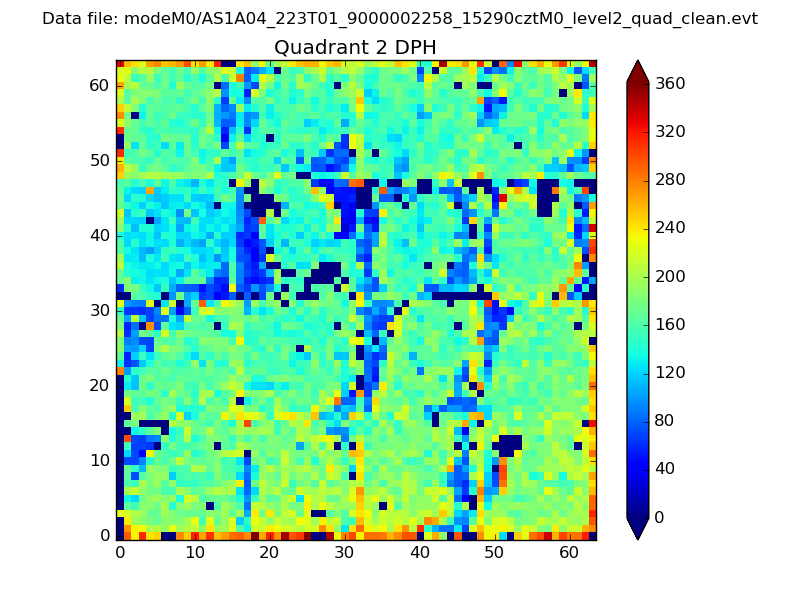 |
Quadrant C |
| Plot type | Count rate plots | Images |
|---|---|---|
| Comparison with Poisson distribution Blue bars denote a histogram of data divided into 1 sec bins. Red curve is a Poisson curve with rate = median count rate of data. |
 |
 |
| Quadrant-wise count rates Data is divided into 100 sec bins |
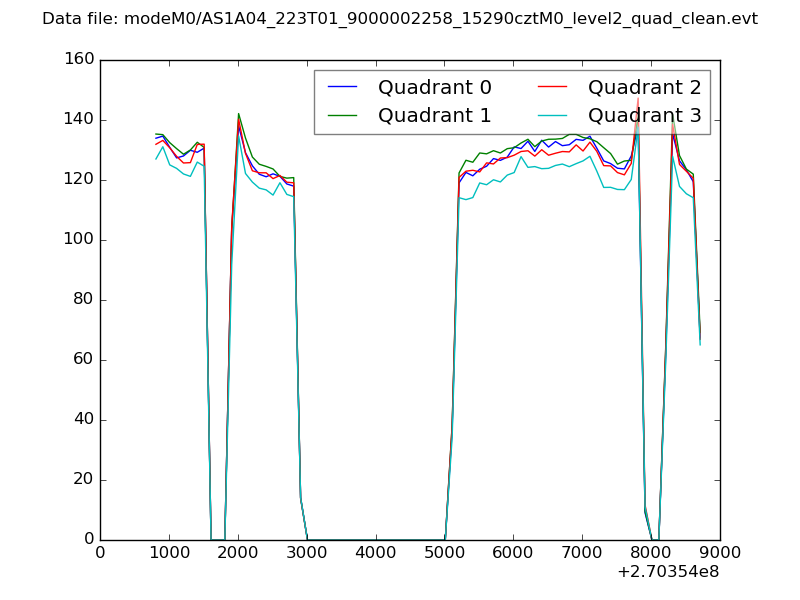 |
|
| Module-wise count rates for Quadrant A Data is divided into 100 sec bins |
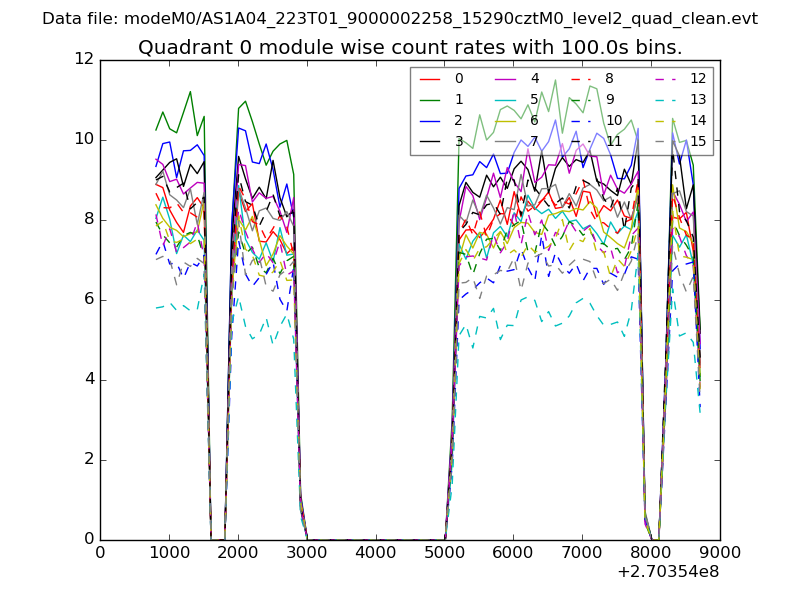 |
 |
| Module-wise count rates for Quadrant B Data is divided into 100 sec bins |
 |
 |
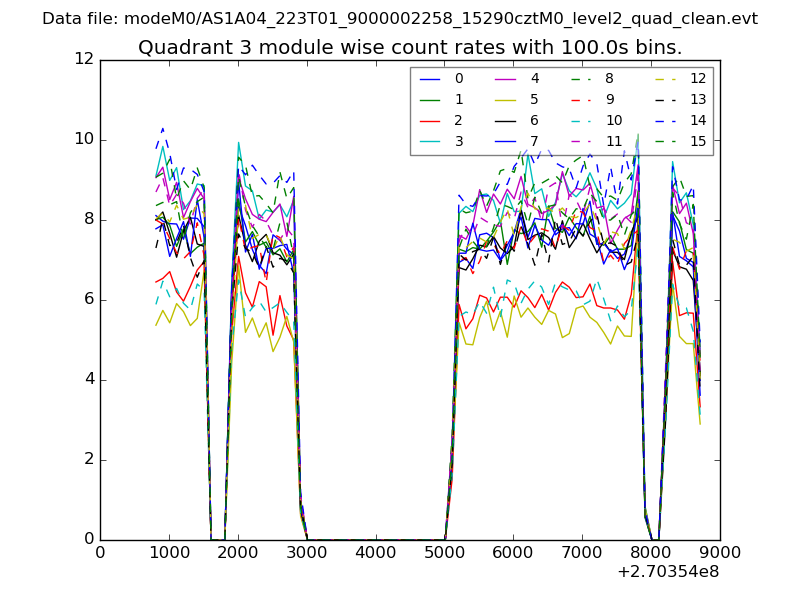
| Module-wise count rates for Quadrant C Data is divided into 100 sec bins |
 |
 |
| Module-wise count rates for Quadrant D Data is divided into 100 sec bins |
 |
 |
| Parameter | Plot |
|---|---|
| CZT HV Monitor |  |
| D_VDD | 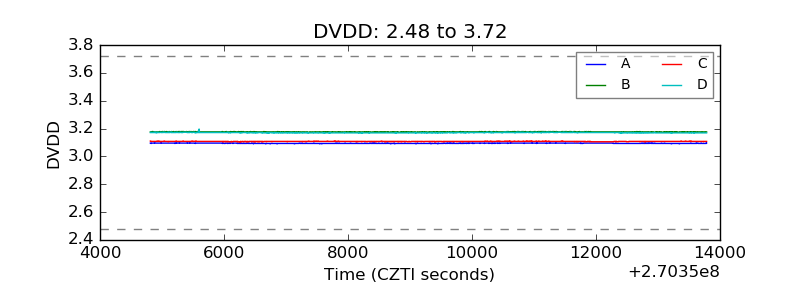 |
| Temperature 1 | 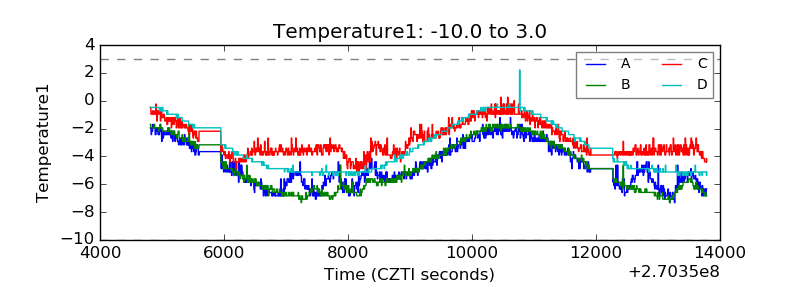 |
| Veto HV Monitor | 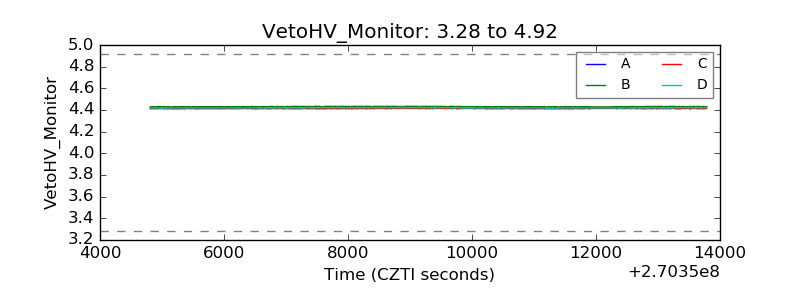 |
| Veto LLD | 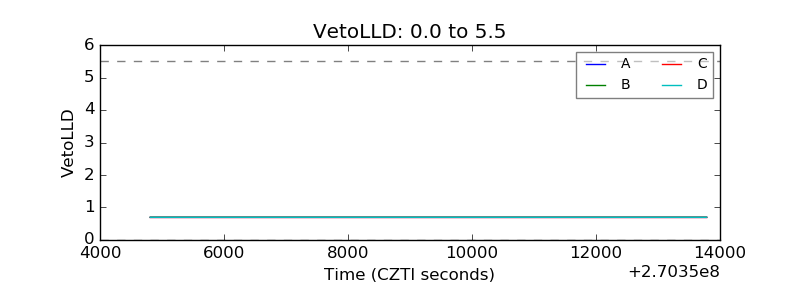 |
| Alpha Counter |  |
| _CPM_Rate | 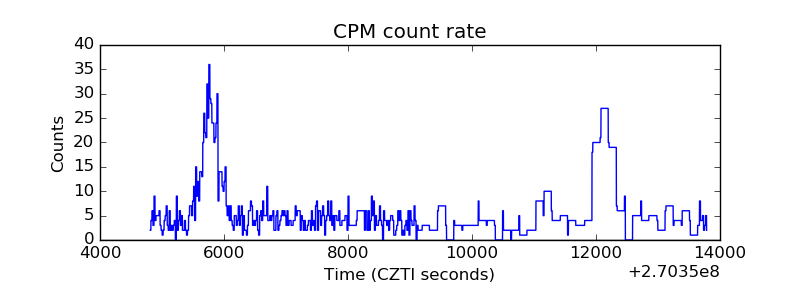 |
| CZT Counter | 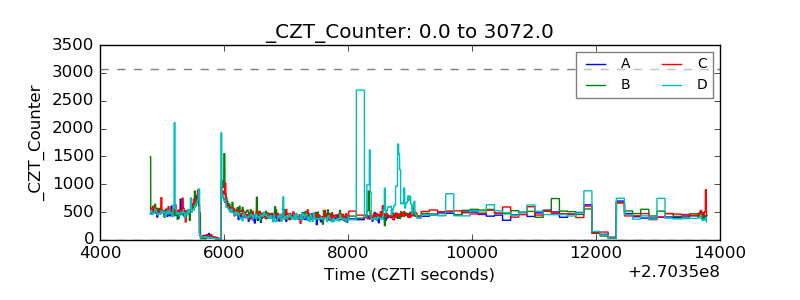 |
| +2.5 Volts monitor |  |
| +5 Volts monitor |  |
| _ROLL_ROT | 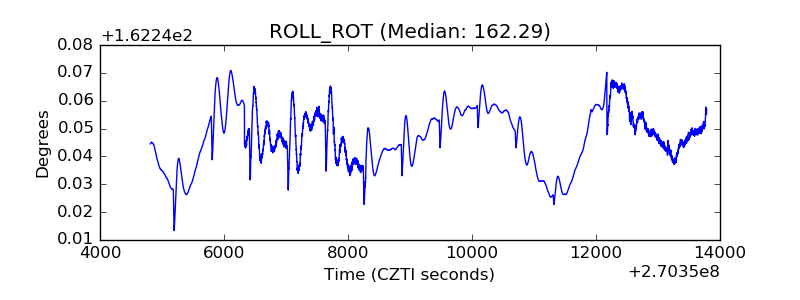 |
| _Roll_DEC | 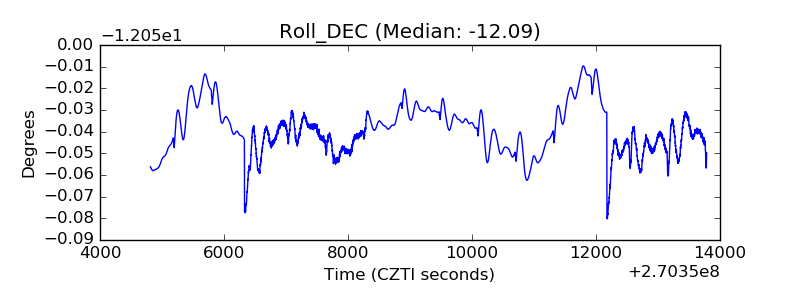 |
| _Roll_RA | 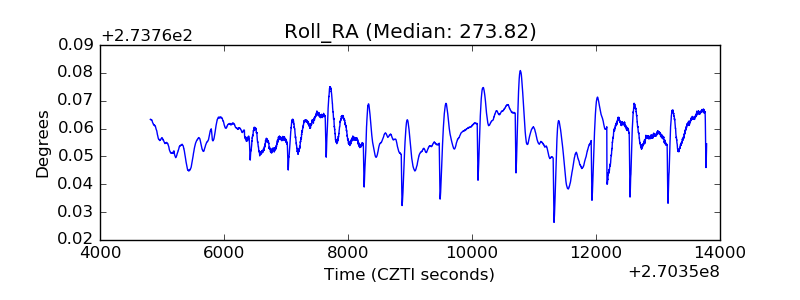 |
| Veto Counter | 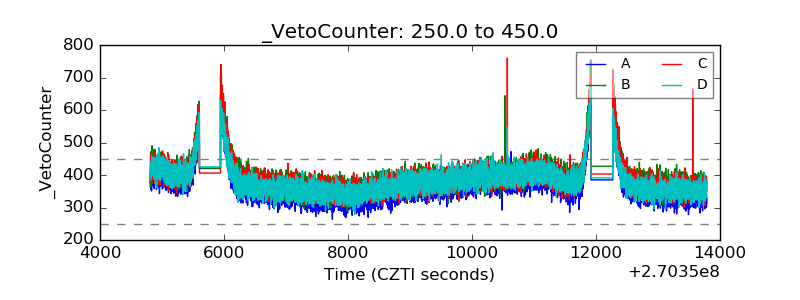 |