| Param | Original file | Final file |
|---|---|---|
| Filename | modeM0/AS1A04_223T01_9000002258_15293cztM0_level2.evt | modeM0/AS1A04_223T01_9000002258_15293cztM0_level2_quad_clean.evt |
| Size (bytes) | 1,304,150,400 | 217,837,440 |
| Size | 1.2 GB | 207.7 MB |
| Events in quadrant A | 8,629,307 | 1,340,095 |
| Events in quadrant B | 11,898,503 | 1,361,764 |
| Events in quadrant C | 9,180,792 | 1,337,814 |
| Events in quadrant D | 8,530,200 | 1,276,496 |
| Mode SS | |||
|---|---|---|---|
| Quadrant | BADHDUFLAG | Total packets | Discarded packets |
| A | 0 | 384 | 0 |
| B | 0 | 384 | 0 |
| C | 0 | 384 | 0 |
| D | 0 | 384 | 0 |
| Mode M9 | |||
|---|---|---|---|
| Quadrant | BADHDUFLAG | Total packets | Discarded packets |
| A | 0 | 20 | 0 |
| B | 0 | 20 | 0 |
| C | 0 | 20 | 0 |
| D | 0 | 20 | 0 |
| Mode M0 | |||
|---|---|---|---|
| Quadrant | BADHDUFLAG | Total packets | Discarded packets |
| A | 0 | 38046 | 5 |
| B | 0 | 46950 | 4 |
| C | 0 | 38475 | 4 |
| D | 0 | 38648 | 4 |
| Quadrant | Total seconds | Saturated seconds | Saturation percentage |
|---|---|---|---|
| A | 18579 | 198 | 1.065719% |
| B | 18579 | 1319 | 7.099413% |
| C | 18579 | 157 | 0.845040% |
| D | 18579 | 173 | 0.931159% |
Noise dominated data is calculated using 1-second bins in cleaned event files. If a bin has >2000 counts, and if more than 50% of those come from <1% of pixels, then it is considered to be noise-dominated and hence unusable.
| Quadrant | # 1 sec bins | Bins with >0 counts | Bins with >2000 counts | High rate bins dominated by noise | Noise dominated (total time) | Noise dominated (detector-on time) | Marked lightcurve |
|---|---|---|---|---|---|---|---|
| A | 20795 | 18582 | 3 | 3 | 0.01% | 0.02% | 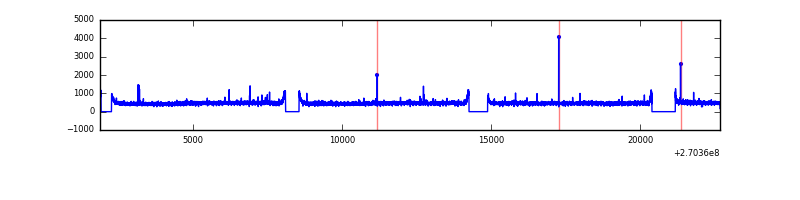 |
| B | 20795 | 18581 | 929 | 929 | 4.47% | 5.00% | 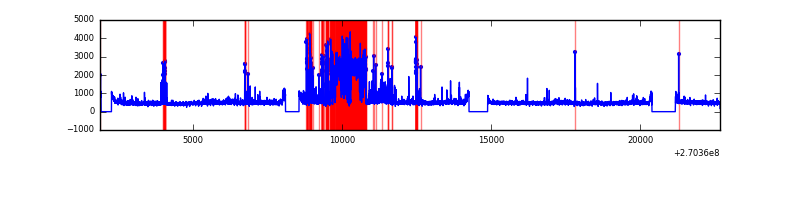 |
| C | 20795 | 18583 | 1 | 1 | 0.00% | 0.01% | 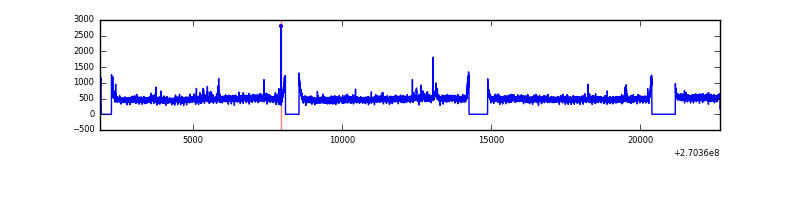 |
| D | 20795 | 18583 | 47 | 47 | 0.23% | 0.25% | 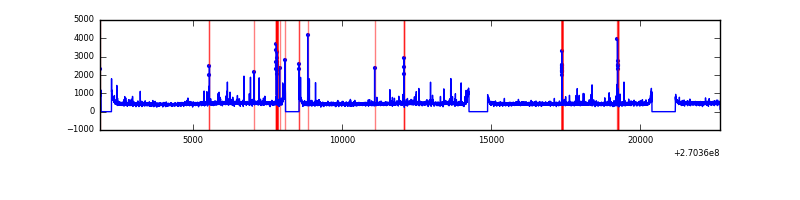 |
Top three noisy pixels from each quadrant. If the there are fewer than three noisy pixels in the level2.evt file, extra rows are filled as -1
| Pixel properties | Quadrant properties | ||||||
|---|---|---|---|---|---|---|---|
| Quadrant | DetID | PixID | Counts | Sigma | Mean | Median | Sigma |
| A | 9 | 143 | 43042 | 90.7 | 2229 | 2180 | 450.5 |
| A | 0 | 226 | 19645 | 38.77 | 2229 | 2180 | 450.5 |
| A | 13 | 252 | 18326 | 35.84 | 2229 | 2180 | 450.5 |
| B | 10 | 16 | 2992155 | 7144.73 | 2163 | 2109 | 418.5 |
| B | 0 | 229 | 129856 | 305.25 | 2163 | 2109 | 418.5 |
| B | 0 | 205 | 67746 | 156.84 | 2163 | 2109 | 418.5 |
| C | 3 | 233 | 639342 | 1280.28 | 2158 | 2173 | 497.7 |
| C | 3 | 9 | 76285 | 148.91 | 2158 | 2173 | 497.7 |
| C | 7 | 247 | 32043 | 60.02 | 2158 | 2173 | 497.7 |
| D | 7 | 38 | 118499 | 217.78 | 2157 | 2092 | 534.5 |
| D | 2 | 234 | 75047 | 136.49 | 2157 | 2092 | 534.5 |
| D | 10 | 70 | 69125 | 125.41 | 2157 | 2092 | 534.5 |
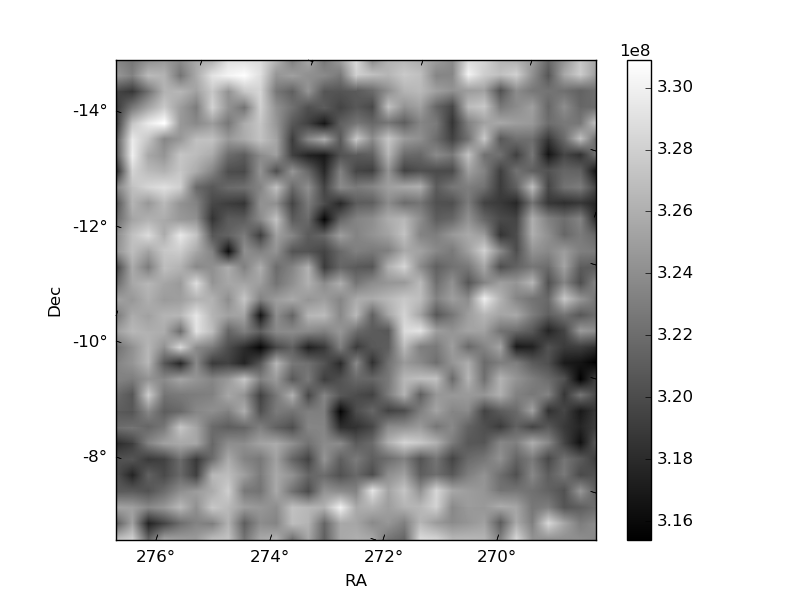
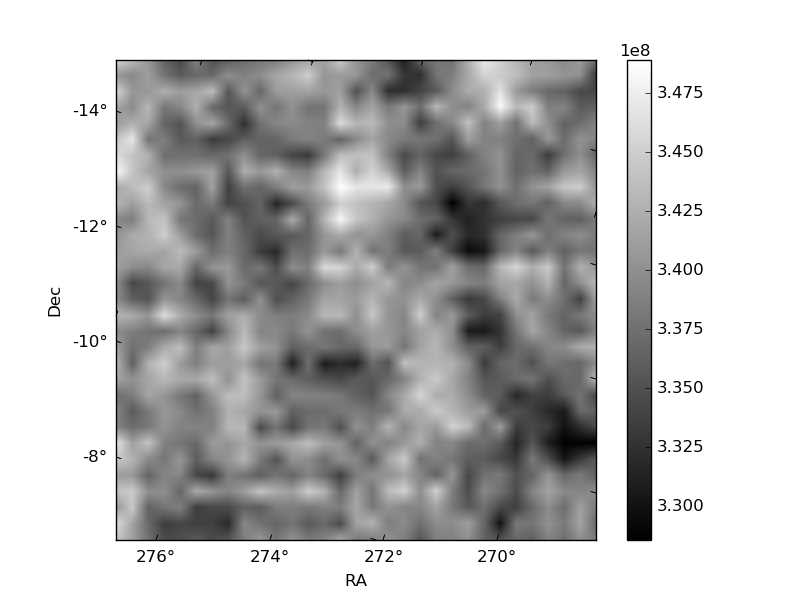
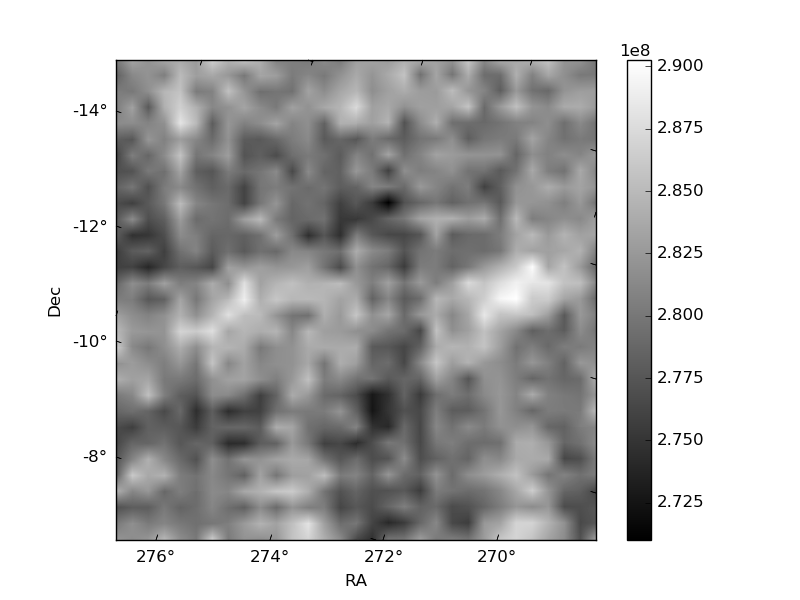
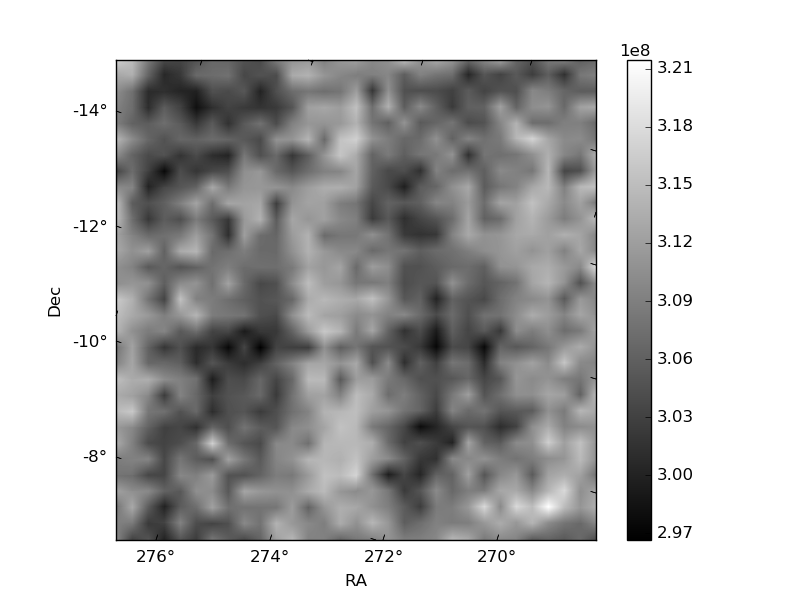
Histogram calculated using DETX and DETY for each event in the final _common_clean file
| Quadrant A | 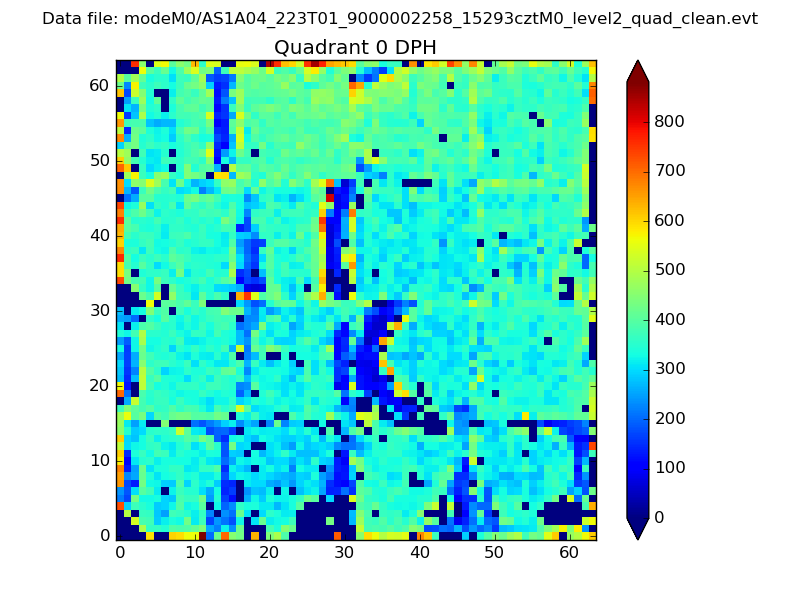 |
 |
Quadrant B |
|---|---|---|---|
| Quadrant D |  |
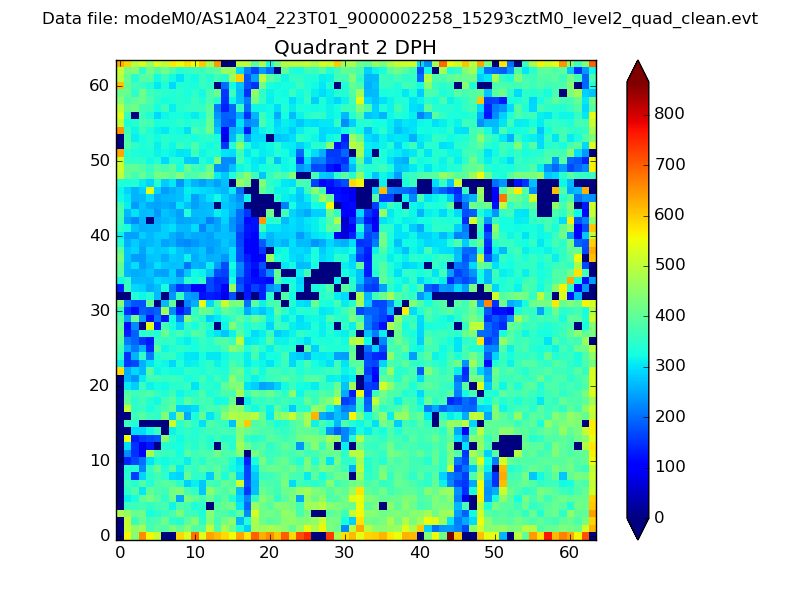 |
Quadrant C |
| Plot type | Count rate plots | Images |
|---|---|---|
| Comparison with Poisson distribution Blue bars denote a histogram of data divided into 1 sec bins. Red curve is a Poisson curve with rate = median count rate of data. |
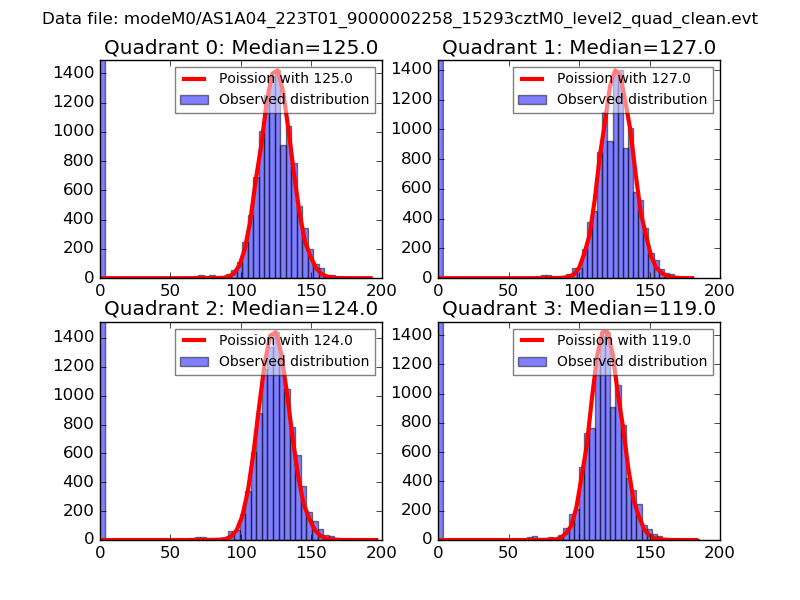 |
 |
| Quadrant-wise count rates Data is divided into 100 sec bins |
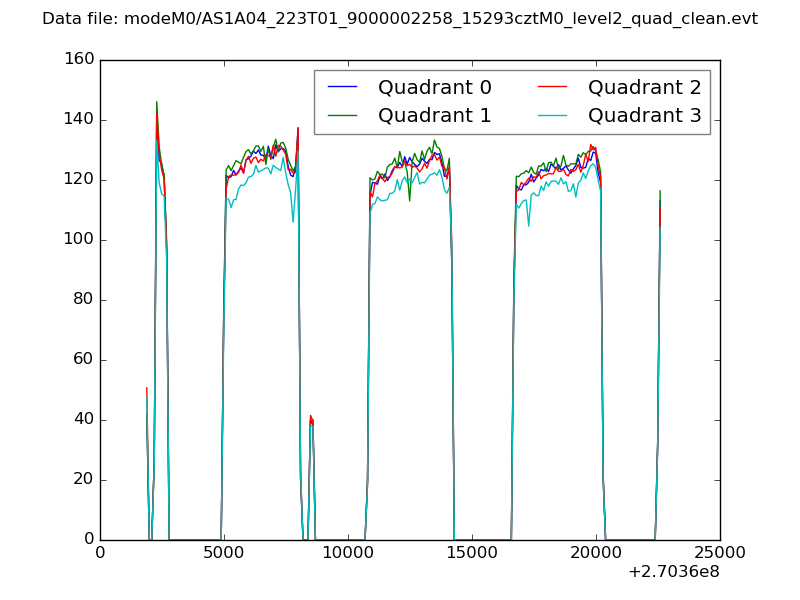 |
|
| Module-wise count rates for Quadrant A Data is divided into 100 sec bins |
 |
 |
| Module-wise count rates for Quadrant B Data is divided into 100 sec bins |
 |
 |
| Module-wise count rates for Quadrant C Data is divided into 100 sec bins |
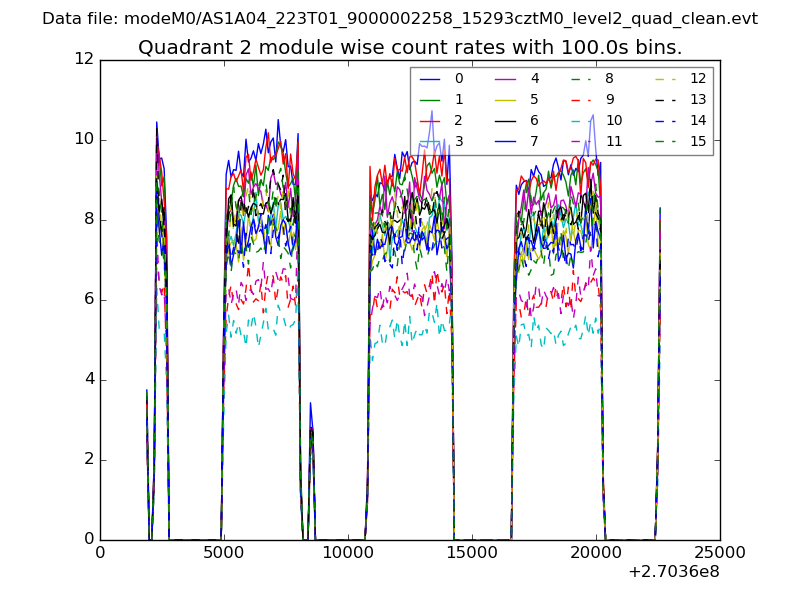 |
 |
| Module-wise count rates for Quadrant D Data is divided into 100 sec bins |
 |
 |
| Parameter | Plot |
|---|---|
| CZT HV Monitor |  |
| D_VDD | 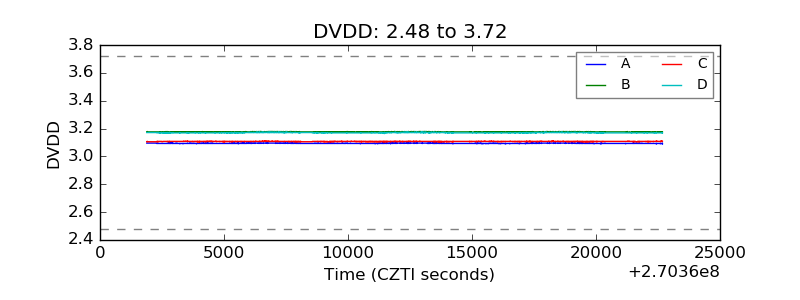 |
| Temperature 1 | 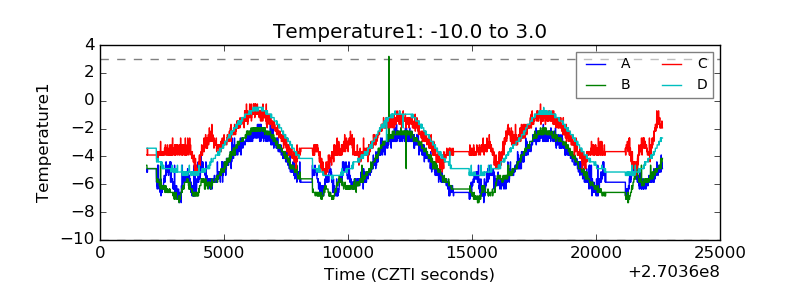 |
| Veto HV Monitor | 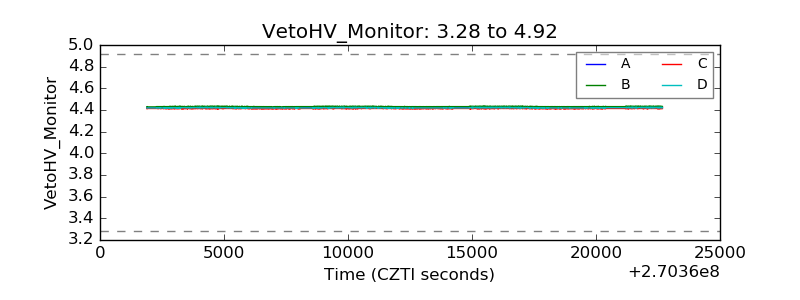 |
| Veto LLD | 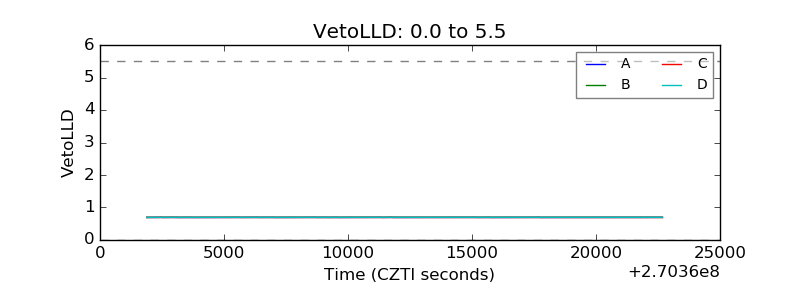 |
| Alpha Counter | 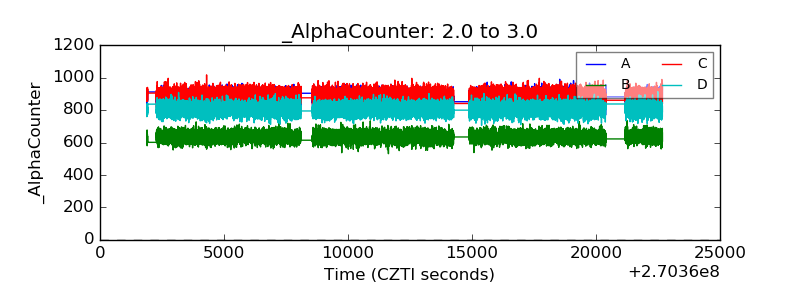 |
| _CPM_Rate | 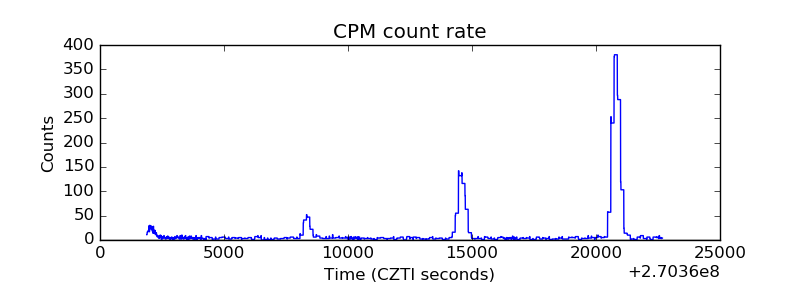 |
| CZT Counter | 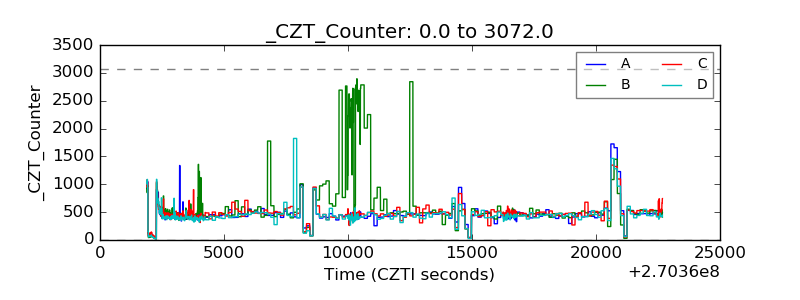 |
| +2.5 Volts monitor | 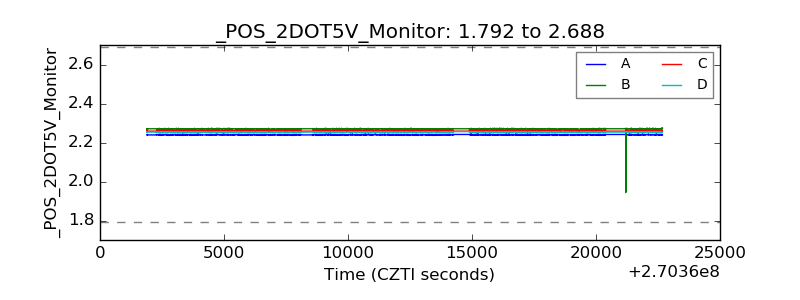 |
| +5 Volts monitor | 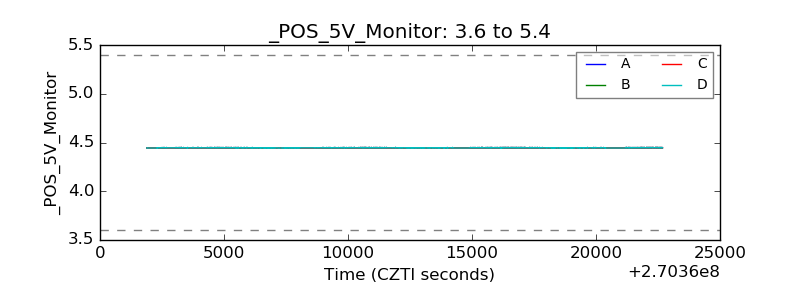 |
| _ROLL_ROT |  |
| _Roll_DEC | 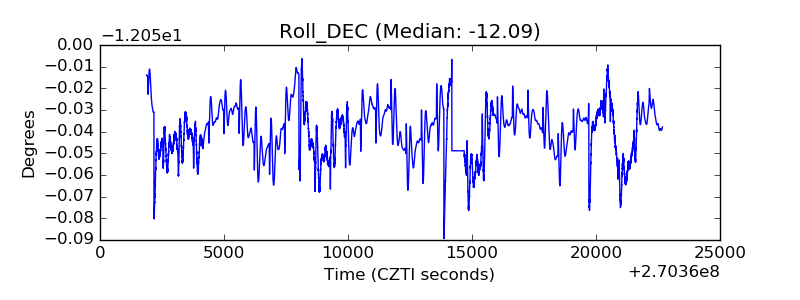 |
| _Roll_RA | 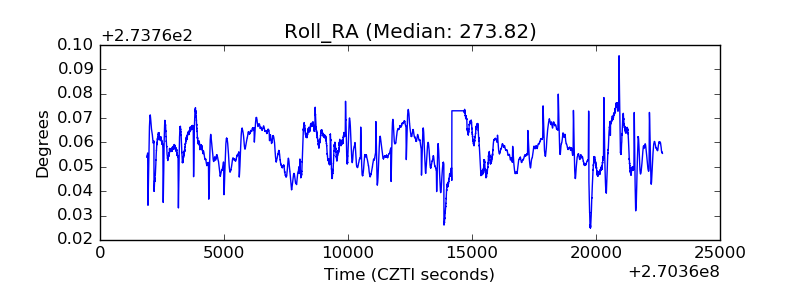 |
| Veto Counter | 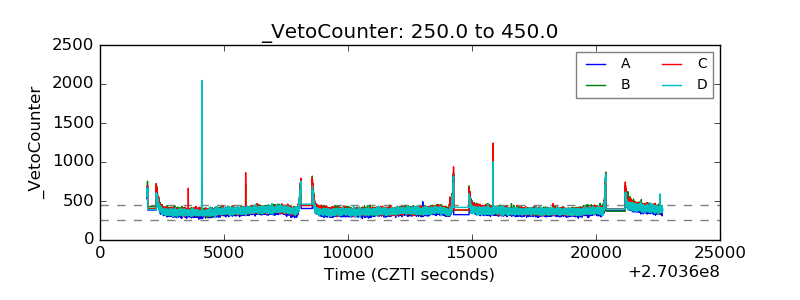 |