| Param | Original file | Final file |
|---|---|---|
| Filename | modeM0/AS1A04_223T01_9000002258_15295cztM0_level2.evt | modeM0/AS1A04_223T01_9000002258_15295cztM0_level2_quad_clean.evt |
| Size (bytes) | 484,228,800 | 90,613,440 |
| Size | 461.8 MB | 86.4 MB |
| Events in quadrant A | 3,299,326 | 579,819 |
| Events in quadrant B | 3,905,040 | 586,069 |
| Events in quadrant C | 3,837,813 | 569,279 |
| Events in quadrant D | 3,176,028 | 550,233 |
| Mode SS | |||
|---|---|---|---|
| Quadrant | BADHDUFLAG | Total packets | Discarded packets |
| A | 0 | 134 | 0 |
| B | 0 | 134 | 0 |
| C | 0 | 134 | 0 |
| D | 0 | 134 | 0 |
| Mode M9 | |||
|---|---|---|---|
| Quadrant | BADHDUFLAG | Total packets | Discarded packets |
| A | 0 | 20 | 0 |
| B | 0 | 20 | 0 |
| C | 0 | 20 | 0 |
| D | 0 | 20 | 0 |
| Mode M0 | |||
|---|---|---|---|
| Quadrant | BADHDUFLAG | Total packets | Discarded packets |
| A | 0 | 13995 | 3 |
| B | 0 | 15713 | 2 |
| C | 0 | 15691 | 2 |
| D | 0 | 13792 | 2 |
| Quadrant | Total seconds | Saturated seconds | Saturation percentage |
|---|---|---|---|
| A | 6584 | 121 | 1.837789% |
| B | 6584 | 257 | 3.903402% |
| C | 6584 | 110 | 1.670717% |
| D | 6584 | 107 | 1.625152% |
Noise dominated data is calculated using 1-second bins in cleaned event files. If a bin has >2000 counts, and if more than 50% of those come from <1% of pixels, then it is considered to be noise-dominated and hence unusable.
| Quadrant | # 1 sec bins | Bins with >0 counts | Bins with >2000 counts | High rate bins dominated by noise | Noise dominated (total time) | Noise dominated (detector-on time) | Marked lightcurve |
|---|---|---|---|---|---|---|---|
| A | 8570 | 6585 | 2 | 2 | 0.02% | 0.03% | 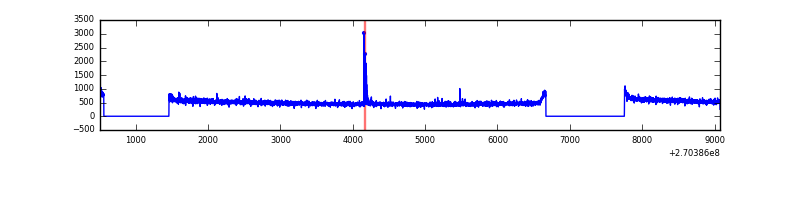 |
| B | 8570 | 6586 | 63 | 63 | 0.74% | 0.96% | 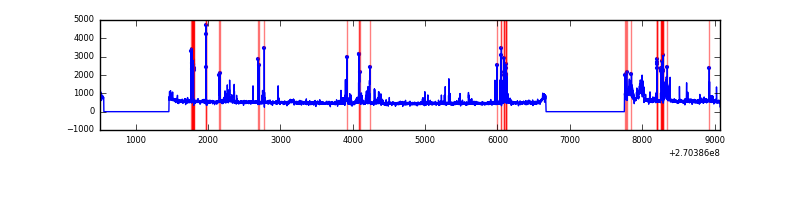 |
| C | 8570 | 6586 | 9 | 9 | 0.11% | 0.14% | 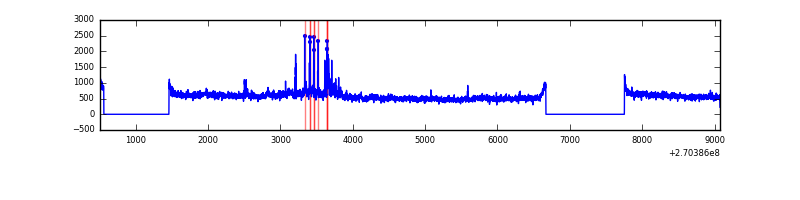 |
| D | 8570 | 6585 | 2 | 2 | 0.02% | 0.03% | 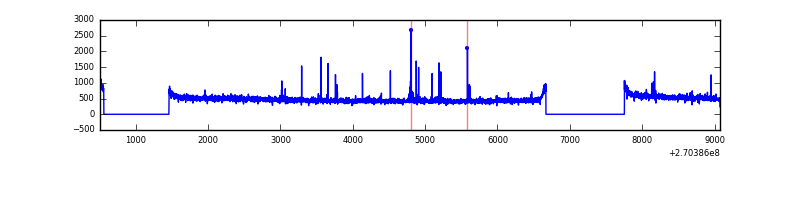 |
Top three noisy pixels from each quadrant. If the there are fewer than three noisy pixels in the level2.evt file, extra rows are filled as -1
| Pixel properties | Quadrant properties | ||||||
|---|---|---|---|---|---|---|---|
| Quadrant | DetID | PixID | Counts | Sigma | Mean | Median | Sigma |
| A | 9 | 143 | 33719 | 190.99 | 849 | 831 | 172.2 |
| A | 0 | 226 | 7487 | 38.65 | 849 | 831 | 172.2 |
| A | 12 | 194 | 6390 | 32.28 | 849 | 831 | 172.2 |
| B | 10 | 16 | 484348 | 3023.92 | 835 | 815 | 159.9 |
| B | 3 | 64 | 66404 | 410.18 | 835 | 815 | 159.9 |
| B | 0 | 205 | 28984 | 176.16 | 835 | 815 | 159.9 |
| C | 3 | 233 | 470257 | 2486.65 | 814 | 817 | 188.8 |
| C | 3 | 9 | 186222 | 982.1 | 814 | 817 | 188.8 |
| C | 7 | 247 | 6724 | 31.29 | 814 | 817 | 188.8 |
| D | 2 | 234 | 24522 | 118.47 | 822 | 798 | 200.3 |
| D | 7 | 38 | 19153 | 91.66 | 822 | 798 | 200.3 |
| D | 10 | 70 | 13500 | 63.43 | 822 | 798 | 200.3 |
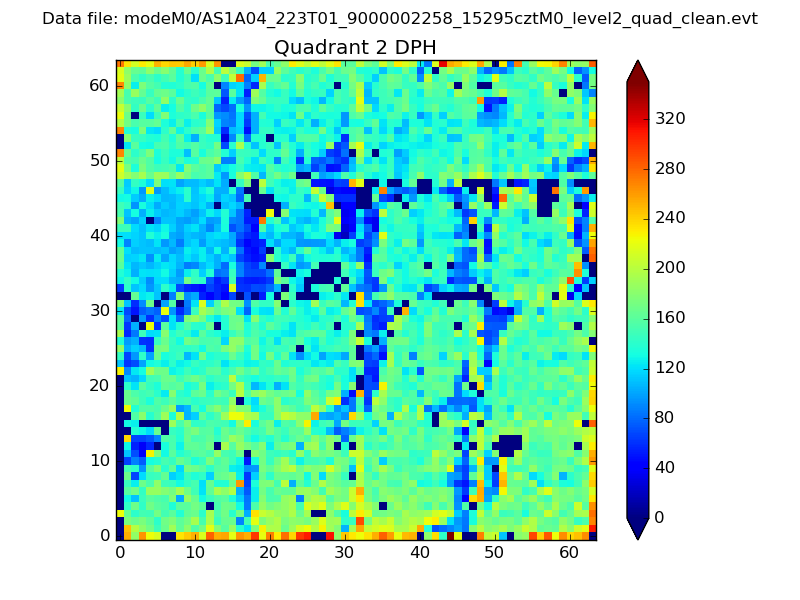
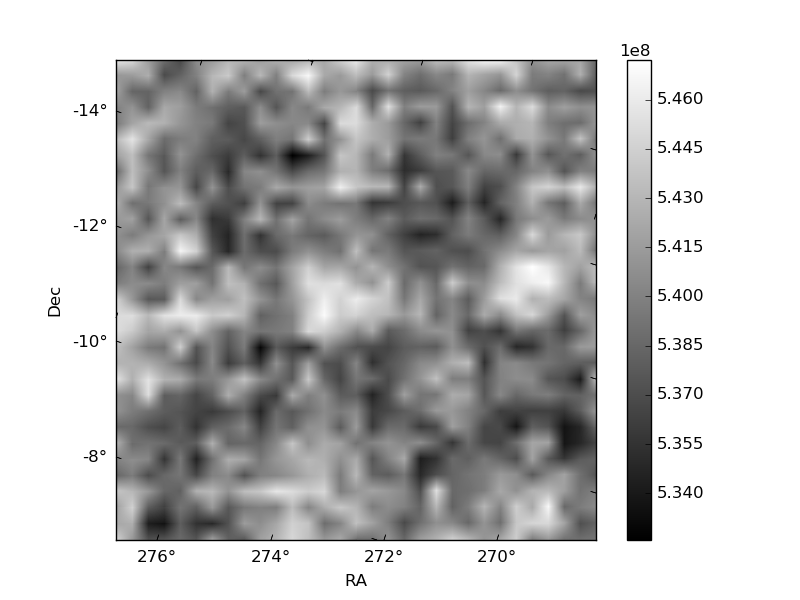
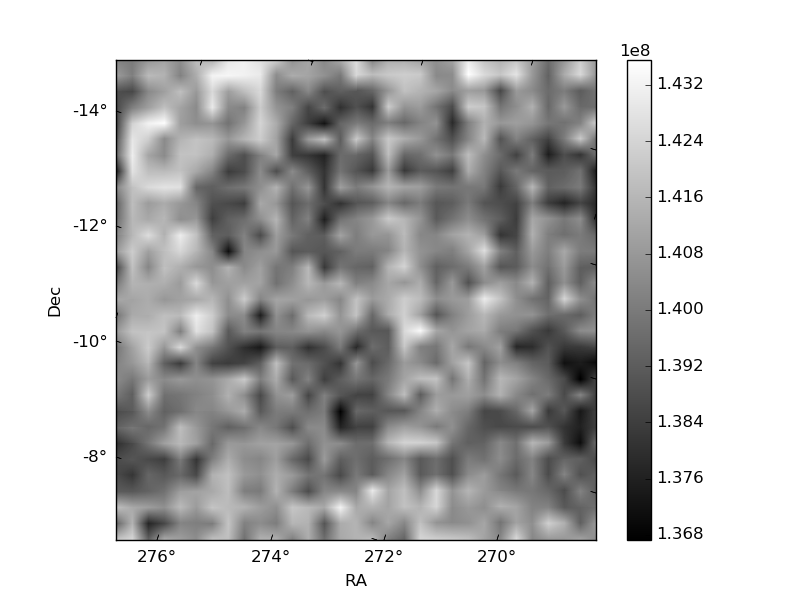
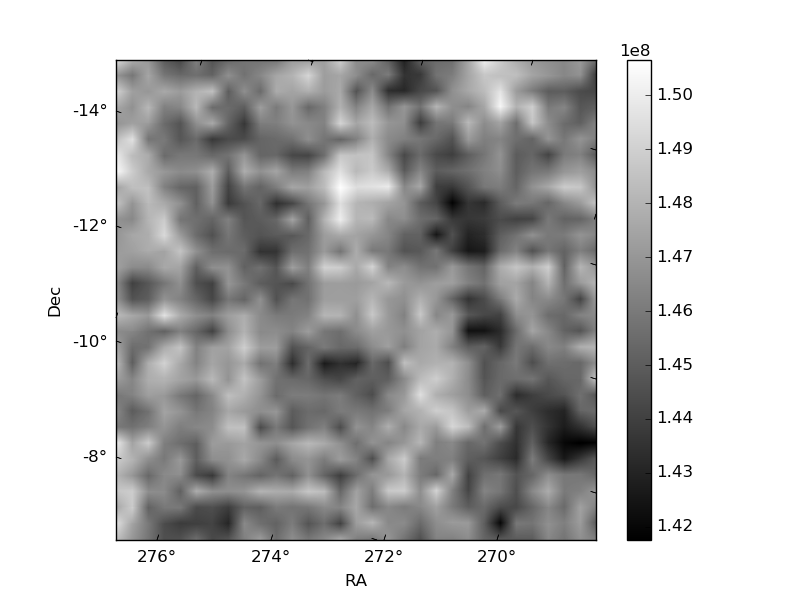
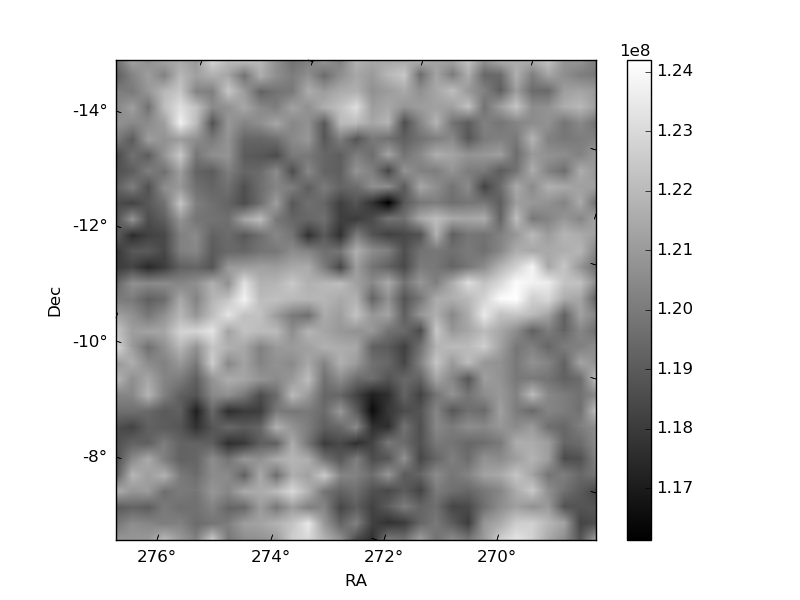
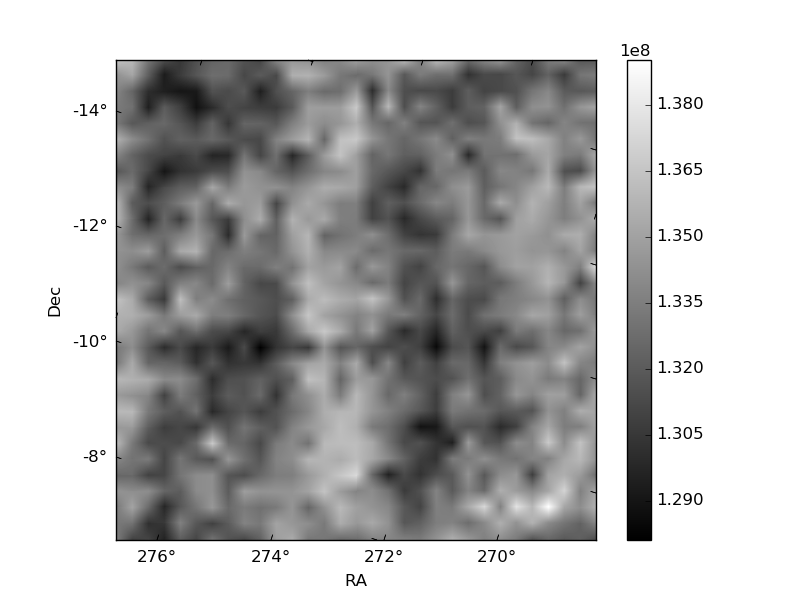
Histogram calculated using DETX and DETY for each event in the final _common_clean file
| Quadrant A | 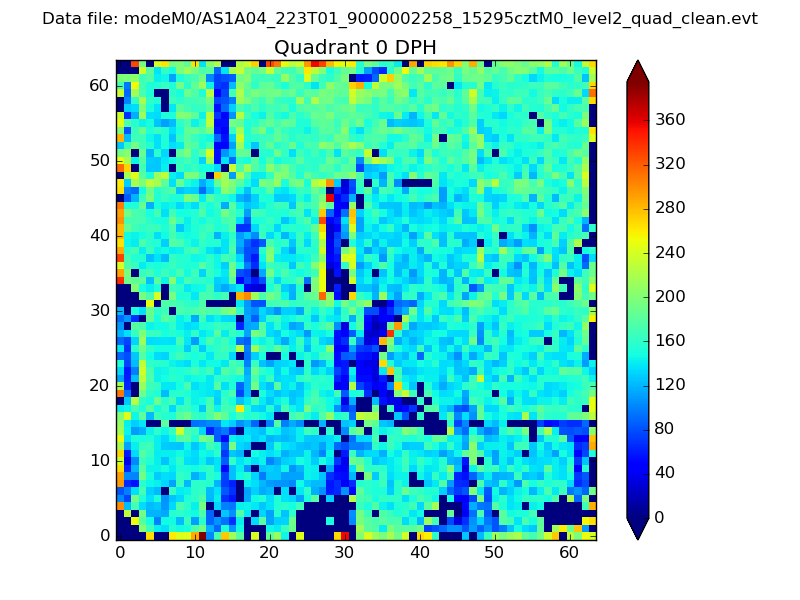 |
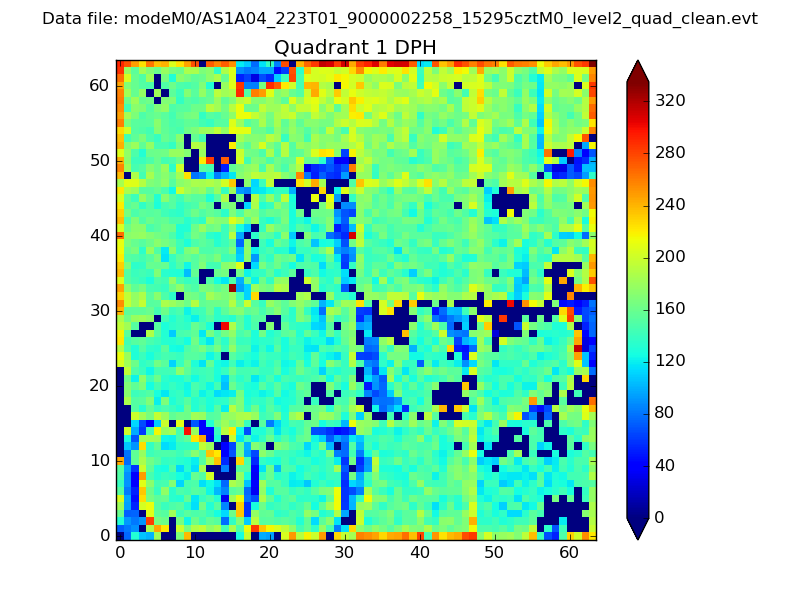 |
Quadrant B |
|---|---|---|---|
| Quadrant D | 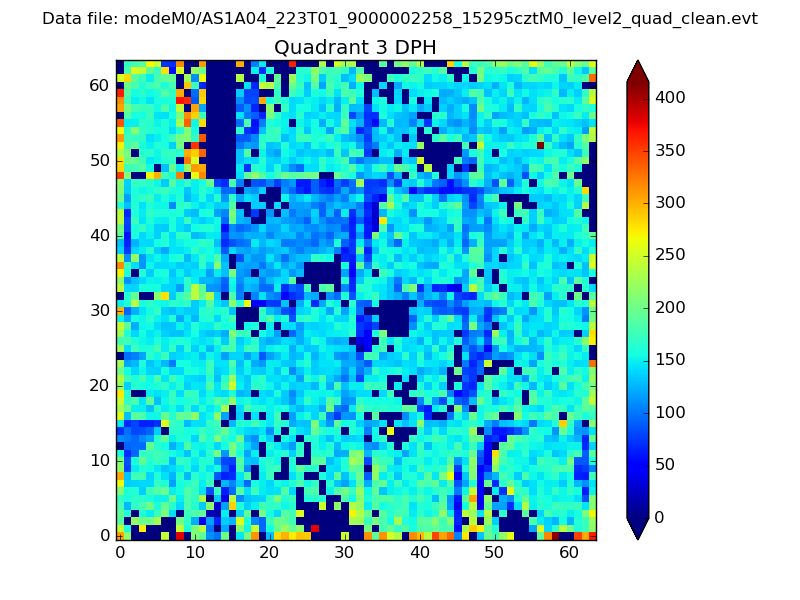 |
 |
Quadrant C |
| Plot type | Count rate plots | Images |
|---|---|---|
| Comparison with Poisson distribution Blue bars denote a histogram of data divided into 1 sec bins. Red curve is a Poisson curve with rate = median count rate of data. |
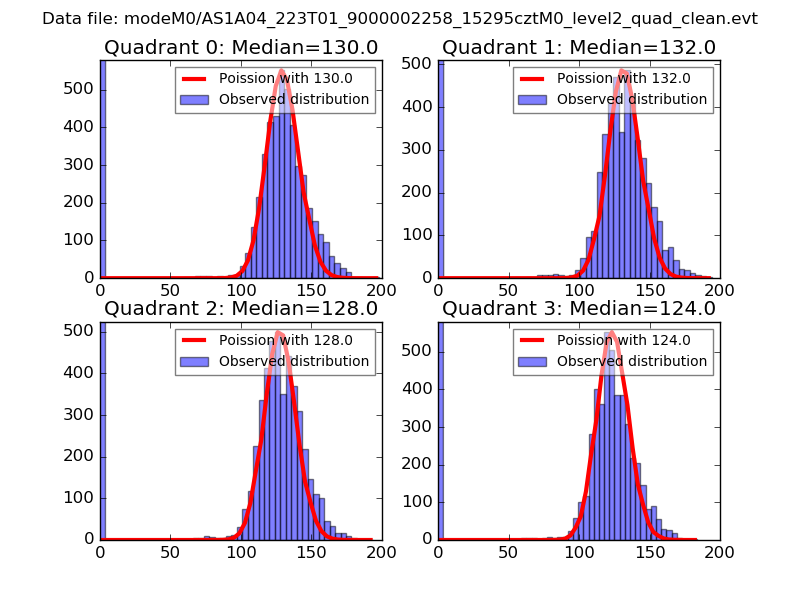 |
 |
| Quadrant-wise count rates Data is divided into 100 sec bins |
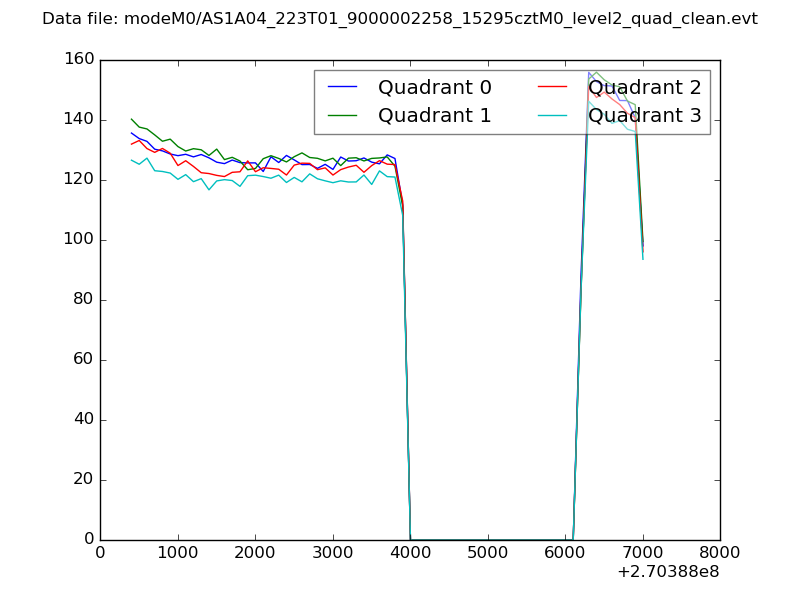 |
|
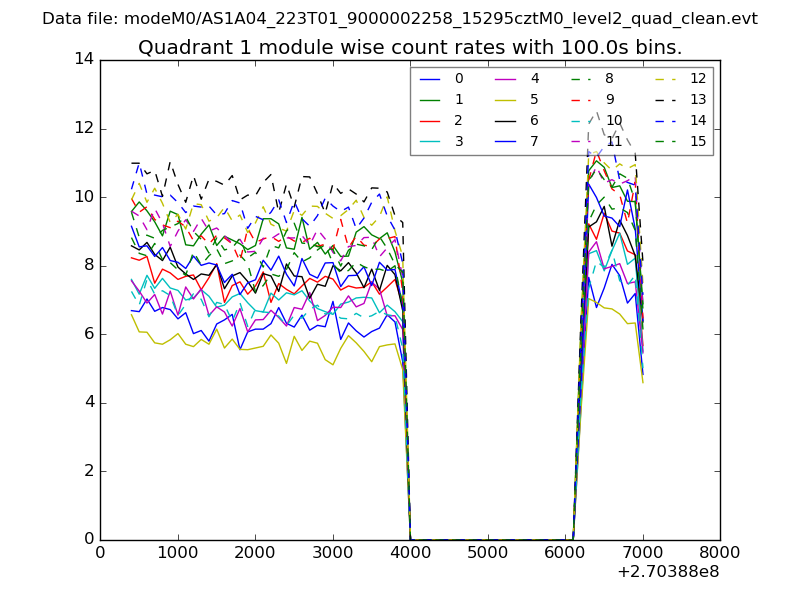
| Module-wise count rates for Quadrant A Data is divided into 100 sec bins |
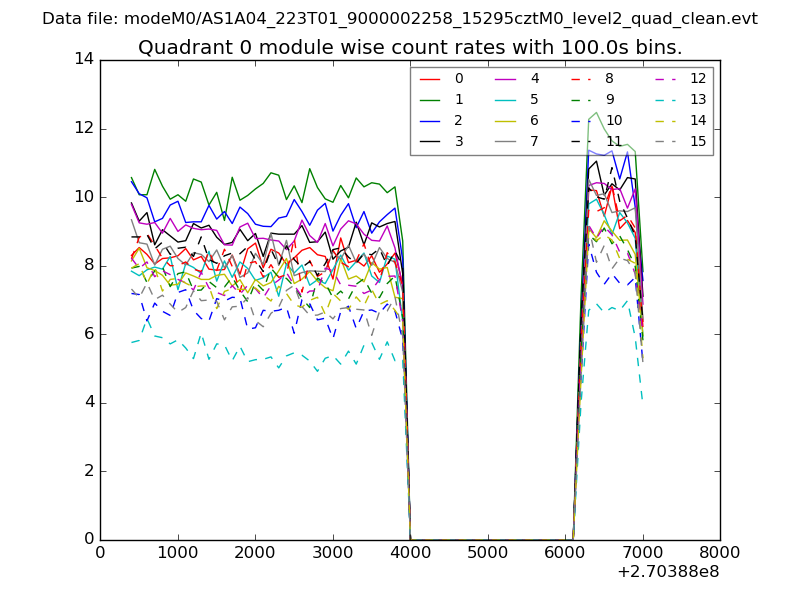 |
 |
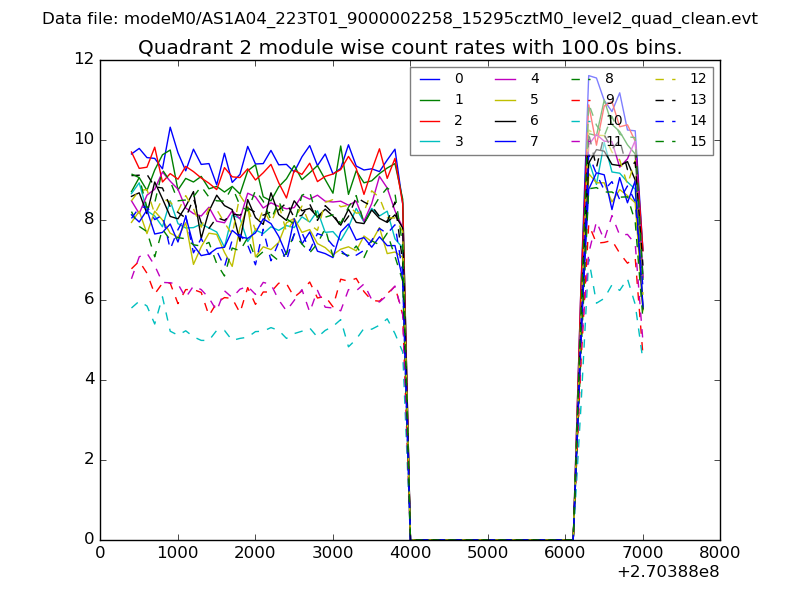
| Module-wise count rates for Quadrant B Data is divided into 100 sec bins |
 |
 |
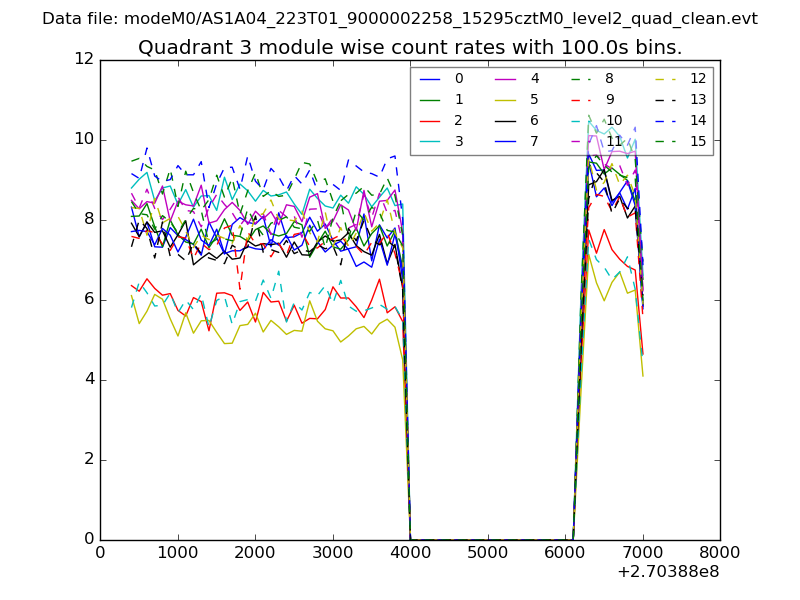
| Module-wise count rates for Quadrant C Data is divided into 100 sec bins |
 |
 |
| Module-wise count rates for Quadrant D Data is divided into 100 sec bins |
 |
 |
| Parameter | Plot |
|---|---|
| CZT HV Monitor | 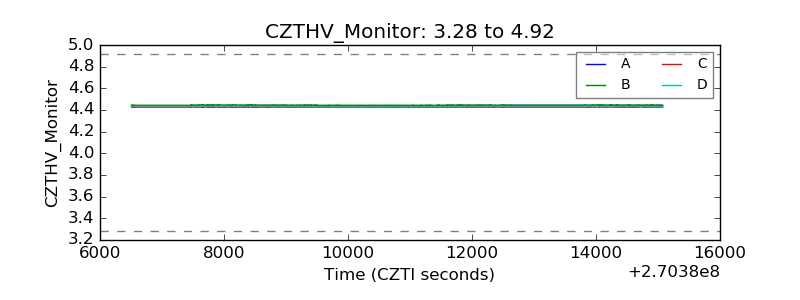 |
| D_VDD | 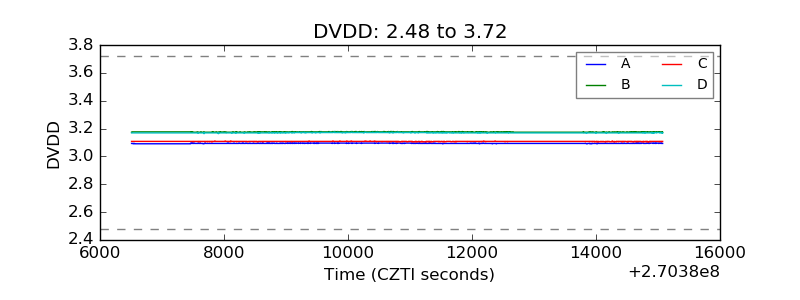 |
| Temperature 1 | 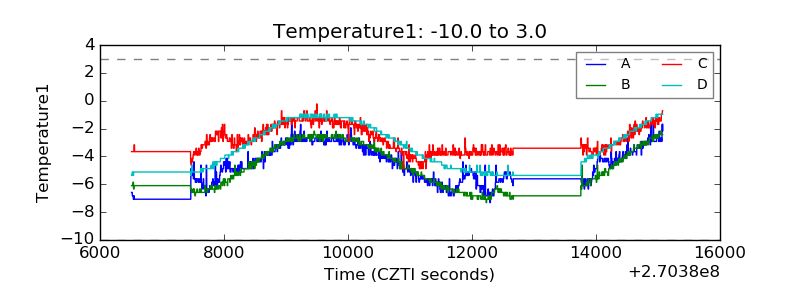 |
| Veto HV Monitor | 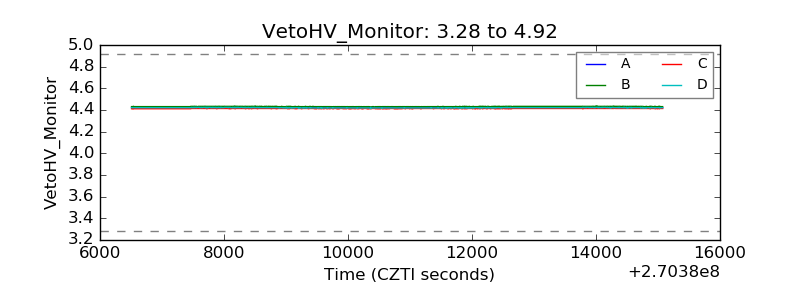 |
| Veto LLD |  |
| Alpha Counter | 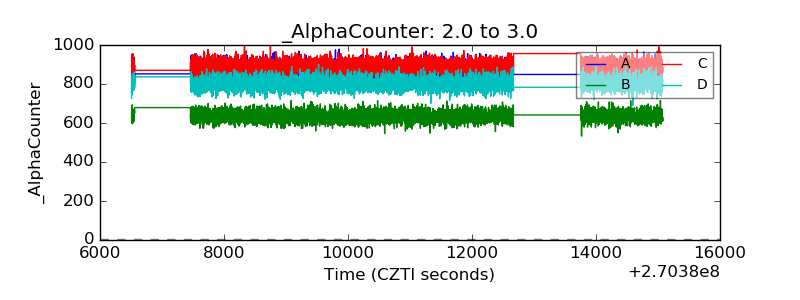 |
| _CPM_Rate | 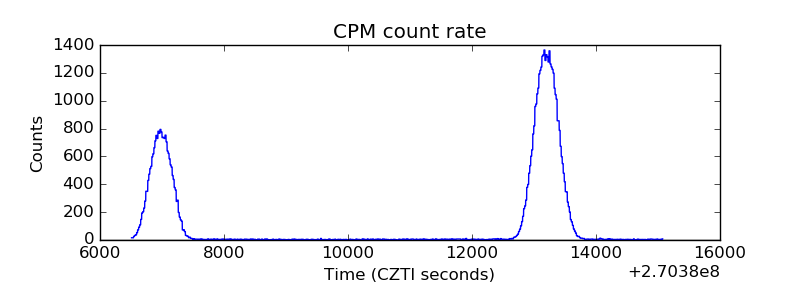 |
| CZT Counter | 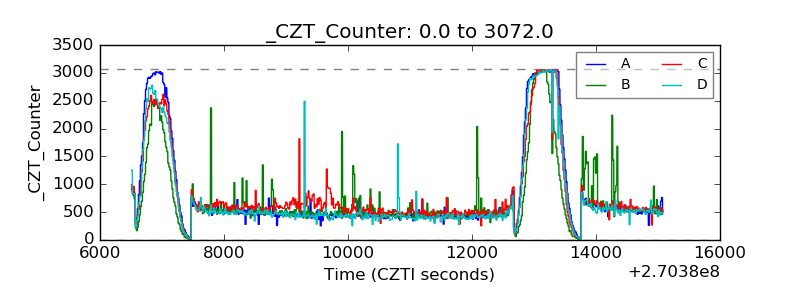 |
| +2.5 Volts monitor |  |
| +5 Volts monitor | 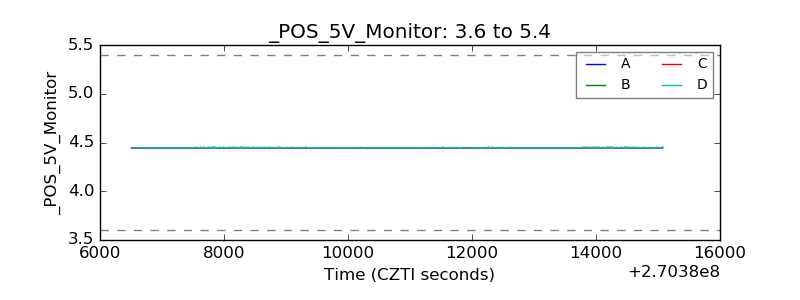 |
| _ROLL_ROT |  |
| _Roll_DEC |  |
| _Roll_RA | 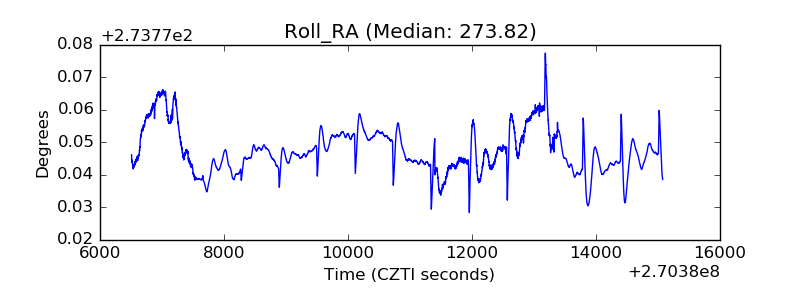 |
| Veto Counter | 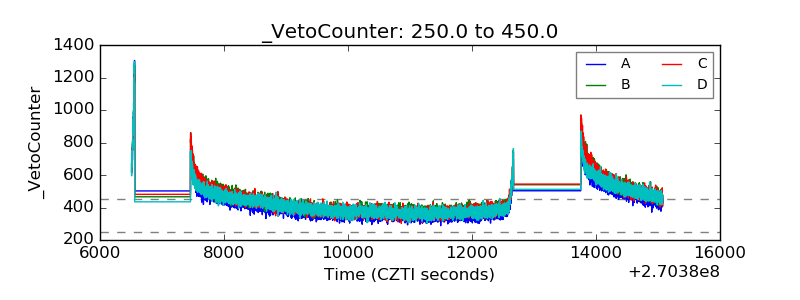 |