| Param | Original file | Final file |
|---|---|---|
| Filename | modeM0/AS1A04_223T01_9000002258_15297cztM0_level2.evt | modeM0/AS1A04_223T01_9000002258_15297cztM0_level2_quad_clean.evt |
| Size (bytes) | 455,688,000 | 107,470,080 |
| Size | 434.6 MB | 102.5 MB |
| Events in quadrant A | 3,077,326 | 722,919 |
| Events in quadrant B | 3,977,278 | 720,948 |
| Events in quadrant C | 3,242,141 | 705,626 |
| Events in quadrant D | 3,089,763 | 679,763 |
| Mode SS | |||
|---|---|---|---|
| Quadrant | BADHDUFLAG | Total packets | Discarded packets |
| A | 0 | 124 | 0 |
| B | 0 | 124 | 0 |
| C | 0 | 124 | 0 |
| D | 0 | 124 | 0 |
| Mode M9 | |||
|---|---|---|---|
| Quadrant | BADHDUFLAG | Total packets | Discarded packets |
| A | 0 | 12 | 0 |
| B | 0 | 12 | 0 |
| C | 0 | 12 | 0 |
| D | 0 | 12 | 0 |
| Mode M0 | |||
|---|---|---|---|
| Quadrant | BADHDUFLAG | Total packets | Discarded packets |
| A | 0 | 13087 | 2 |
| B | 0 | 15814 | 1 |
| C | 0 | 13321 | 1 |
| D | 0 | 13167 | 1 |
| Quadrant | Total seconds | Saturated seconds | Saturation percentage |
|---|---|---|---|
| A | 6097 | 63 | 1.033295% |
| B | 6097 | 233 | 3.821552% |
| C | 6097 | 46 | 0.754469% |
| D | 6097 | 56 | 0.918485% |
Noise dominated data is calculated using 1-second bins in cleaned event files. If a bin has >2000 counts, and if more than 50% of those come from <1% of pixels, then it is considered to be noise-dominated and hence unusable.
| Quadrant | # 1 sec bins | Bins with >0 counts | Bins with >2000 counts | High rate bins dominated by noise | Noise dominated (total time) | Noise dominated (detector-on time) | Marked lightcurve |
|---|---|---|---|---|---|---|---|
| A | 7288 | 6098 | 1 | 1 | 0.01% | 0.02% | 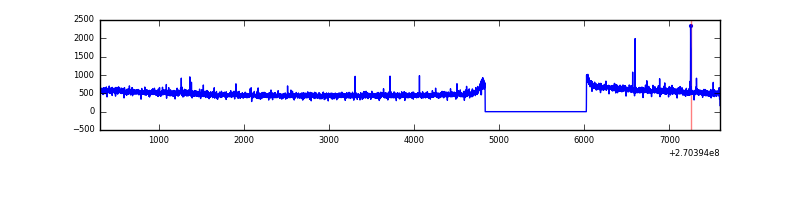 |
| B | 7288 | 6099 | 150 | 150 | 2.06% | 2.46% | 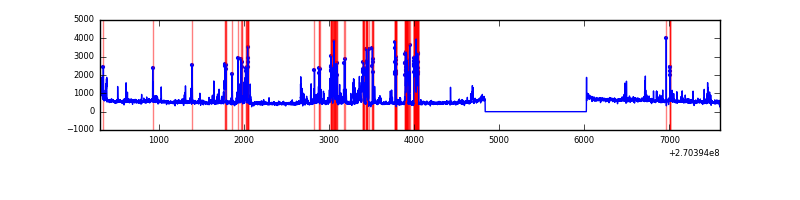 |
| C | 7288 | 6099 | 0 | 0 | 0.00% | 0.00% | 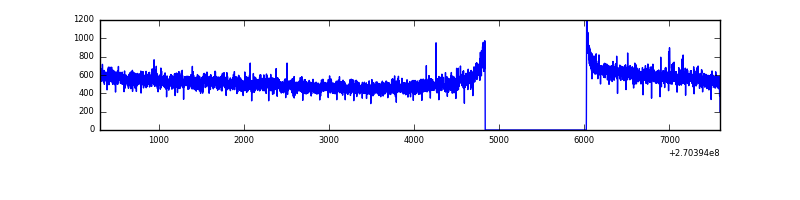 |
| D | 7288 | 6099 | 11 | 11 | 0.15% | 0.18% | 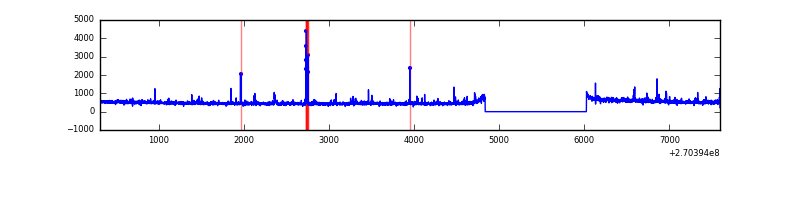 |
Top three noisy pixels from each quadrant. If the there are fewer than three noisy pixels in the level2.evt file, extra rows are filled as -1
| Pixel properties | Quadrant properties | ||||||
|---|---|---|---|---|---|---|---|
| Quadrant | DetID | PixID | Counts | Sigma | Mean | Median | Sigma |
| A | 9 | 143 | 24998 | 150.9 | 794 | 780 | 160.5 |
| A | 0 | 226 | 7170 | 39.82 | 794 | 780 | 160.5 |
| A | 12 | 194 | 6051 | 32.84 | 794 | 780 | 160.5 |
| B | 10 | 16 | 784175 | 5368.77 | 774 | 757 | 145.9 |
| B | 0 | 205 | 33955 | 227.51 | 774 | 757 | 145.9 |
| B | 3 | 209 | 32699 | 218.9 | 774 | 757 | 145.9 |
| C | 3 | 233 | 286115 | 1647.25 | 756 | 762 | 173.2 |
| C | 7 | 247 | 6993 | 35.97 | 756 | 762 | 173.2 |
| C | 13 | 61 | 5346 | 26.46 | 756 | 762 | 173.2 |
| D | 7 | 38 | 43773 | 231.89 | 767 | 745 | 185.5 |
| D | 5 | 222 | 40528 | 214.4 | 767 | 745 | 185.5 |
| D | 8 | 195 | 39216 | 207.33 | 767 | 745 | 185.5 |
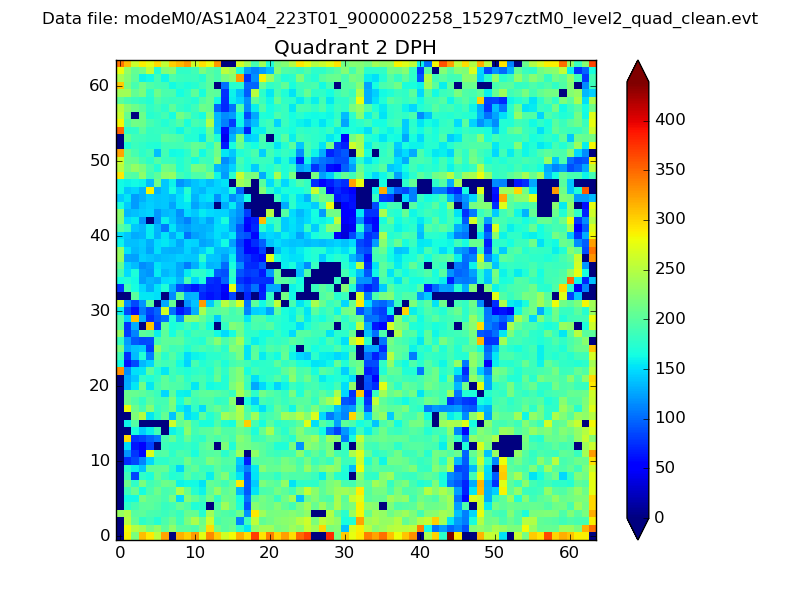
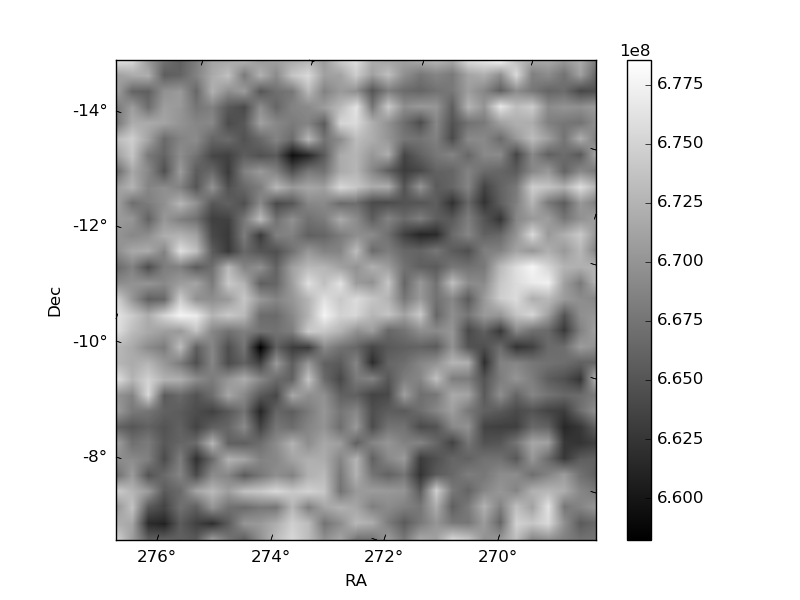
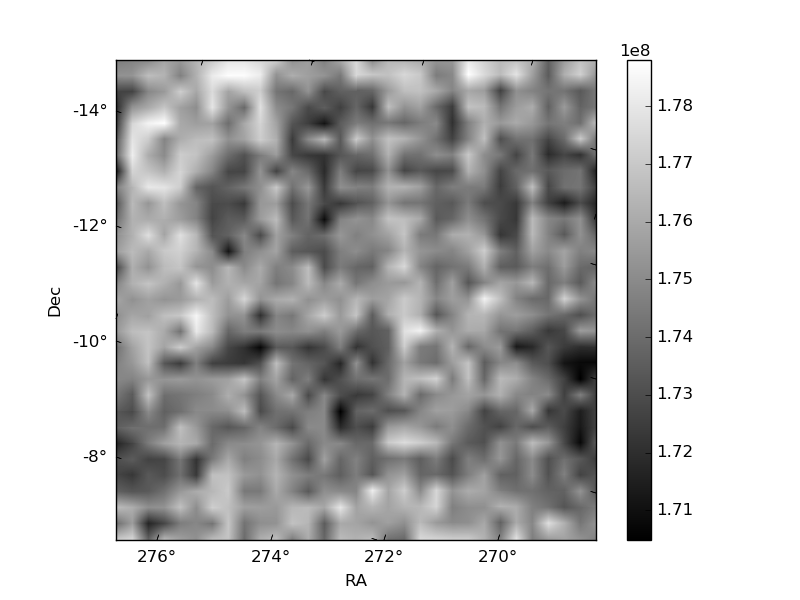
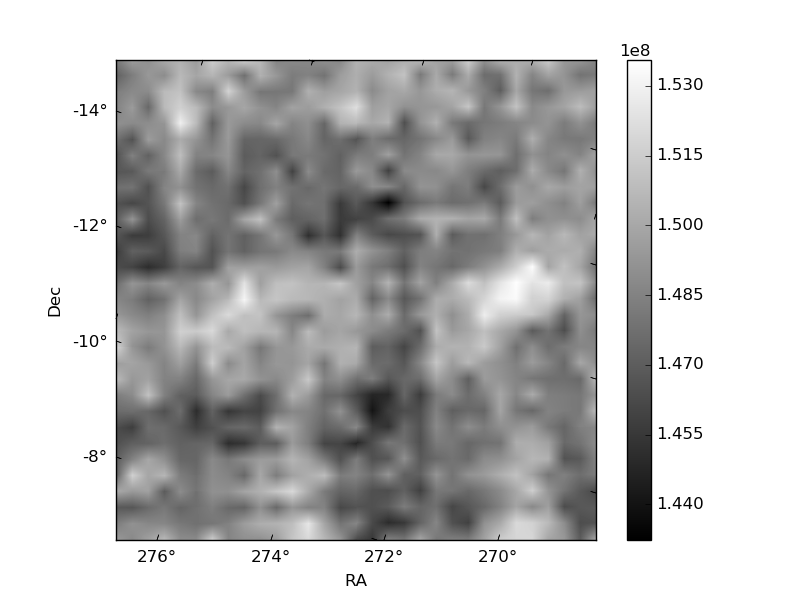
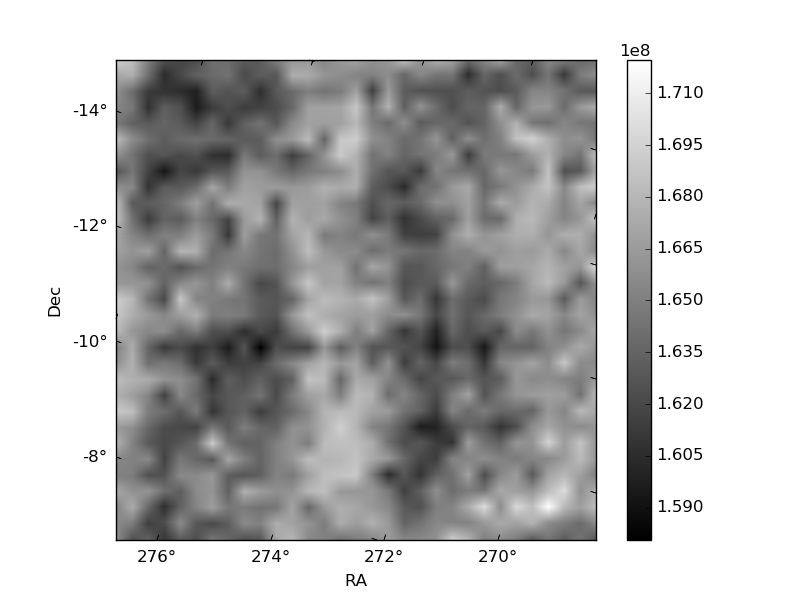
Histogram calculated using DETX and DETY for each event in the final _common_clean file
| Quadrant A | 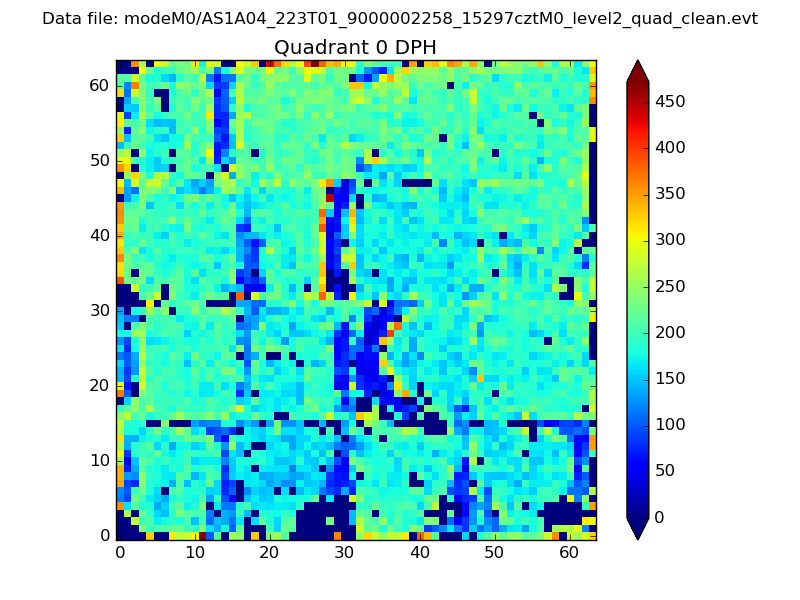 |
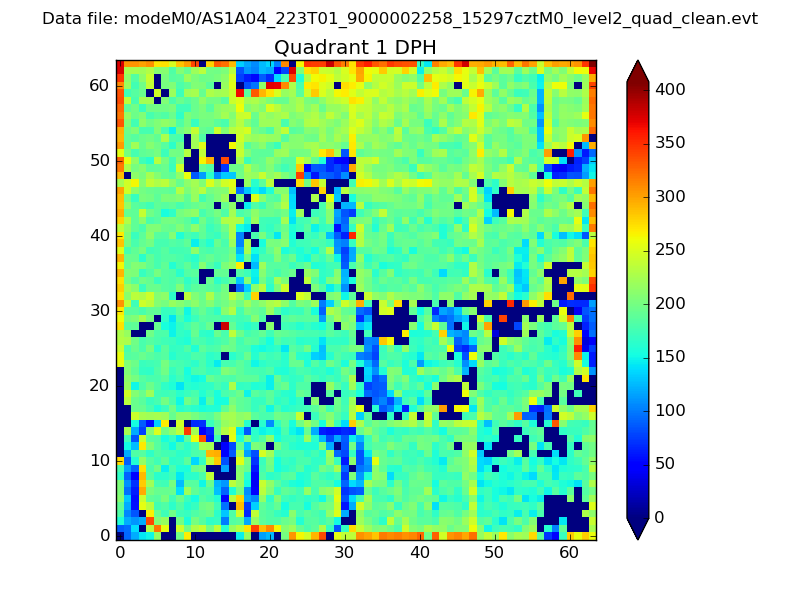 |
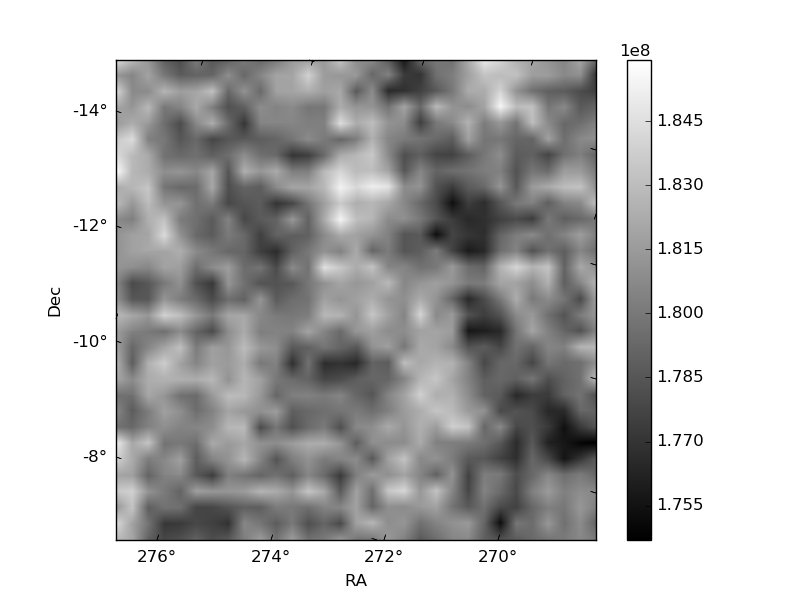
Quadrant B |
|---|---|---|---|
| Quadrant D | 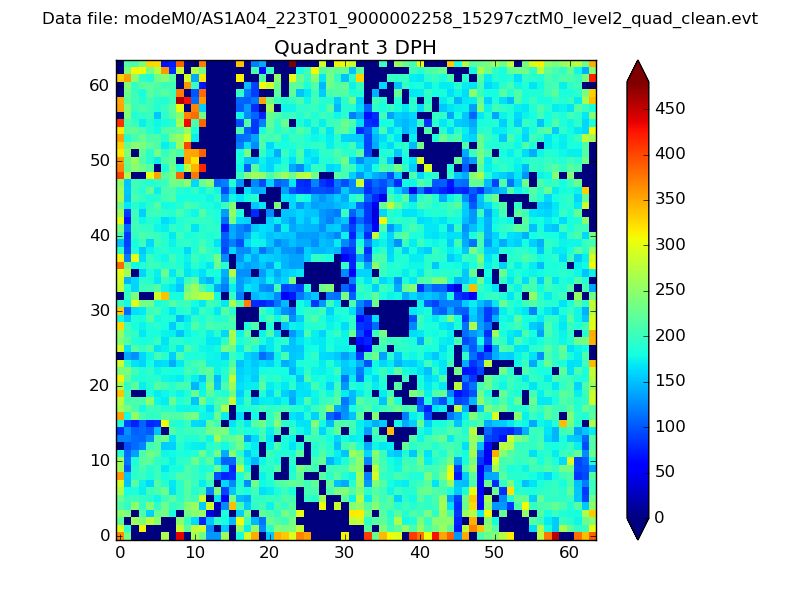 |
 |
Quadrant C |
| Plot type | Count rate plots | Images |
|---|---|---|
| Comparison with Poisson distribution Blue bars denote a histogram of data divided into 1 sec bins. Red curve is a Poisson curve with rate = median count rate of data. |
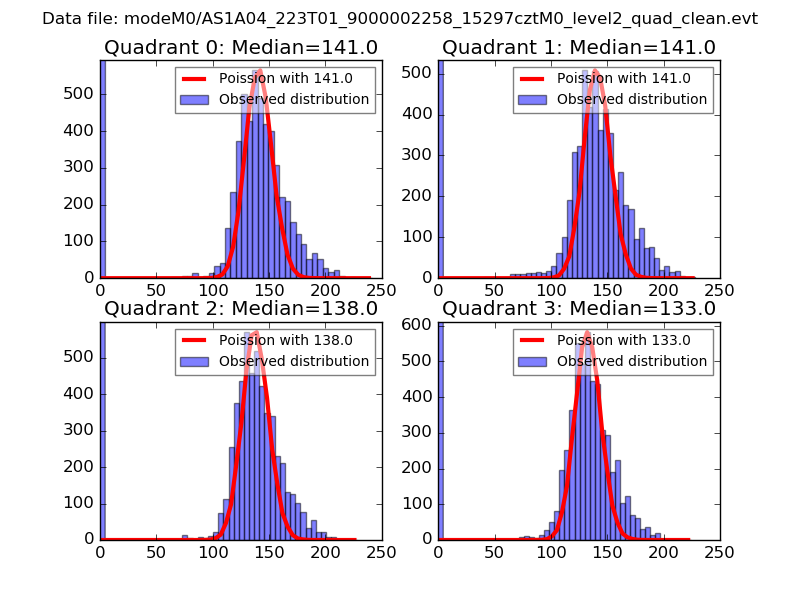 |
 |
| Quadrant-wise count rates Data is divided into 100 sec bins |
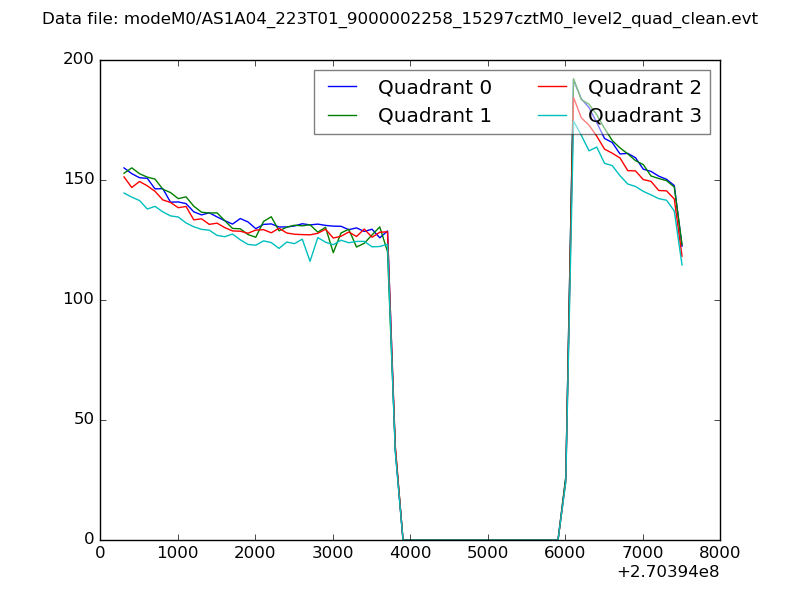 |
|
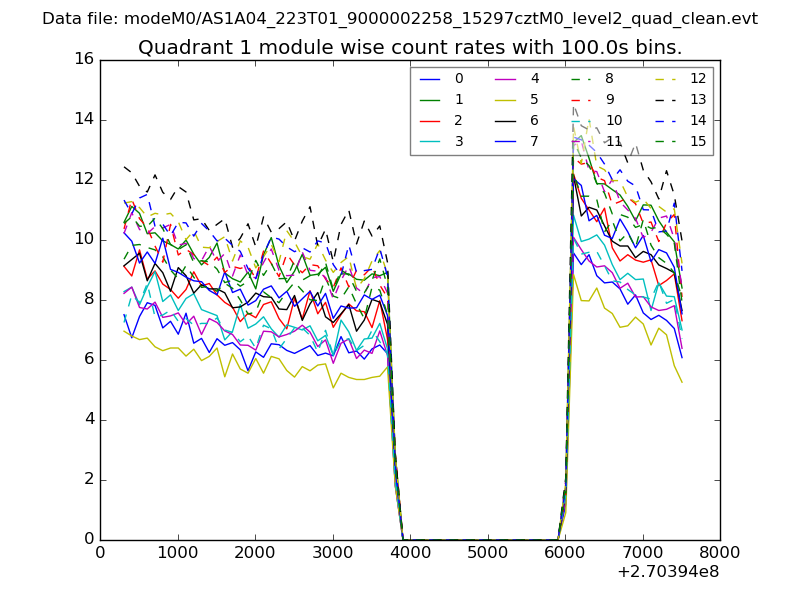
| Module-wise count rates for Quadrant A Data is divided into 100 sec bins |
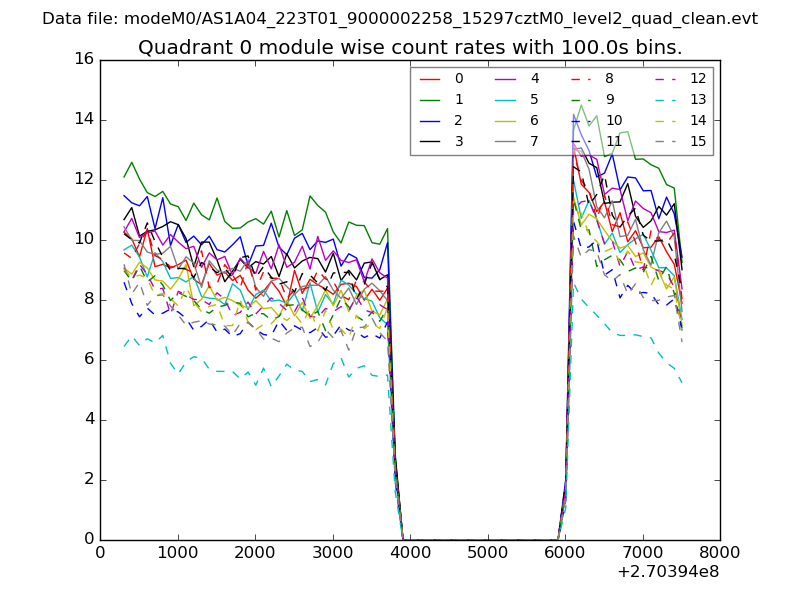 |
 |
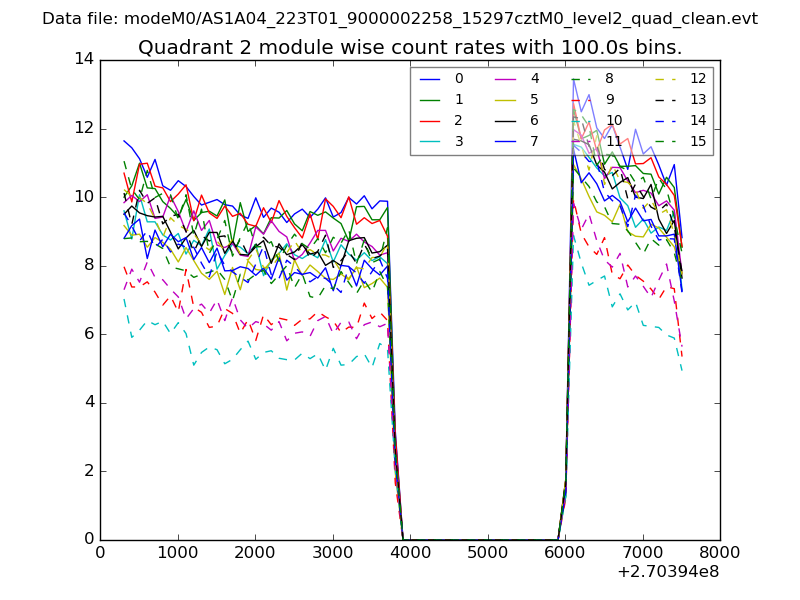
| Module-wise count rates for Quadrant B Data is divided into 100 sec bins |
 |
 |
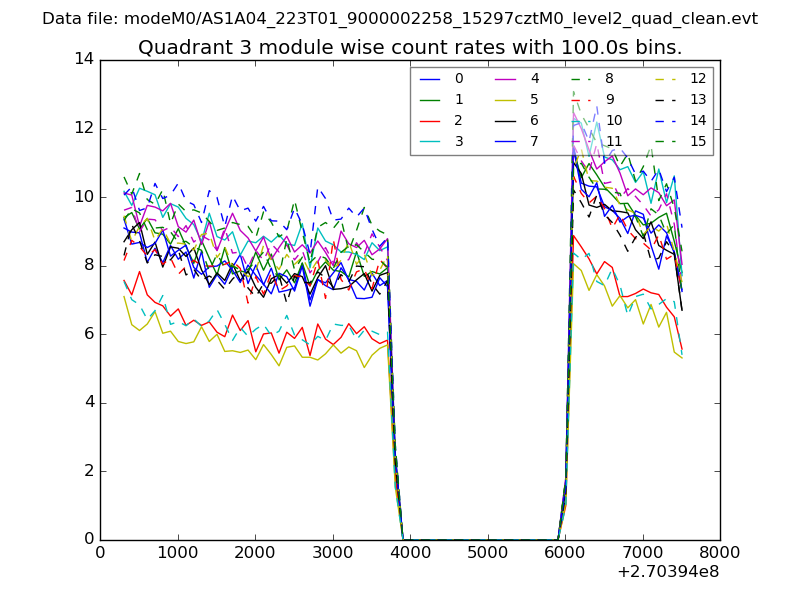
| Module-wise count rates for Quadrant C Data is divided into 100 sec bins |
 |
 |
| Module-wise count rates for Quadrant D Data is divided into 100 sec bins |
 |
 |
| Parameter | Plot |
|---|---|
| CZT HV Monitor | 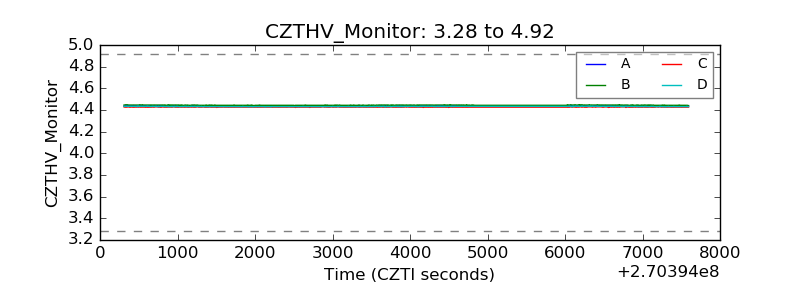 |
| D_VDD | 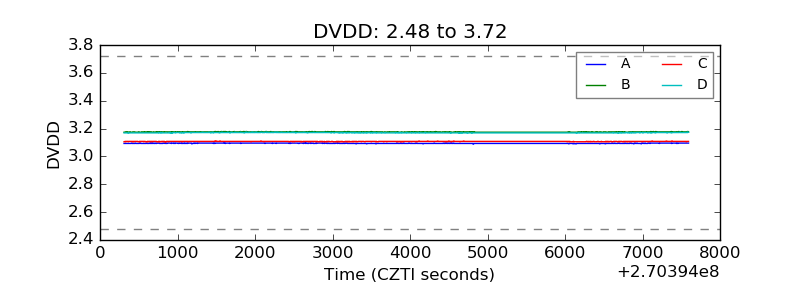 |
| Temperature 1 | 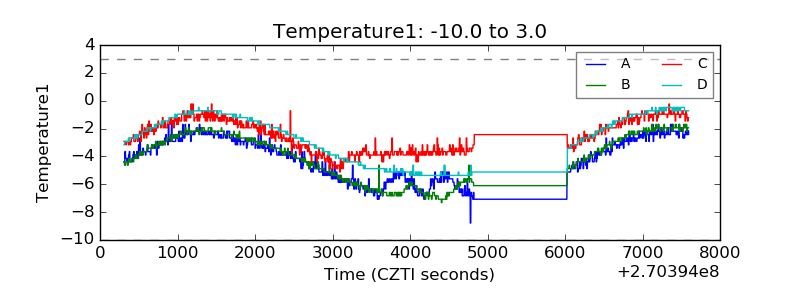 |
| Veto HV Monitor | 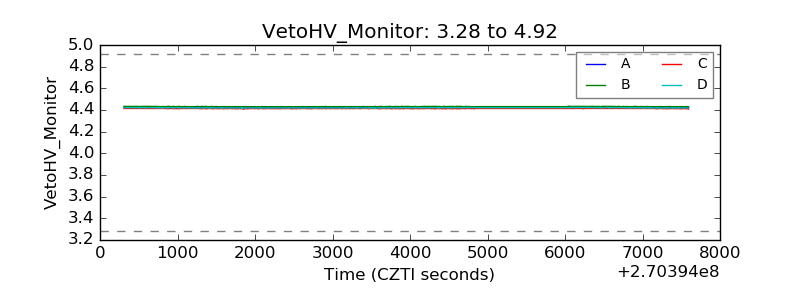 |
| Veto LLD | 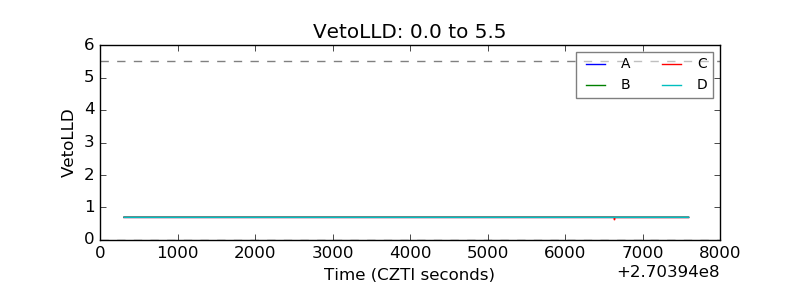 |
| Alpha Counter | 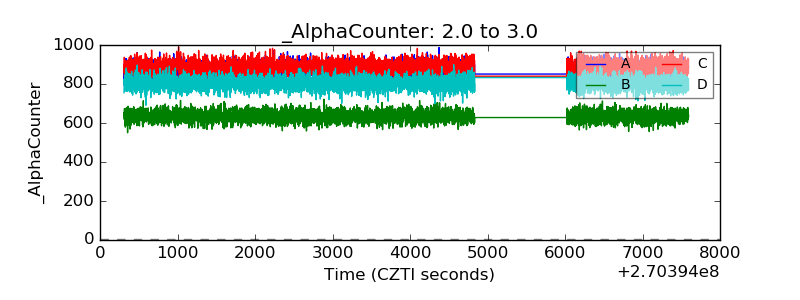 |
| _CPM_Rate | 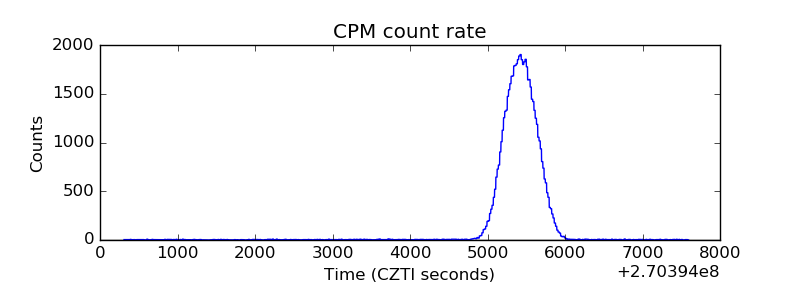 |
| CZT Counter | 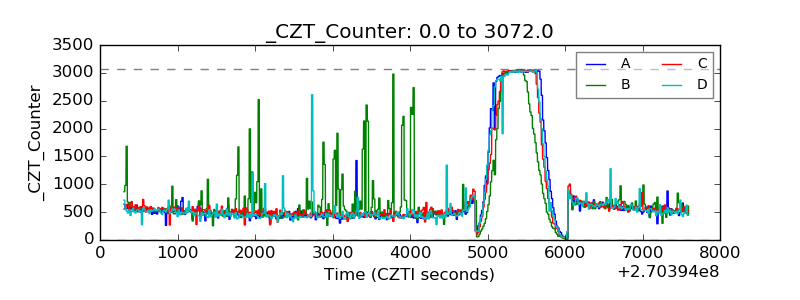 |
| +2.5 Volts monitor |  |
| +5 Volts monitor |  |
| _ROLL_ROT | 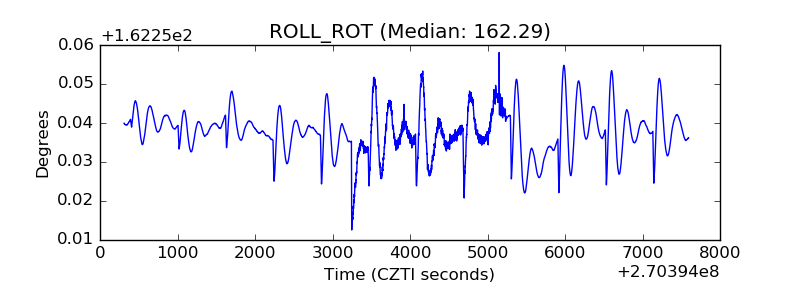 |
| _Roll_DEC | 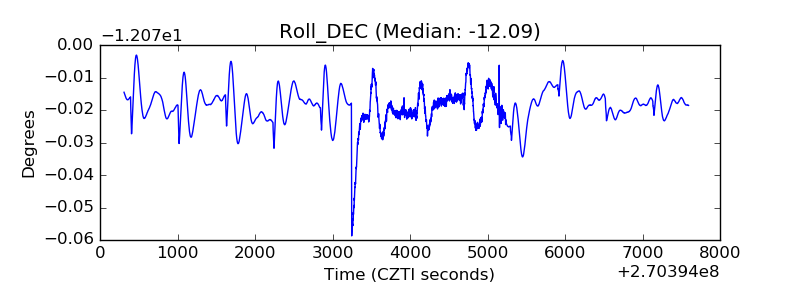 |
| _Roll_RA | 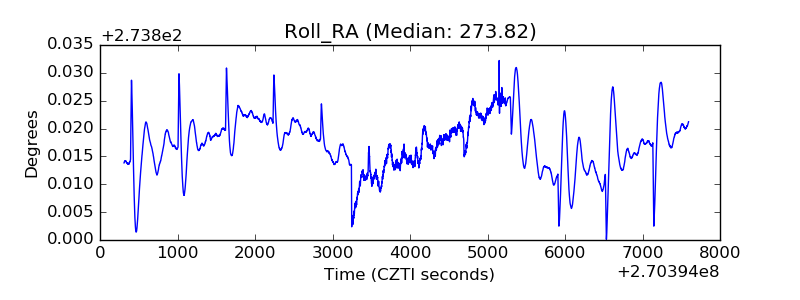 |
| Veto Counter | 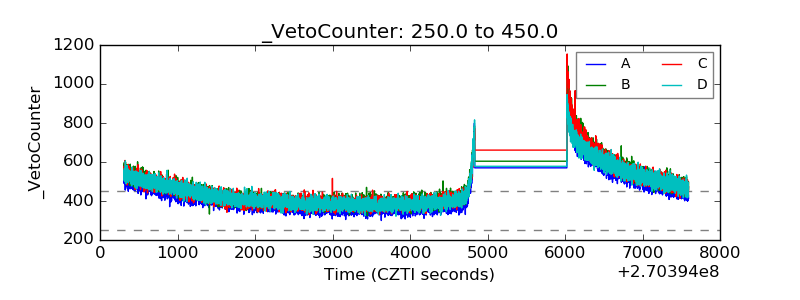 |