| Param | Original file | Final file |
|---|---|---|
| Filename | modeM0/AS1A04_223T01_9000002258_15299cztM0_level2.evt | modeM0/AS1A04_223T01_9000002258_15299cztM0_level2_quad_clean.evt |
| Size (bytes) | 507,672,000 | 108,135,360 |
| Size | 484.2 MB | 103.1 MB |
| Events in quadrant A | 3,321,422 | 727,114 |
| Events in quadrant B | 3,916,604 | 724,824 |
| Events in quadrant C | 4,031,323 | 700,213 |
| Events in quadrant D | 3,670,318 | 675,374 |
| Mode SS | |||
|---|---|---|---|
| Quadrant | BADHDUFLAG | Total packets | Discarded packets |
| A | 0 | 132 | 0 |
| B | 0 | 132 | 0 |
| C | 0 | 132 | 0 |
| D | 0 | 132 | 0 |
| Mode M9 | |||
|---|---|---|---|
| Quadrant | BADHDUFLAG | Total packets | Discarded packets |
| A | 0 | 18 | 0 |
| B | 0 | 18 | 0 |
| C | 0 | 18 | 0 |
| D | 0 | 19 | 0 |
| Mode M0 | |||
|---|---|---|---|
| Quadrant | BADHDUFLAG | Total packets | Discarded packets |
| A | 0 | 13973 | 3 |
| B | 0 | 15814 | 2 |
| C | 0 | 16304 | 2 |
| D | 0 | 15163 | 2 |
| Quadrant | Total seconds | Saturated seconds | Saturation percentage |
|---|---|---|---|
| A | 6408 | 84 | 1.310861% |
| B | 6408 | 172 | 2.684145% |
| C | 6408 | 231 | 3.604869% |
| D | 6408 | 215 | 3.355181% |
Noise dominated data is calculated using 1-second bins in cleaned event files. If a bin has >2000 counts, and if more than 50% of those come from <1% of pixels, then it is considered to be noise-dominated and hence unusable.
| Quadrant | # 1 sec bins | Bins with >0 counts | Bins with >2000 counts | High rate bins dominated by noise | Noise dominated (total time) | Noise dominated (detector-on time) | Marked lightcurve |
|---|---|---|---|---|---|---|---|
| A | 7729 | 6409 | 0 | 0 | 0.00% | 0.00% | 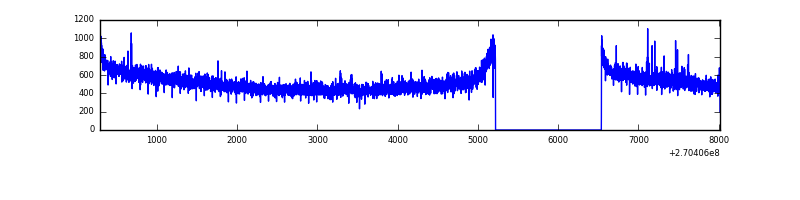 |
| B | 7729 | 6410 | 67 | 67 | 0.87% | 1.05% | 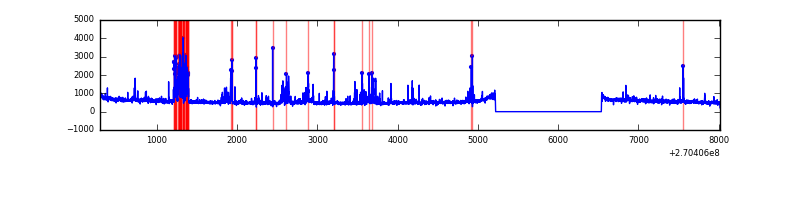 |
| C | 7729 | 6410 | 94 | 94 | 1.22% | 1.47% | 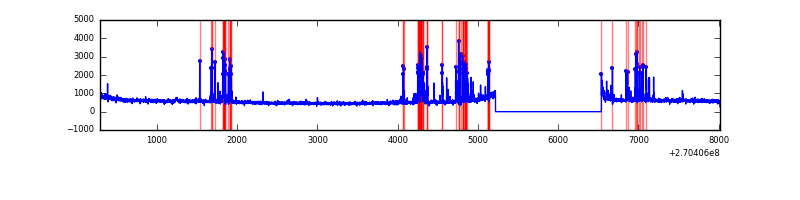 |
| D | 7729 | 6410 | 118 | 118 | 1.53% | 1.84% | 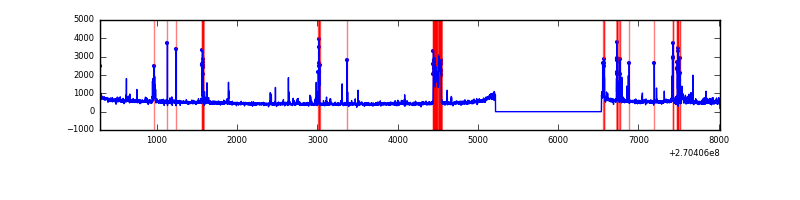 |
Top three noisy pixels from each quadrant. If the there are fewer than three noisy pixels in the level2.evt file, extra rows are filled as -1
| Pixel properties | Quadrant properties | ||||||
|---|---|---|---|---|---|---|---|
| Quadrant | DetID | PixID | Counts | Sigma | Mean | Median | Sigma |
| A | 9 | 143 | 13014 | 70.23 | 861 | 845 | 173.3 |
| A | 0 | 226 | 7922 | 40.84 | 861 | 845 | 173.3 |
| A | 12 | 194 | 6621 | 33.33 | 861 | 845 | 173.3 |
| B | 10 | 16 | 456528 | 2845.39 | 847 | 830 | 160.2 |
| B | 3 | 209 | 28512 | 172.85 | 847 | 830 | 160.2 |
| B | 3 | 64 | 27257 | 165.01 | 847 | 830 | 160.2 |
| C | 4 | 254 | 492210 | 2635.93 | 813 | 819 | 186.4 |
| C | 3 | 233 | 360347 | 1928.59 | 813 | 819 | 186.4 |
| C | 7 | 247 | 6636 | 31.2 | 813 | 819 | 186.4 |
| D | 2 | 33 | 270933 | 1361.75 | 822 | 799 | 198.4 |
| D | 10 | 70 | 82476 | 411.74 | 822 | 799 | 198.4 |
| D | 13 | 122 | 57475 | 285.71 | 822 | 799 | 198.4 |
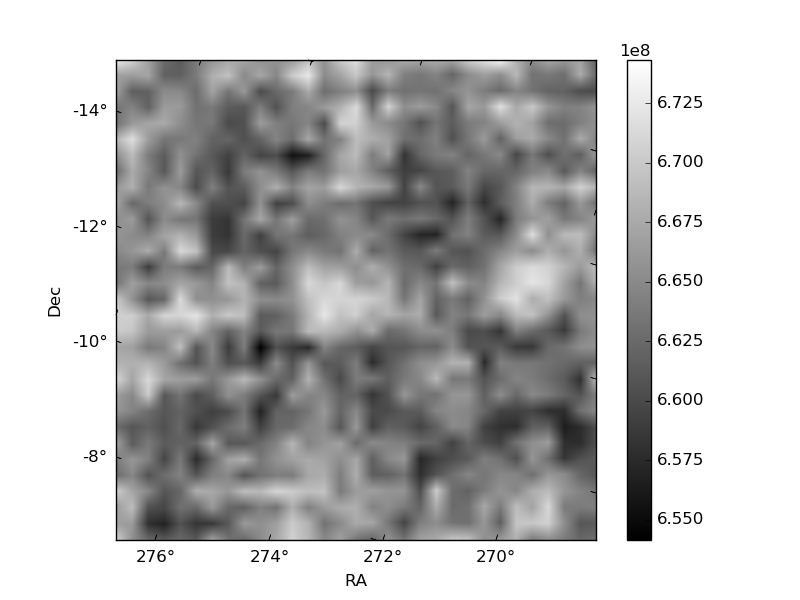
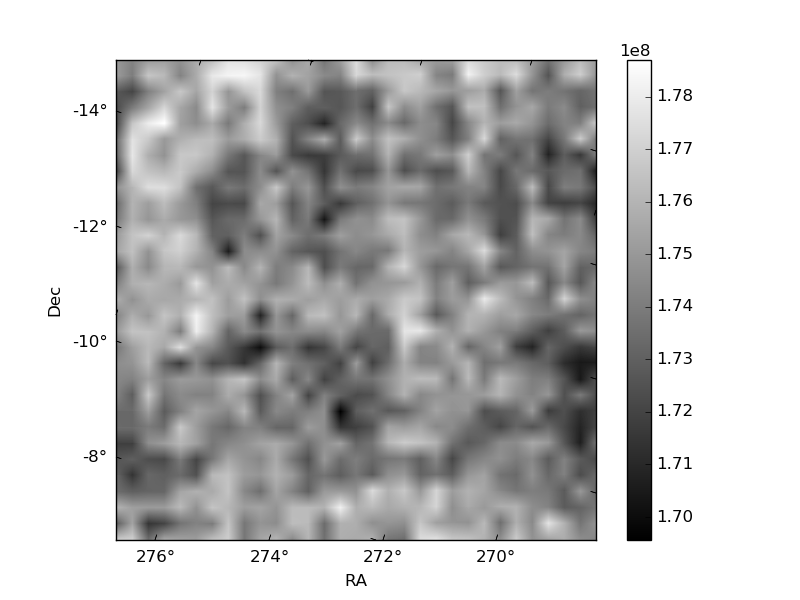
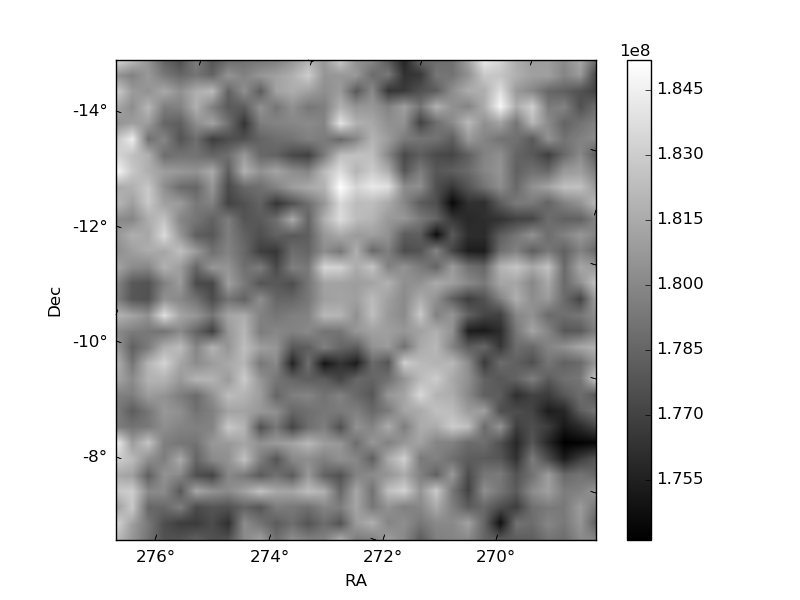
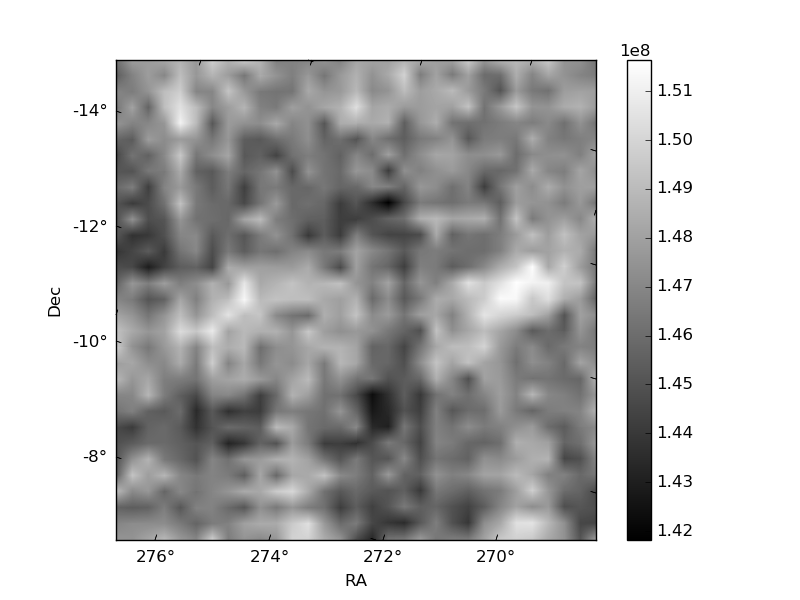
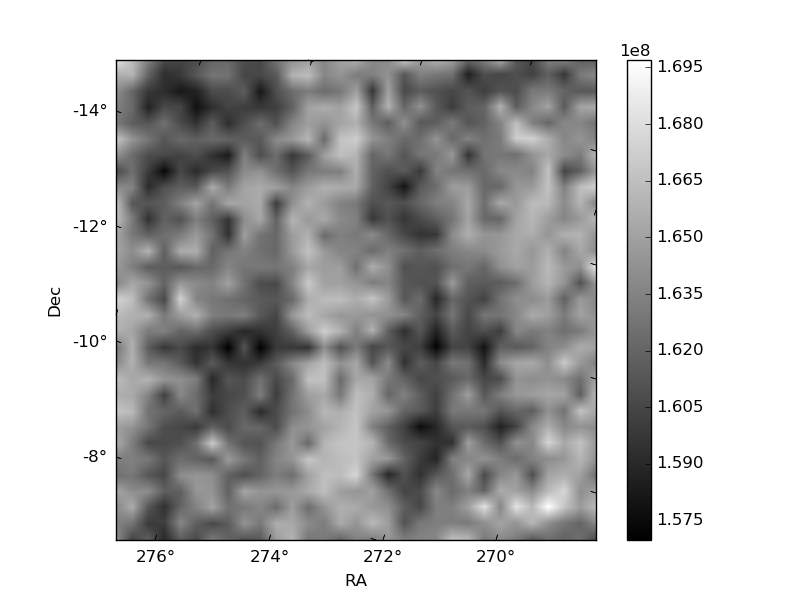
Histogram calculated using DETX and DETY for each event in the final _common_clean file
| Quadrant A | 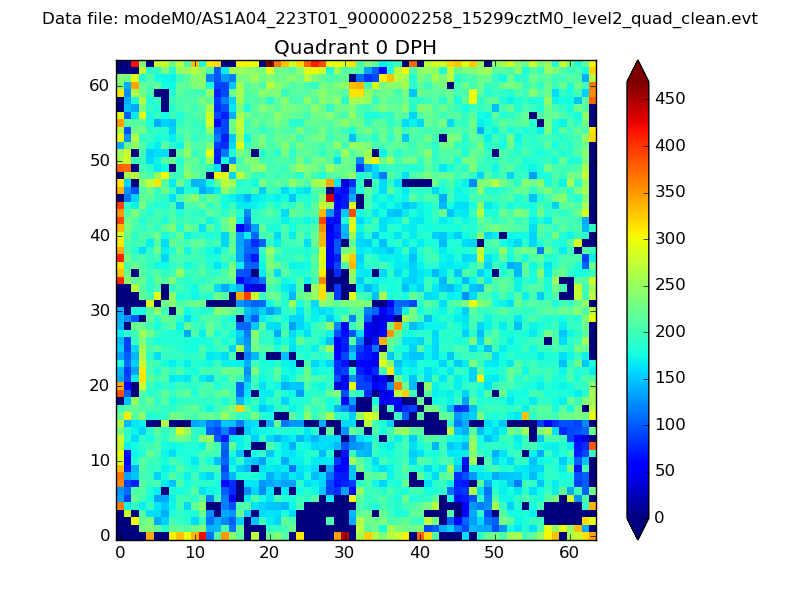 |
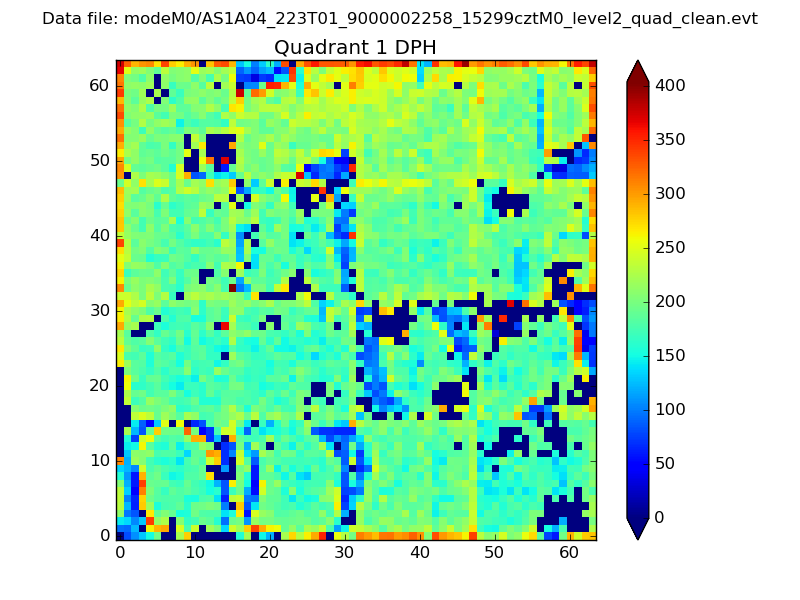 |
Quadrant B |
|---|---|---|---|
| Quadrant D | 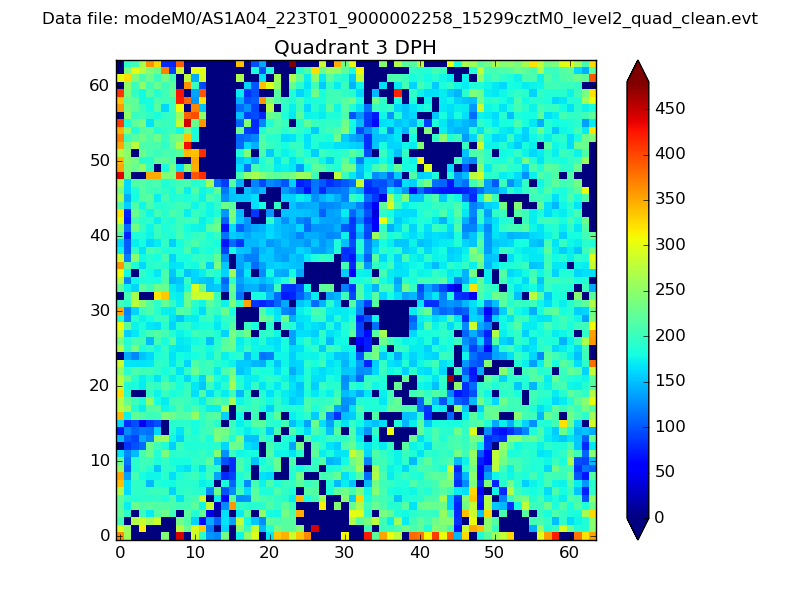 |
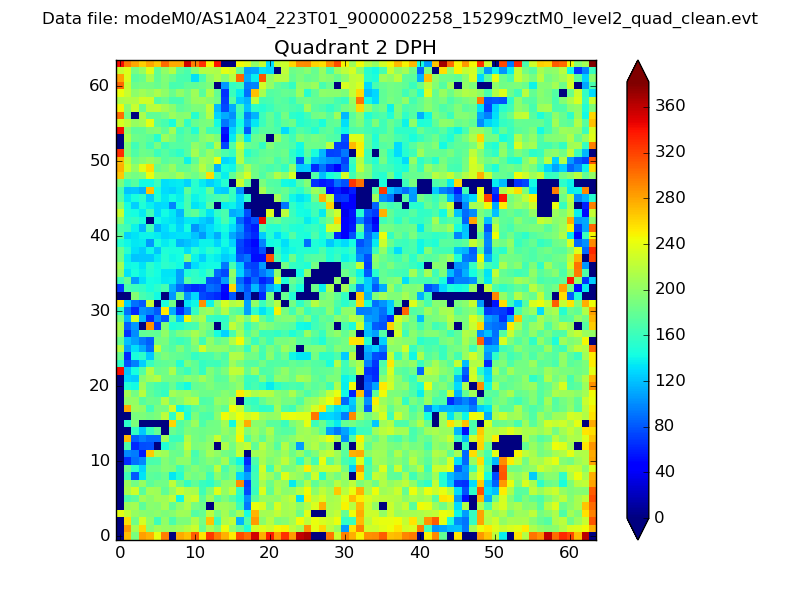 |
Quadrant C |
| Plot type | Count rate plots | Images |
|---|---|---|
| Comparison with Poisson distribution Blue bars denote a histogram of data divided into 1 sec bins. Red curve is a Poisson curve with rate = median count rate of data. |
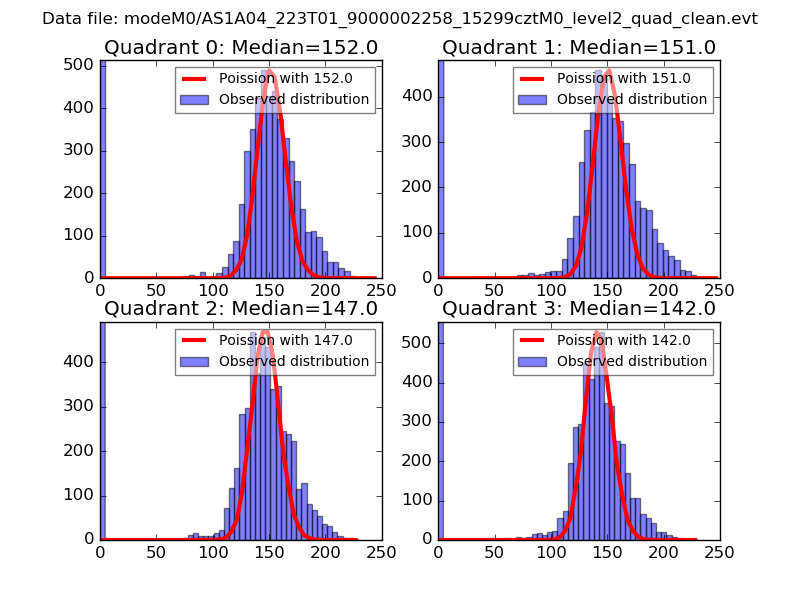 |
 |
| Quadrant-wise count rates Data is divided into 100 sec bins |
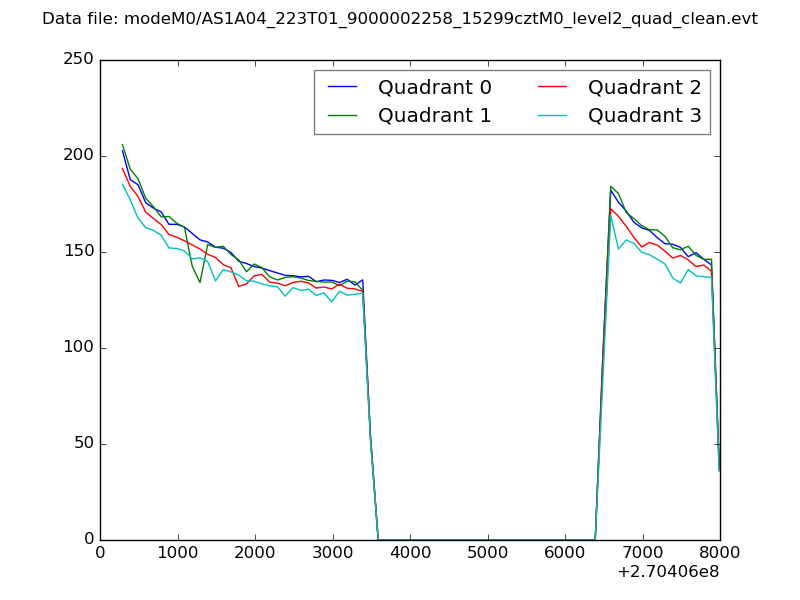 |
|
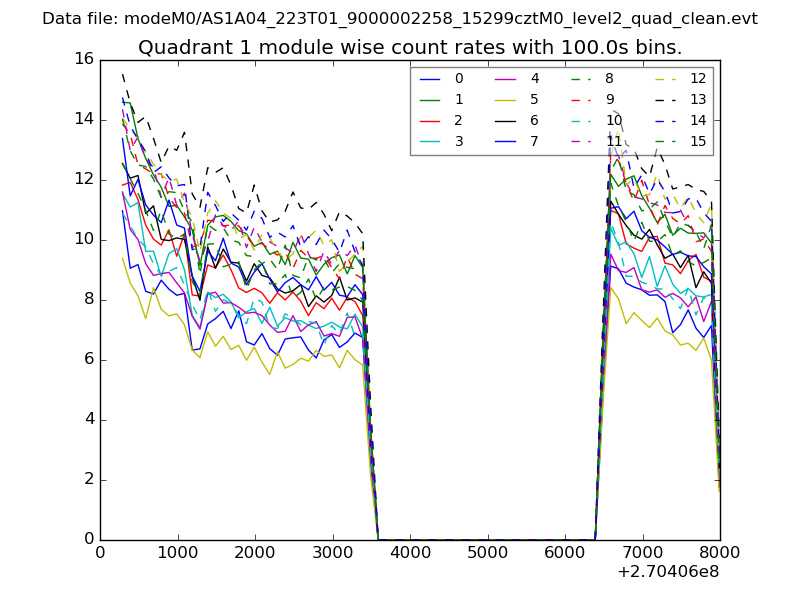
| Module-wise count rates for Quadrant A Data is divided into 100 sec bins |
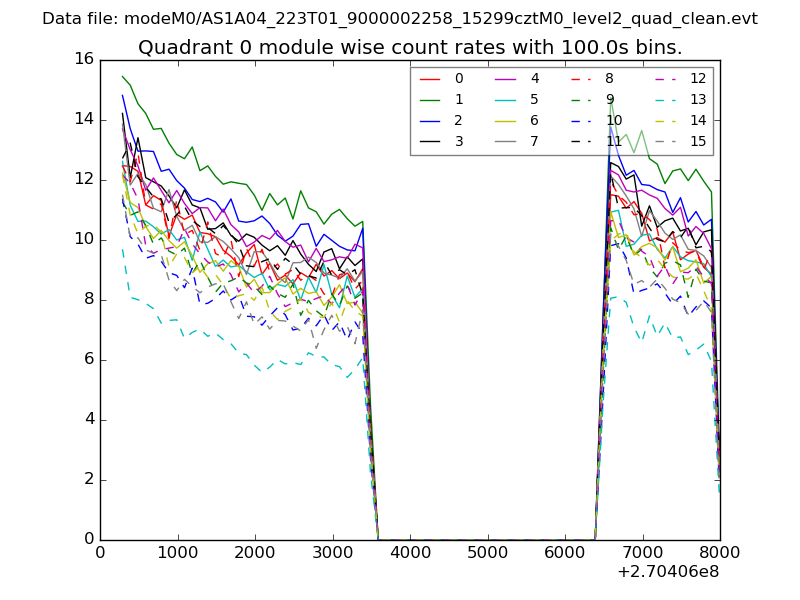 |
 |
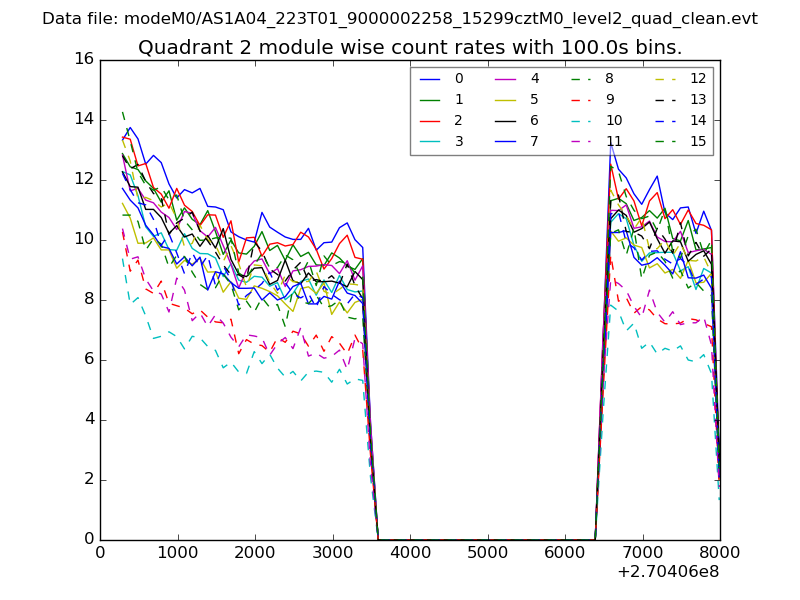
| Module-wise count rates for Quadrant B Data is divided into 100 sec bins |
 |
 |
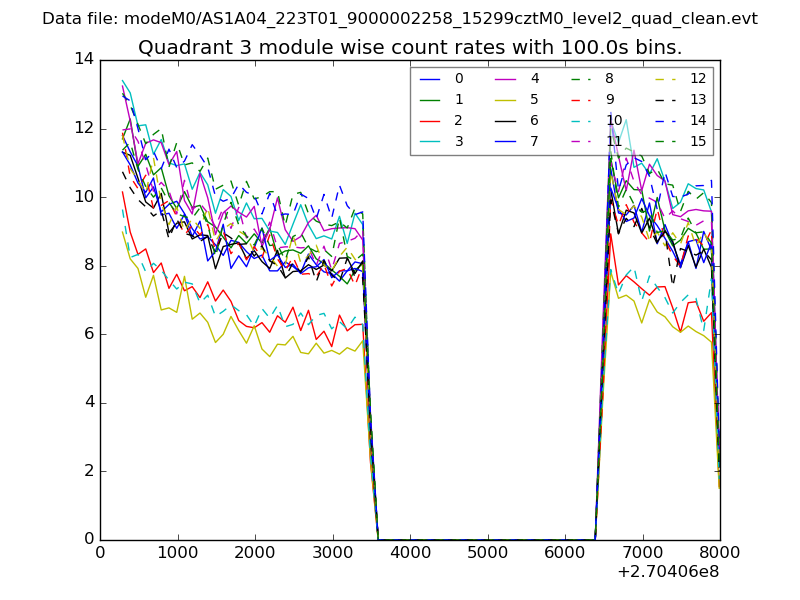
| Module-wise count rates for Quadrant C Data is divided into 100 sec bins |
 |
 |
| Module-wise count rates for Quadrant D Data is divided into 100 sec bins |
 |
 |
| Parameter | Plot |
|---|---|
| CZT HV Monitor | 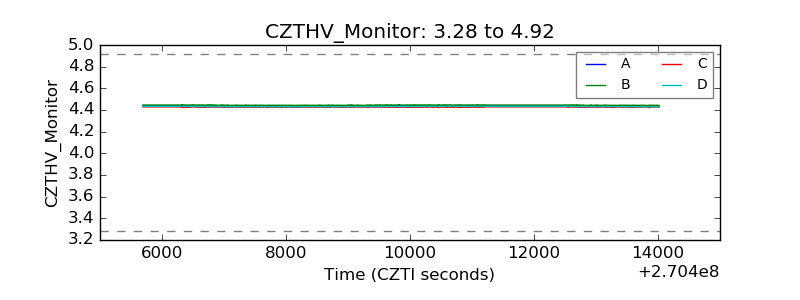 |
| D_VDD | 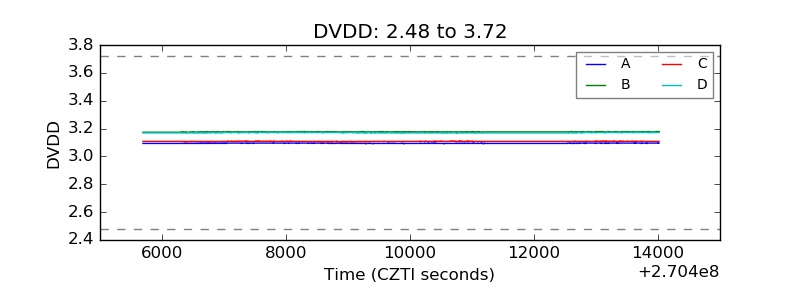 |
| Temperature 1 | 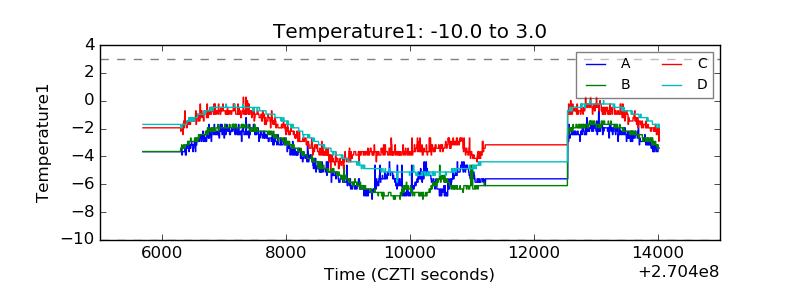 |
| Veto HV Monitor | 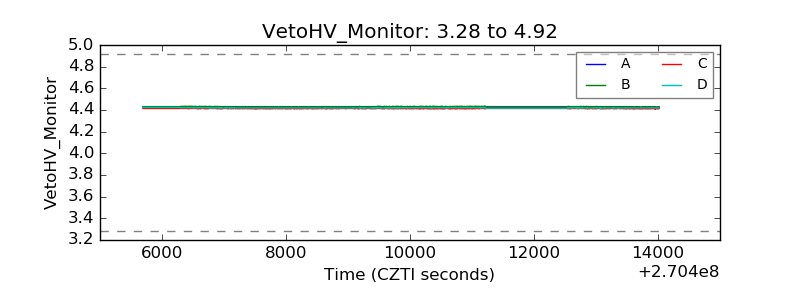 |
| Veto LLD | 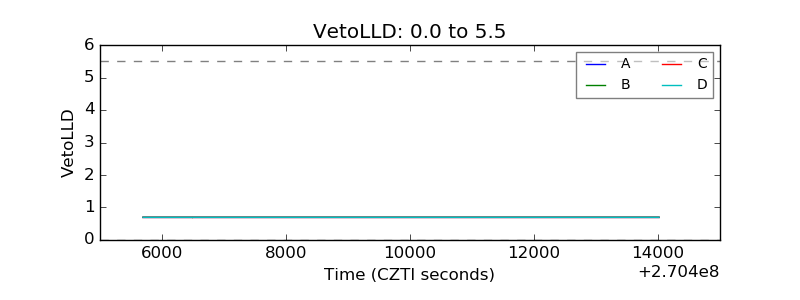 |
| Alpha Counter | 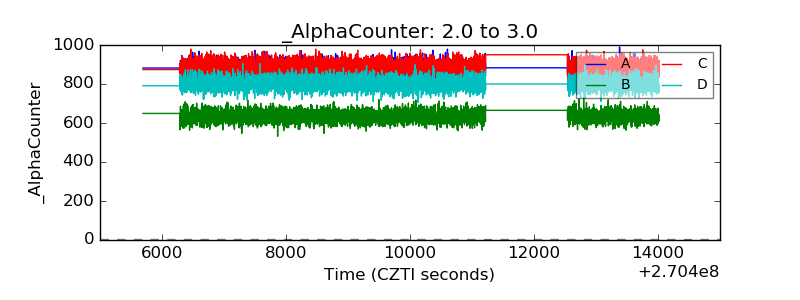 |
| _CPM_Rate | 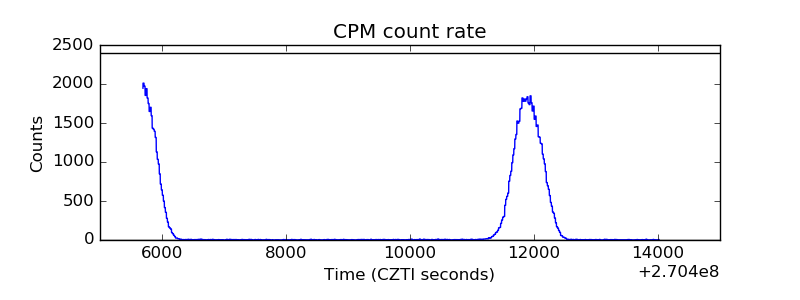 |
| CZT Counter | 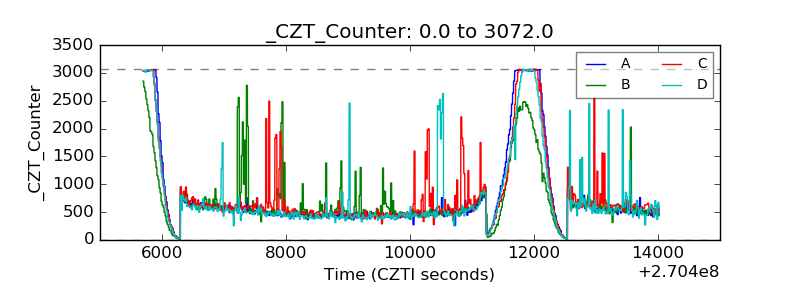 |
| +2.5 Volts monitor |  |
| +5 Volts monitor | 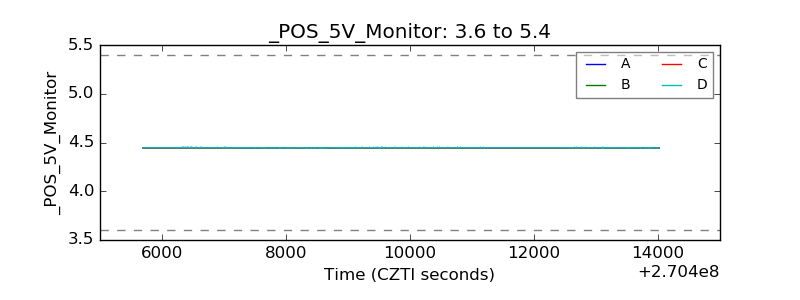 |
| _ROLL_ROT | 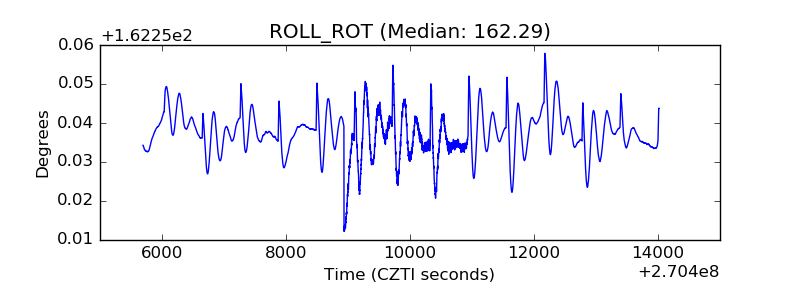 |
| _Roll_DEC | 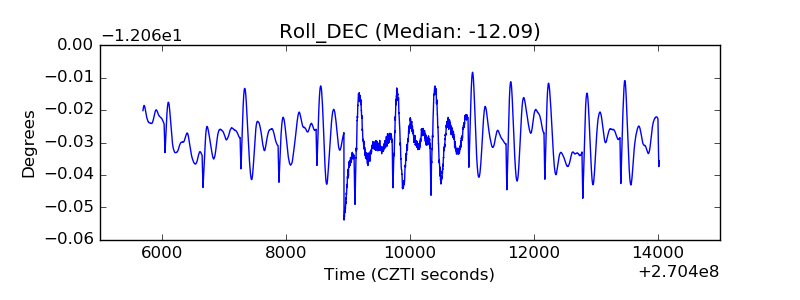 |
| _Roll_RA | 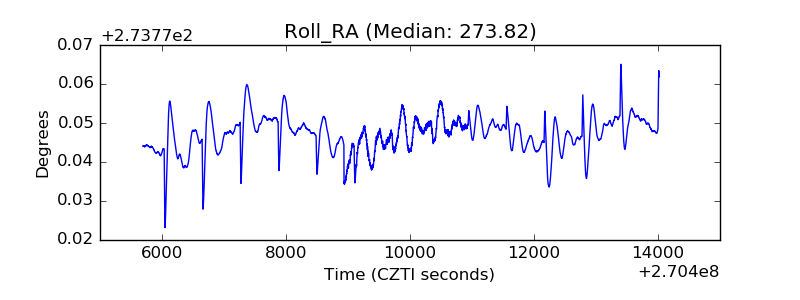 |
| Veto Counter | 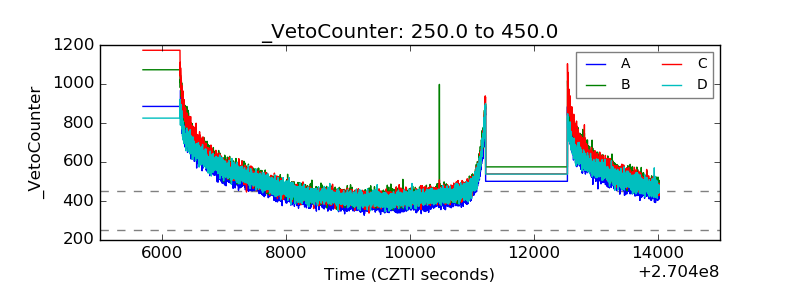 |