| Param | Original file | Final file |
|---|---|---|
| Filename | modeM0/AS1A04_223T01_9000002258_15300cztM0_level2.evt | modeM0/AS1A04_223T01_9000002258_15300cztM0_level2_quad_clean.evt |
| Size (bytes) | 478,846,080 | 95,359,680 |
| Size | 456.7 MB | 90.9 MB |
| Events in quadrant A | 3,235,106 | 626,954 |
| Events in quadrant B | 3,612,729 | 631,176 |
| Events in quadrant C | 3,606,134 | 610,185 |
| Events in quadrant D | 3,616,686 | 576,287 |
| Mode SS | |||
|---|---|---|---|
| Quadrant | BADHDUFLAG | Total packets | Discarded packets |
| A | 0 | 130 | 0 |
| B | 0 | 130 | 0 |
| C | 0 | 130 | 0 |
| D | 0 | 130 | 0 |
| Mode M9 | |||
|---|---|---|---|
| Quadrant | BADHDUFLAG | Total packets | Discarded packets |
| A | 0 | 13 | 0 |
| B | 0 | 13 | 0 |
| C | 0 | 13 | 0 |
| D | 0 | 14 | 0 |
| Mode M0 | |||
|---|---|---|---|
| Quadrant | BADHDUFLAG | Total packets | Discarded packets |
| A | 0 | 13614 | 3 |
| B | 0 | 14806 | 2 |
| C | 0 | 14646 | 2 |
| D | 0 | 14974 | 2 |
| Quadrant | Total seconds | Saturated seconds | Saturation percentage |
|---|---|---|---|
| A | 6348 | 76 | 1.197227% |
| B | 6348 | 108 | 1.701323% |
| C | 6348 | 77 | 1.212980% |
| D | 6348 | 175 | 2.756774% |
Noise dominated data is calculated using 1-second bins in cleaned event files. If a bin has >2000 counts, and if more than 50% of those come from <1% of pixels, then it is considered to be noise-dominated and hence unusable.
| Quadrant | # 1 sec bins | Bins with >0 counts | Bins with >2000 counts | High rate bins dominated by noise | Noise dominated (total time) | Noise dominated (detector-on time) | Marked lightcurve |
|---|---|---|---|---|---|---|---|
| A | 7669 | 6350 | 3 | 3 | 0.04% | 0.05% | 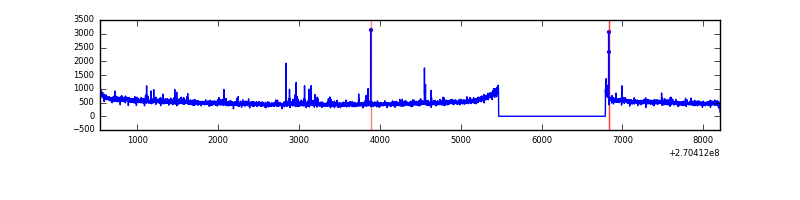 |
| B | 7669 | 6350 | 27 | 27 | 0.35% | 0.43% | 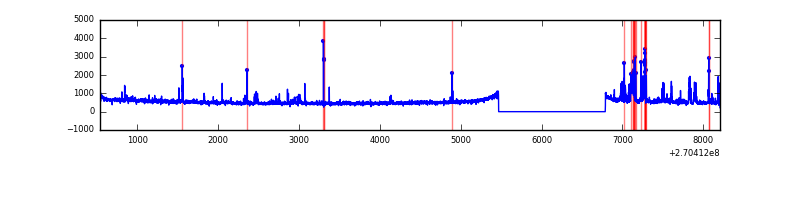 |
| C | 7669 | 6350 | 13 | 13 | 0.17% | 0.20% | 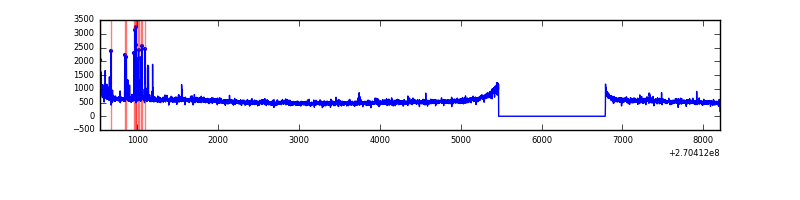 |
| D | 7669 | 6350 | 119 | 119 | 1.55% | 1.87% | 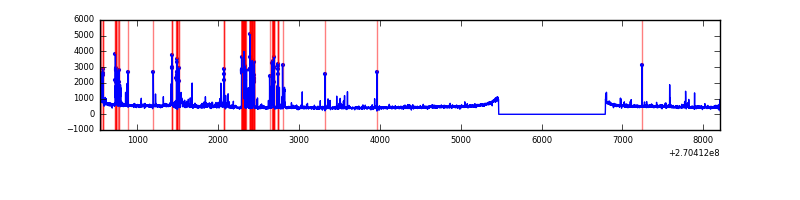 |
Top three noisy pixels from each quadrant. If the there are fewer than three noisy pixels in the level2.evt file, extra rows are filled as -1
| Pixel properties | Quadrant properties | ||||||
|---|---|---|---|---|---|---|---|
| Quadrant | DetID | PixID | Counts | Sigma | Mean | Median | Sigma |
| A | 9 | 143 | 62068 | 368.98 | 824 | 806 | 166.0 |
| A | 0 | 226 | 7482 | 40.21 | 824 | 806 | 166.0 |
| A | 12 | 194 | 6283 | 32.99 | 824 | 806 | 166.0 |
| B | 10 | 16 | 224935 | 1450.18 | 818 | 801 | 154.6 |
| B | 0 | 190 | 43618 | 277.03 | 818 | 801 | 154.6 |
| B | 0 | 219 | 33069 | 208.78 | 818 | 801 | 154.6 |
| C | 3 | 233 | 408798 | 2244.46 | 787 | 794 | 181.8 |
| C | 4 | 254 | 107426 | 586.59 | 787 | 794 | 181.8 |
| C | 7 | 247 | 21450 | 113.63 | 787 | 794 | 181.8 |
| D | 13 | 122 | 264116 | 1356.25 | 786 | 763 | 194.2 |
| D | 7 | 38 | 122404 | 626.44 | 786 | 763 | 194.2 |
| D | 10 | 70 | 87905 | 448.78 | 786 | 763 | 194.2 |
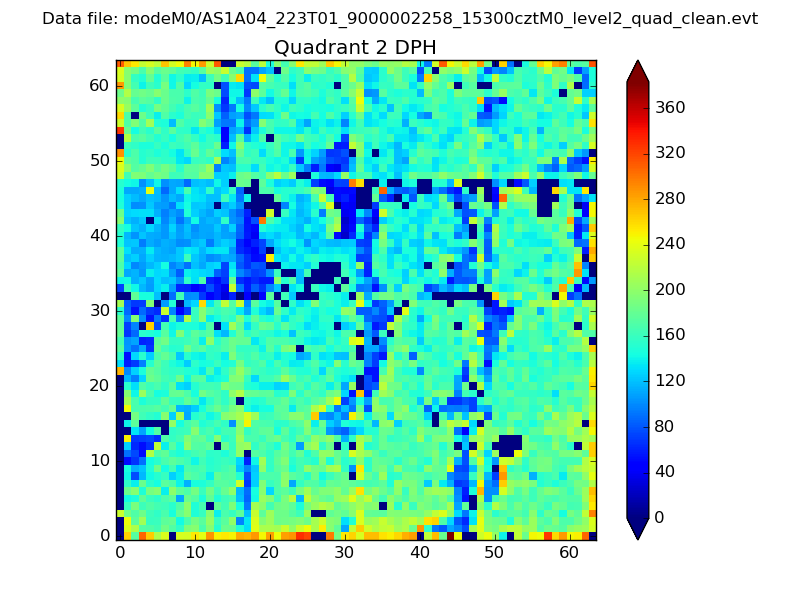
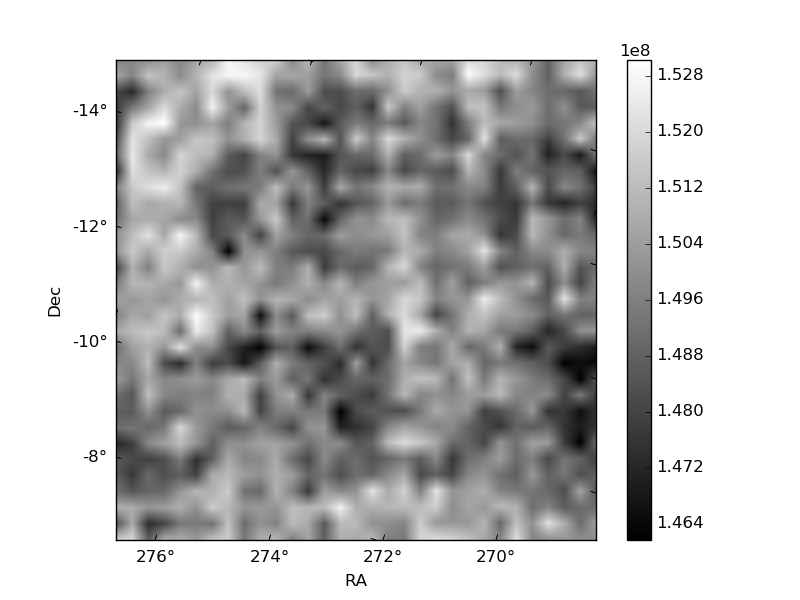
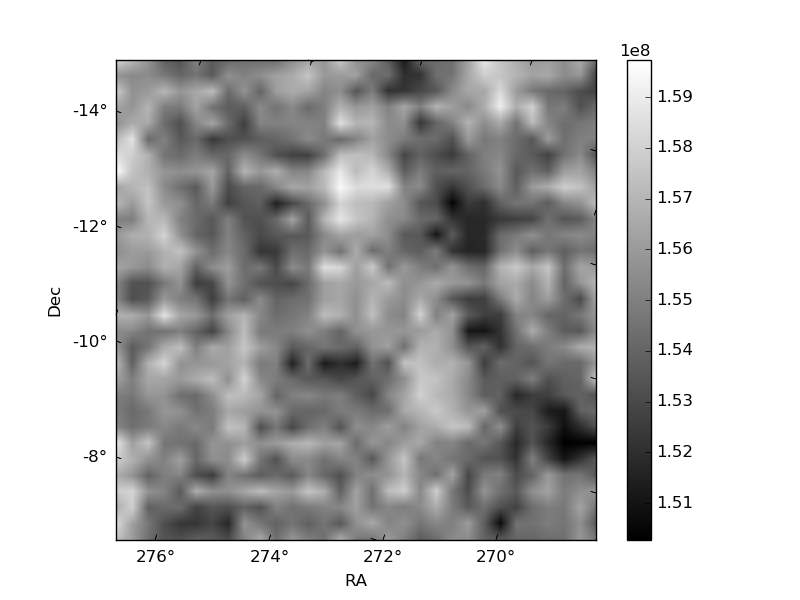
Histogram calculated using DETX and DETY for each event in the final _common_clean file
| Quadrant A | 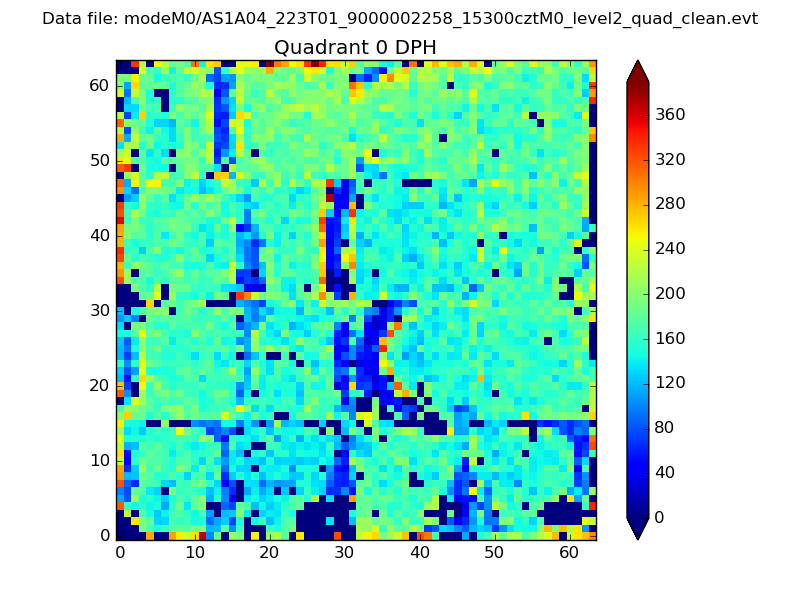 |
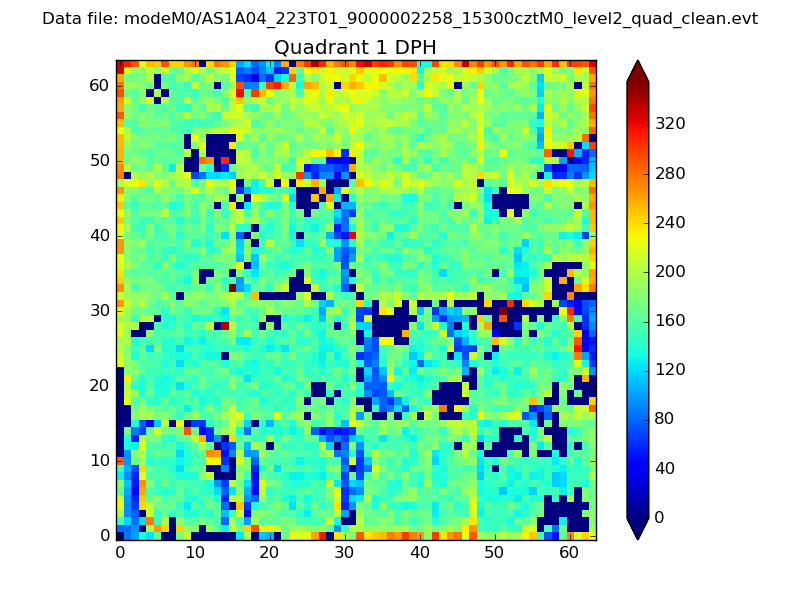 |
Quadrant B |
|---|---|---|---|
| Quadrant D | 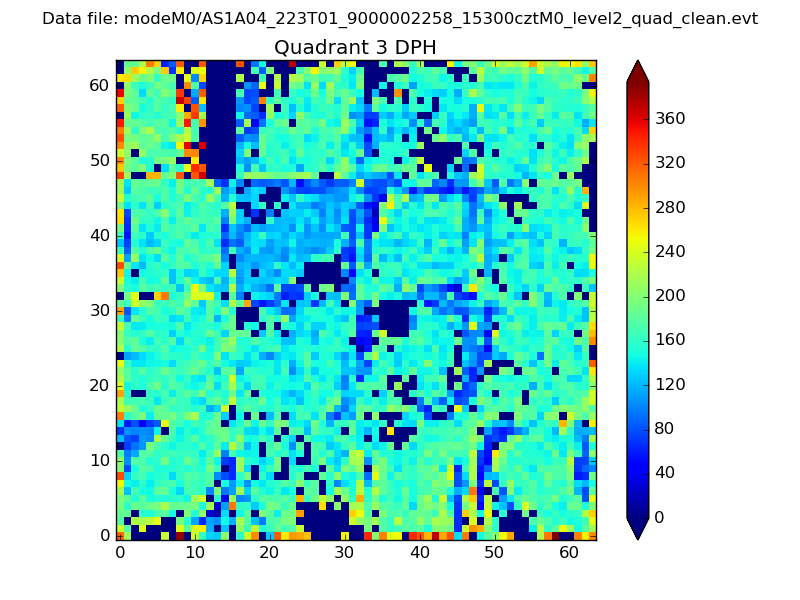 |
 |
Quadrant C |
| Plot type | Count rate plots | Images |
|---|---|---|
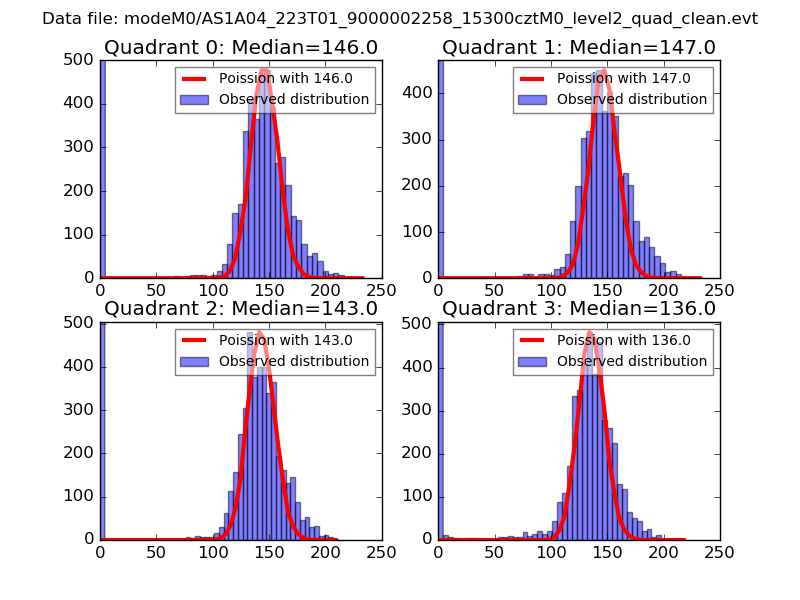
| Comparison with Poisson distribution Blue bars denote a histogram of data divided into 1 sec bins. Red curve is a Poisson curve with rate = median count rate of data. |
 |
 |
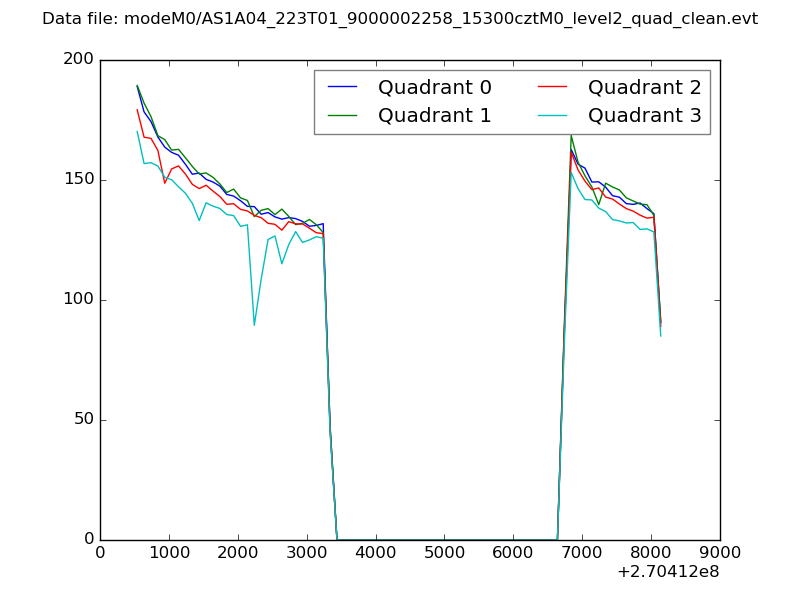
| Quadrant-wise count rates Data is divided into 100 sec bins |
 |
|
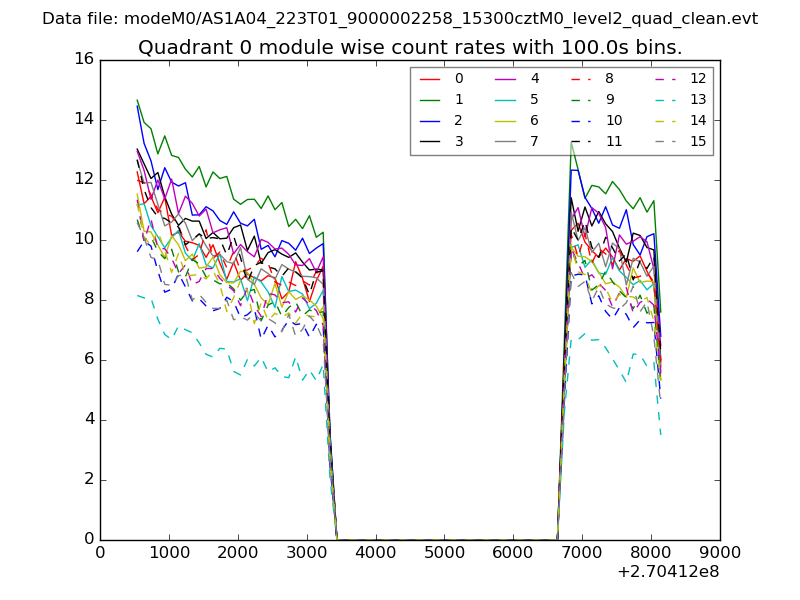
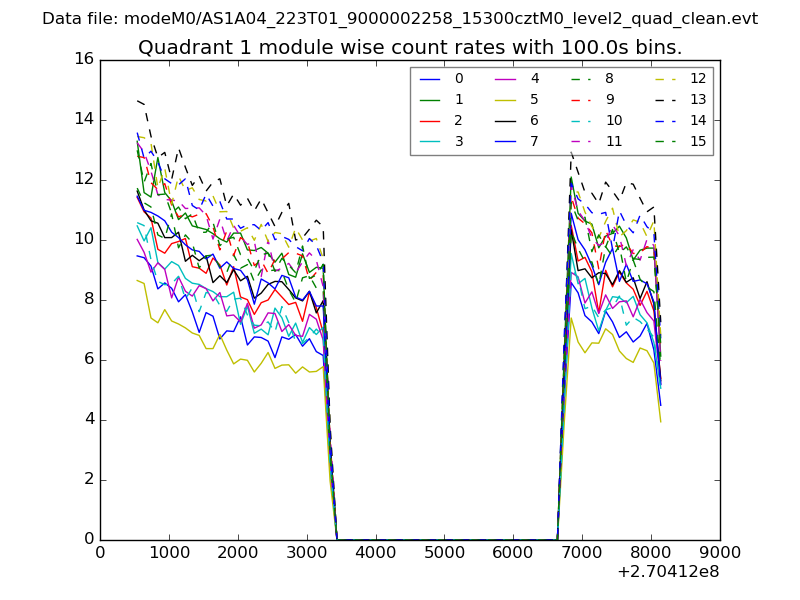
| Module-wise count rates for Quadrant A Data is divided into 100 sec bins |
 |
 |
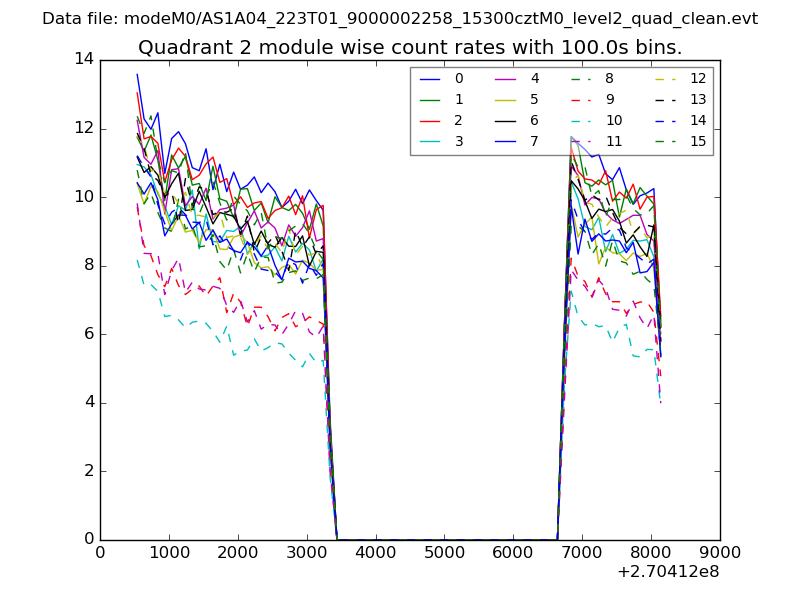
| Module-wise count rates for Quadrant B Data is divided into 100 sec bins |
 |
 |
| Module-wise count rates for Quadrant C Data is divided into 100 sec bins |
 |
 |
| Module-wise count rates for Quadrant D Data is divided into 100 sec bins |
 |
 |
| Parameter | Plot |
|---|---|
| CZT HV Monitor | 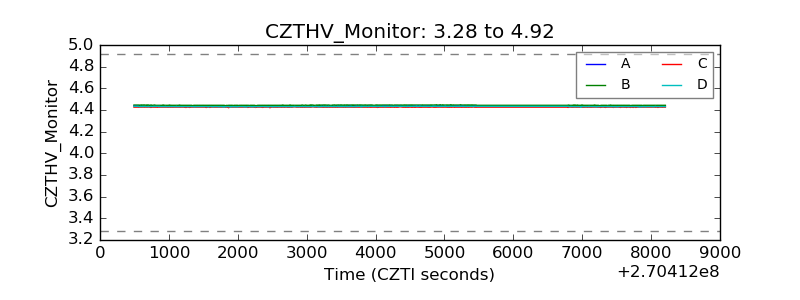 |
| D_VDD | 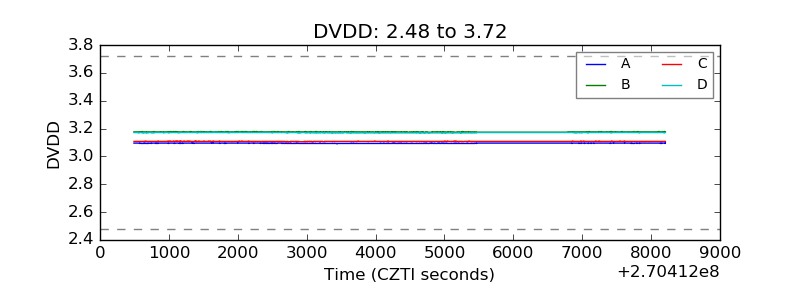 |
| Temperature 1 |  |
| Veto HV Monitor | 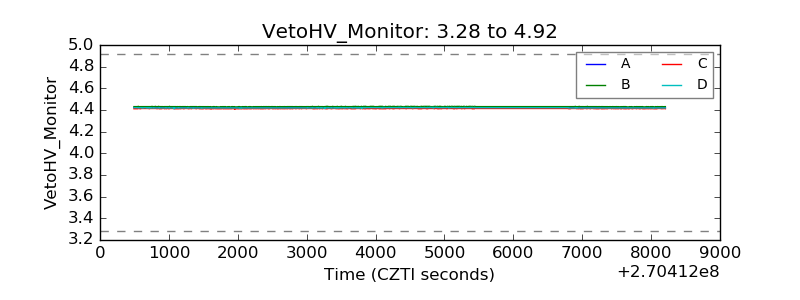 |
| Veto LLD | 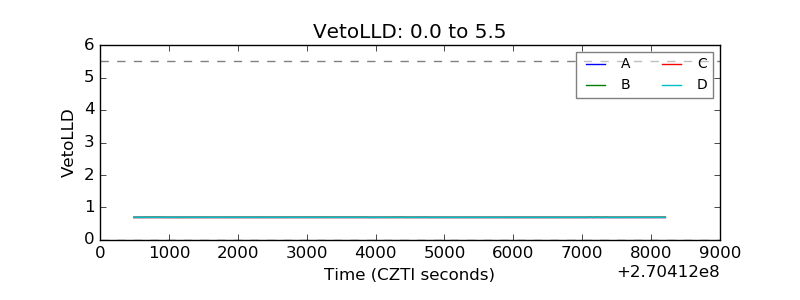 |
| Alpha Counter | 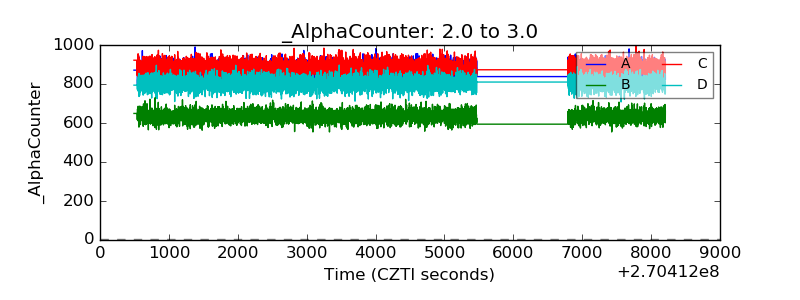 |
| _CPM_Rate | 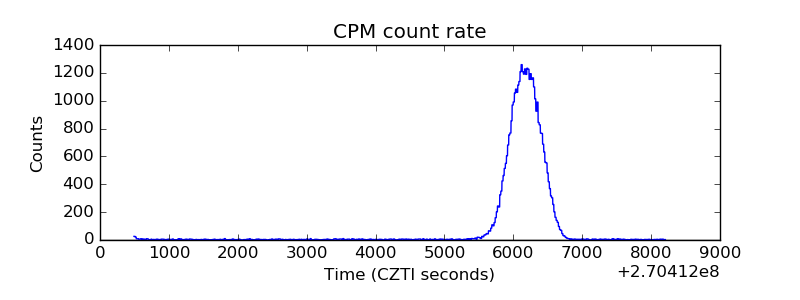 |
| CZT Counter | 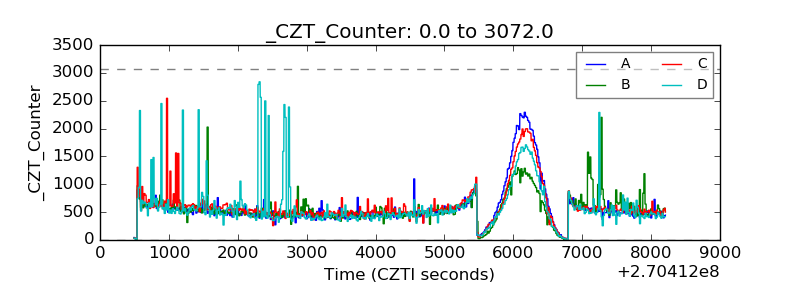 |
| +2.5 Volts monitor |  |
| +5 Volts monitor |  |
| _ROLL_ROT | 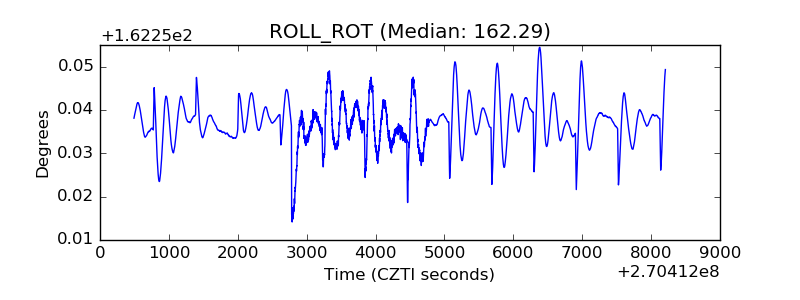 |
| _Roll_DEC |  |
| _Roll_RA | 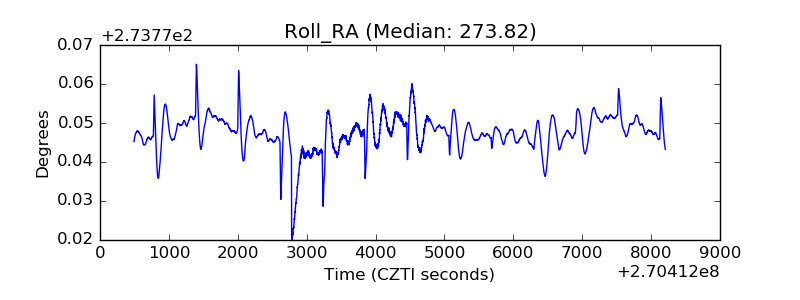 |
| Veto Counter | 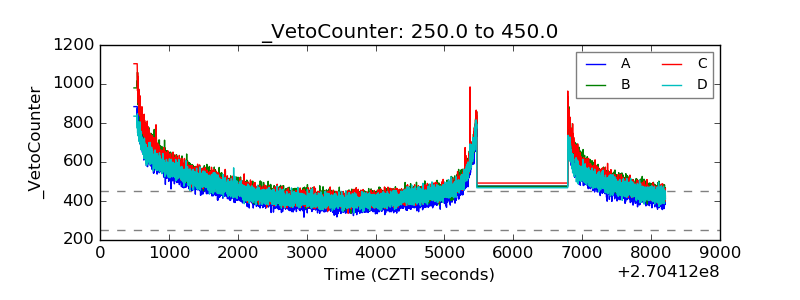 |