| Param | Original file | Final file |
|---|---|---|
| Filename | modeM0/AS1A04_223T01_9000002258_15301cztM0_level2.evt | modeM0/AS1A04_223T01_9000002258_15301cztM0_level2_quad_clean.evt |
| Size (bytes) | 449,881,920 | 87,972,480 |
| Size | 429.0 MB | 83.9 MB |
| Events in quadrant A | 3,140,364 | 564,089 |
| Events in quadrant B | 3,506,018 | 569,888 |
| Events in quadrant C | 3,375,160 | 558,226 |
| Events in quadrant D | 3,173,652 | 530,761 |
| Mode SS | |||
|---|---|---|---|
| Quadrant | BADHDUFLAG | Total packets | Discarded packets |
| A | 0 | 128 | 0 |
| B | 0 | 128 | 0 |
| C | 0 | 128 | 0 |
| D | 0 | 128 | 0 |
| Mode M9 | |||
|---|---|---|---|
| Quadrant | BADHDUFLAG | Total packets | Discarded packets |
| A | 0 | 17 | 0 |
| B | 0 | 17 | 0 |
| C | 0 | 17 | 0 |
| D | 0 | 18 | 0 |
| Mode M0 | |||
|---|---|---|---|
| Quadrant | BADHDUFLAG | Total packets | Discarded packets |
| A | 0 | 13481 | 3 |
| B | 0 | 14524 | 2 |
| C | 0 | 13810 | 2 |
| D | 0 | 13683 | 2 |
| Quadrant | Total seconds | Saturated seconds | Saturation percentage |
|---|---|---|---|
| A | 6323 | 47 | 0.743318% |
| B | 6323 | 87 | 1.375929% |
| C | 6323 | 27 | 0.427012% |
| D | 6323 | 48 | 0.759133% |
Noise dominated data is calculated using 1-second bins in cleaned event files. If a bin has >2000 counts, and if more than 50% of those come from <1% of pixels, then it is considered to be noise-dominated and hence unusable.
| Quadrant | # 1 sec bins | Bins with >0 counts | Bins with >2000 counts | High rate bins dominated by noise | Noise dominated (total time) | Noise dominated (detector-on time) | Marked lightcurve |
|---|---|---|---|---|---|---|---|
| A | 7489 | 6325 | 7 | 7 | 0.09% | 0.11% | 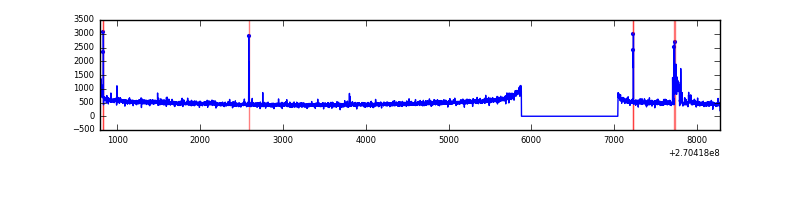 |
| B | 7489 | 6325 | 35 | 35 | 0.47% | 0.55% | 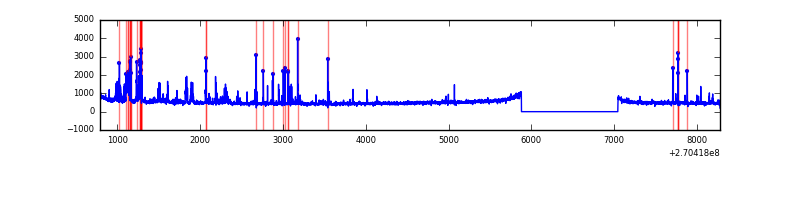 |
| C | 7489 | 6325 | 2 | 2 | 0.03% | 0.03% | 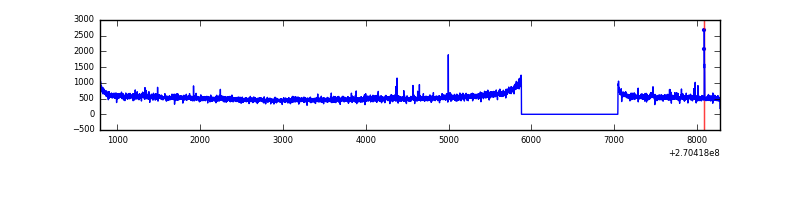 |
| D | 7489 | 6325 | 29 | 29 | 0.39% | 0.46% | 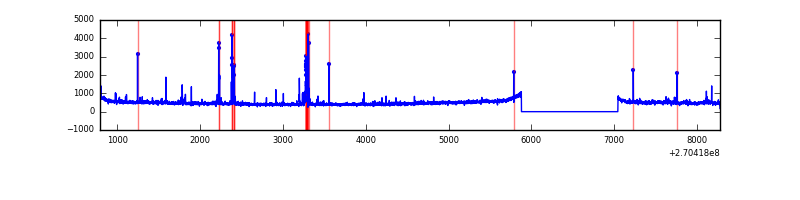 |
Top three noisy pixels from each quadrant. If the there are fewer than three noisy pixels in the level2.evt file, extra rows are filled as -1
| Pixel properties | Quadrant properties | ||||||
|---|---|---|---|---|---|---|---|
| Quadrant | DetID | PixID | Counts | Sigma | Mean | Median | Sigma |
| A | 15 | 69 | 65306 | 400.52 | 790 | 774 | 161.1 |
| A | 9 | 143 | 32972 | 199.84 | 790 | 774 | 161.1 |
| A | 0 | 226 | 7120 | 39.39 | 790 | 774 | 161.1 |
| B | 10 | 16 | 262665 | 1725.06 | 790 | 771 | 151.8 |
| B | 0 | 190 | 41501 | 268.28 | 790 | 771 | 151.8 |
| B | 0 | 197 | 28811 | 184.69 | 790 | 771 | 151.8 |
| C | 3 | 233 | 387467 | 2185.75 | 761 | 766 | 176.9 |
| C | 7 | 247 | 16122 | 86.8 | 761 | 766 | 176.9 |
| C | 13 | 61 | 5412 | 26.26 | 761 | 766 | 176.9 |
| D | 8 | 195 | 99890 | 527.5 | 761 | 739 | 188.0 |
| D | 2 | 33 | 81172 | 427.92 | 761 | 739 | 188.0 |
| D | 7 | 38 | 46289 | 242.33 | 761 | 739 | 188.0 |
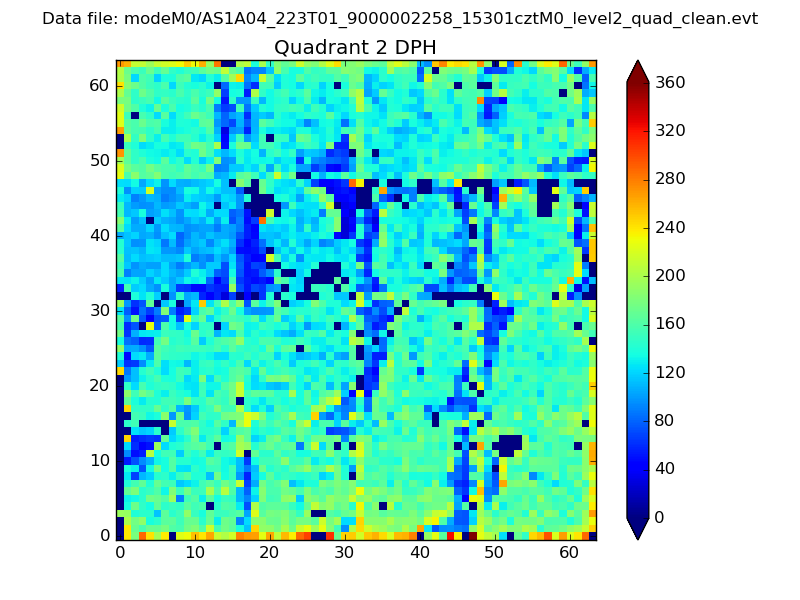
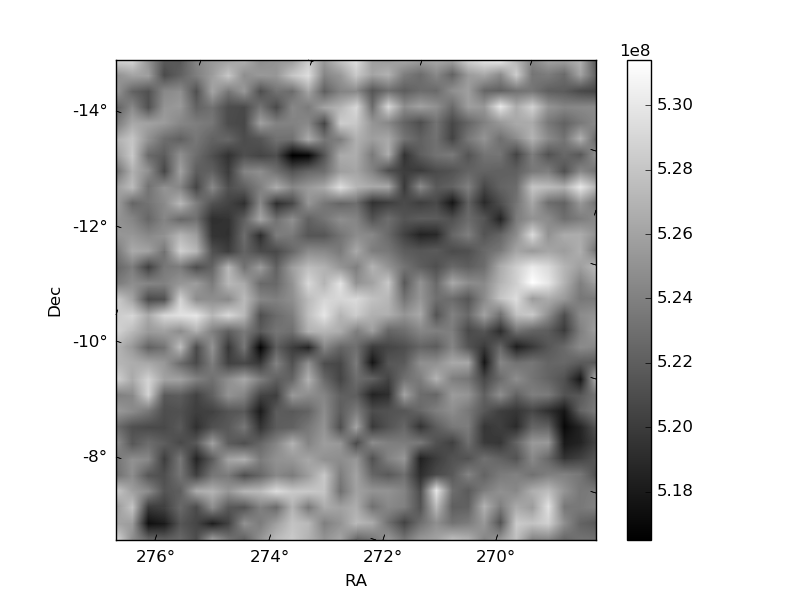
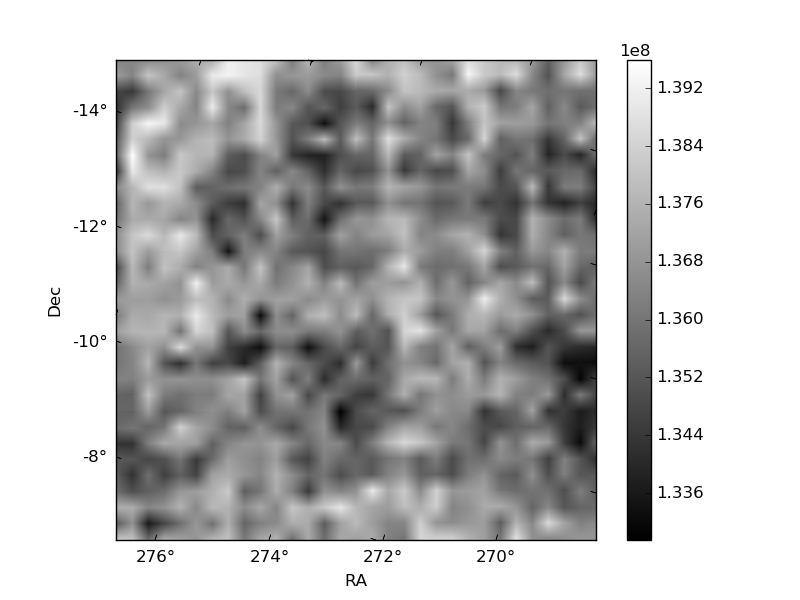
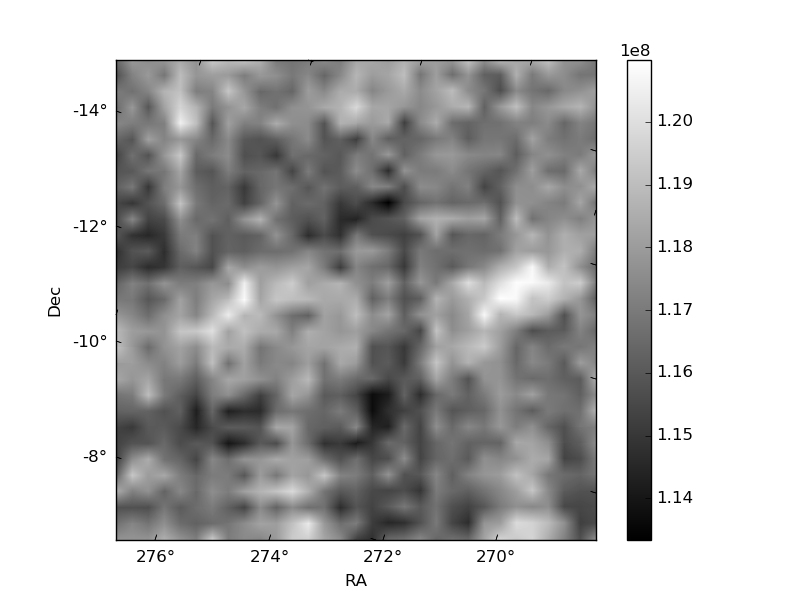
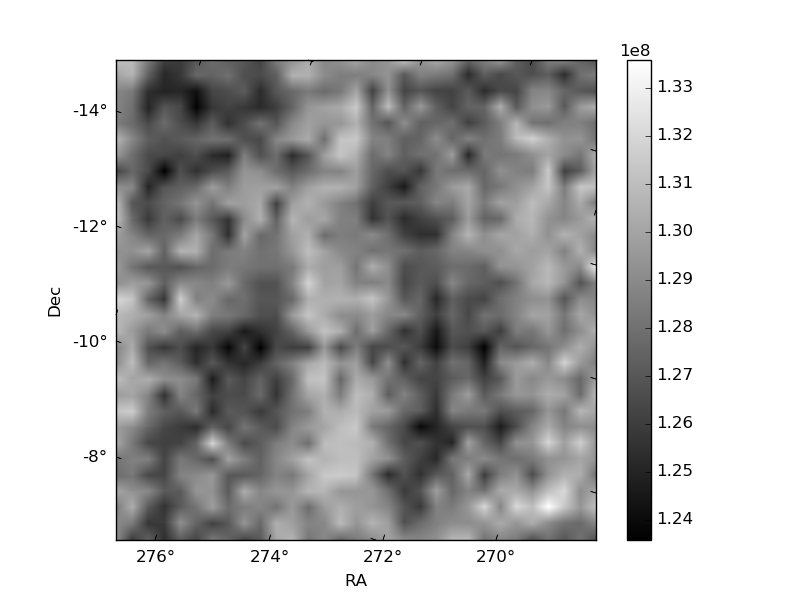
Histogram calculated using DETX and DETY for each event in the final _common_clean file
| Quadrant A | 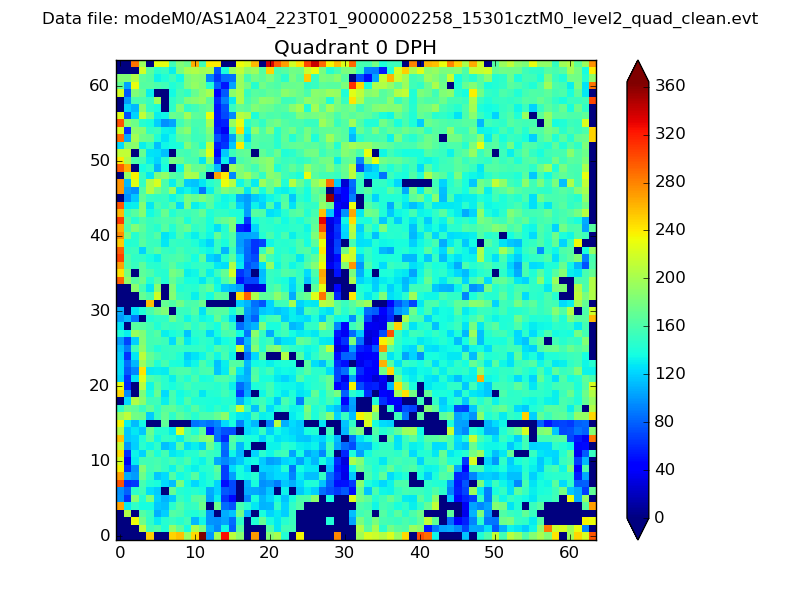 |
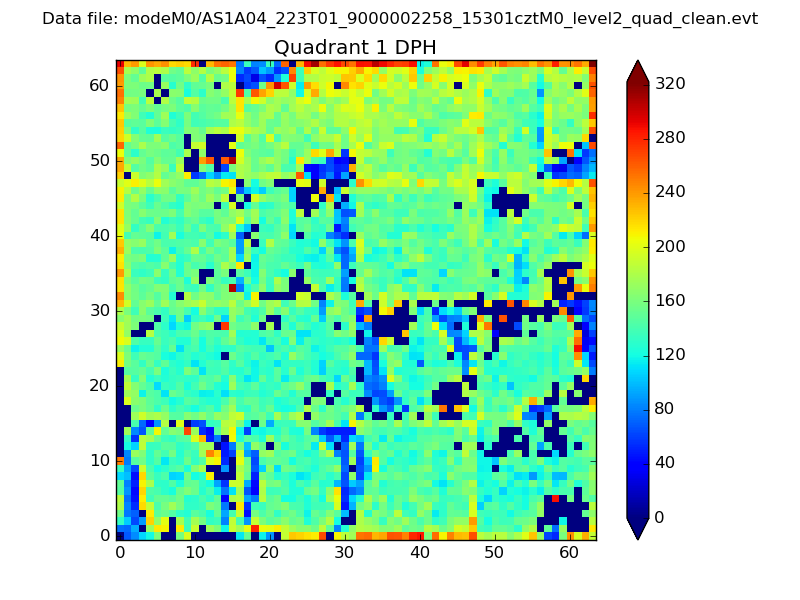 |
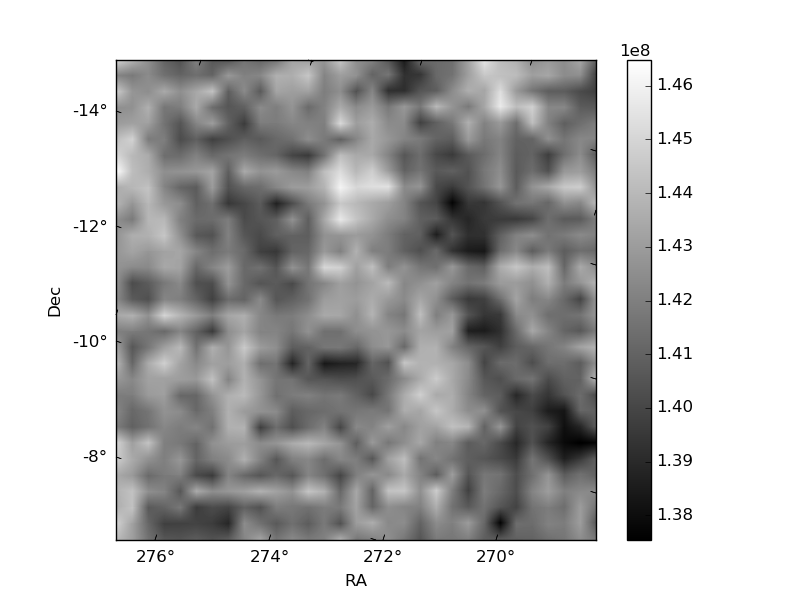
Quadrant B |
|---|---|---|---|
| Quadrant D | 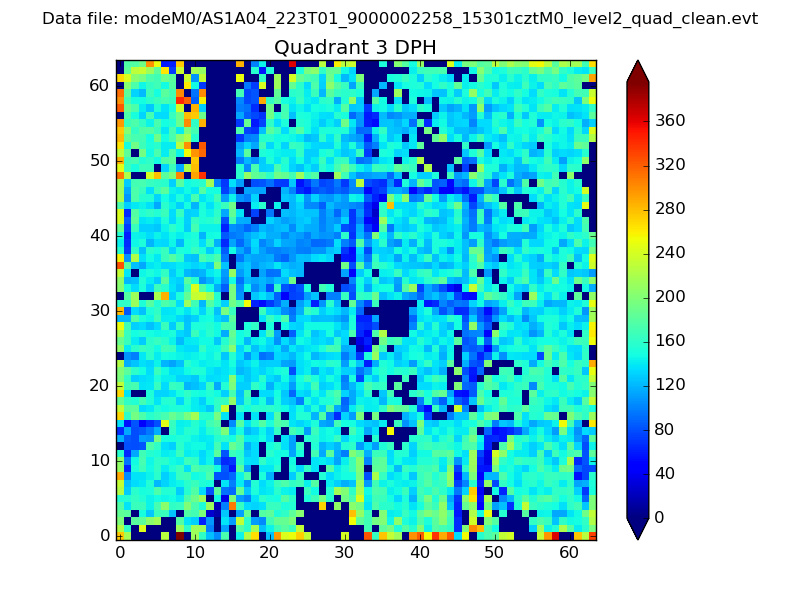 |
 |
Quadrant C |
| Plot type | Count rate plots | Images |
|---|---|---|
| Comparison with Poisson distribution Blue bars denote a histogram of data divided into 1 sec bins. Red curve is a Poisson curve with rate = median count rate of data. |
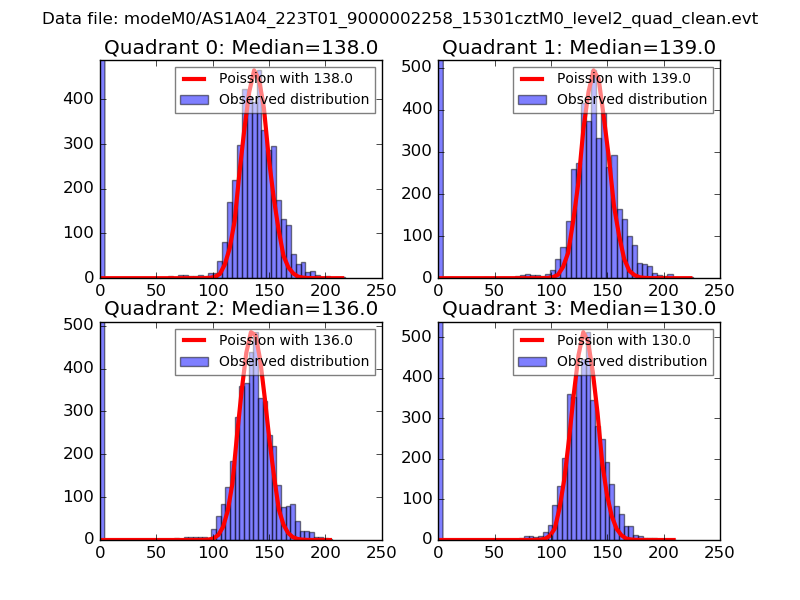 |
 |
| Quadrant-wise count rates Data is divided into 100 sec bins |
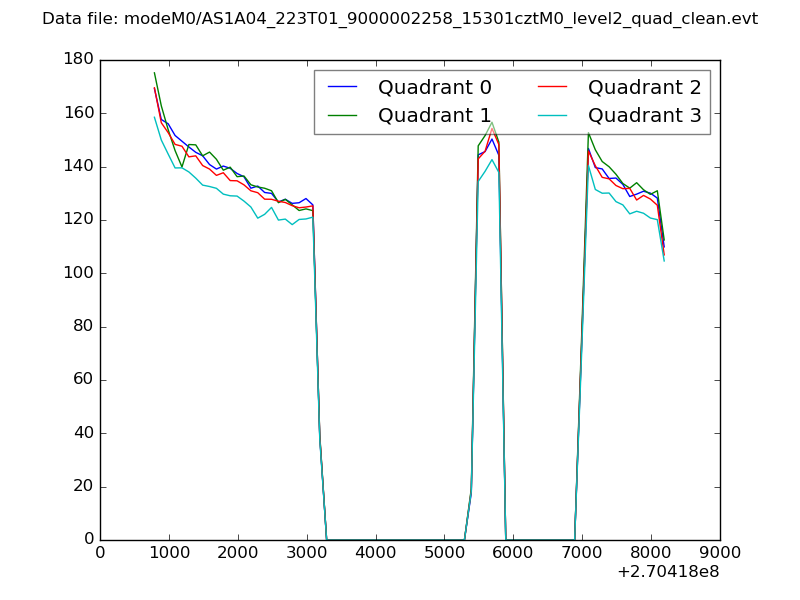 |
|
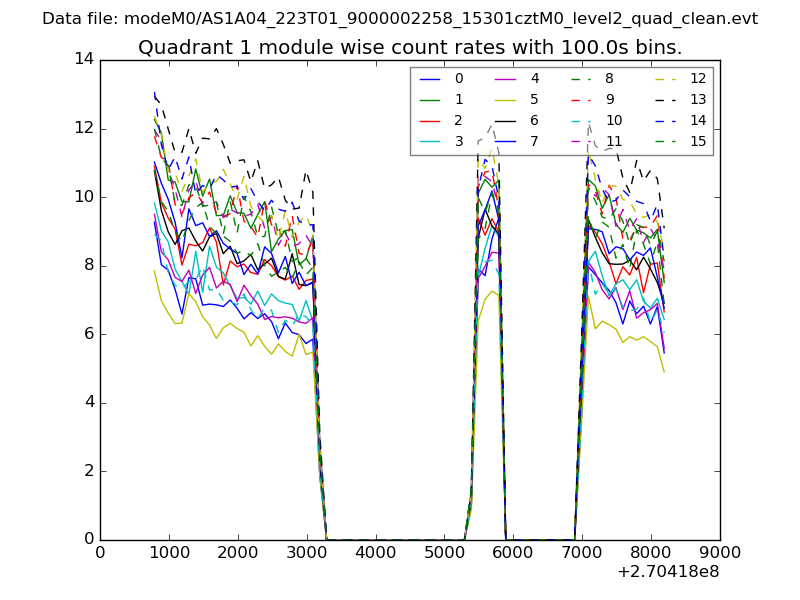
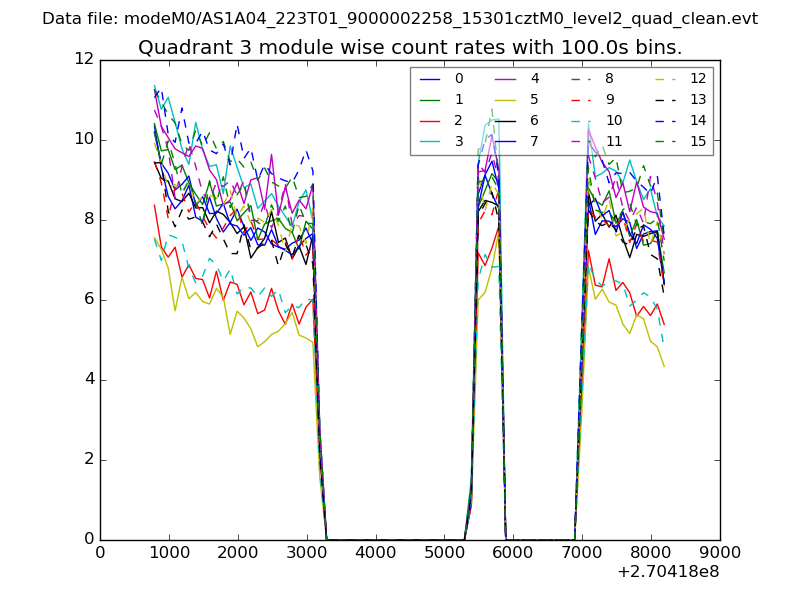
| Module-wise count rates for Quadrant A Data is divided into 100 sec bins |
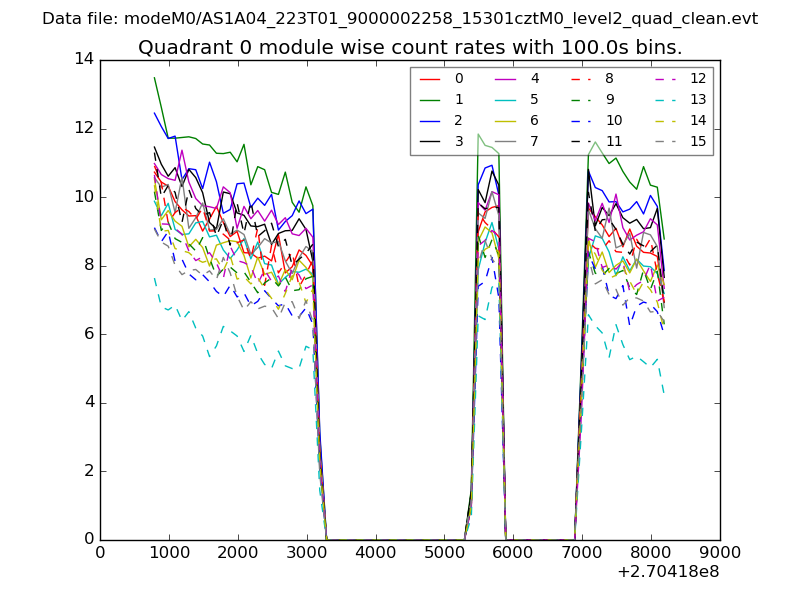 |
 |
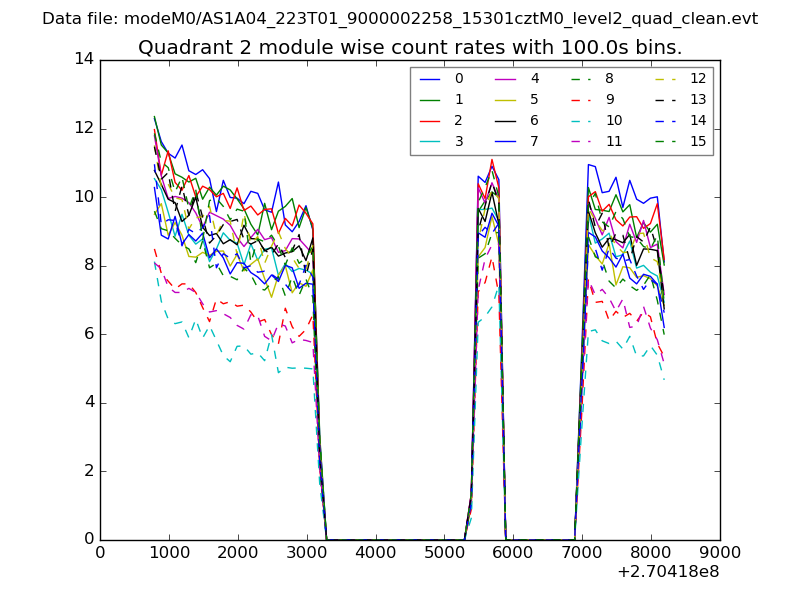
| Module-wise count rates for Quadrant B Data is divided into 100 sec bins |
 |
 |
| Module-wise count rates for Quadrant C Data is divided into 100 sec bins |
 |
 |
| Module-wise count rates for Quadrant D Data is divided into 100 sec bins |
 |
 |
| Parameter | Plot |
|---|---|
| CZT HV Monitor | 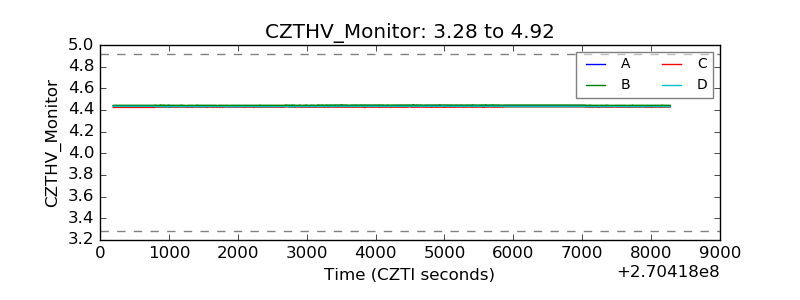 |
| D_VDD | 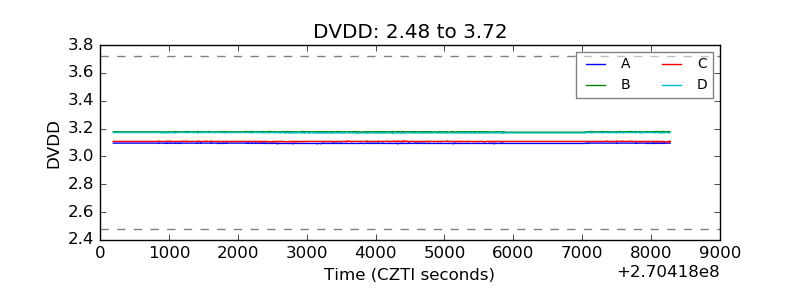 |
| Temperature 1 |  |
| Veto HV Monitor | 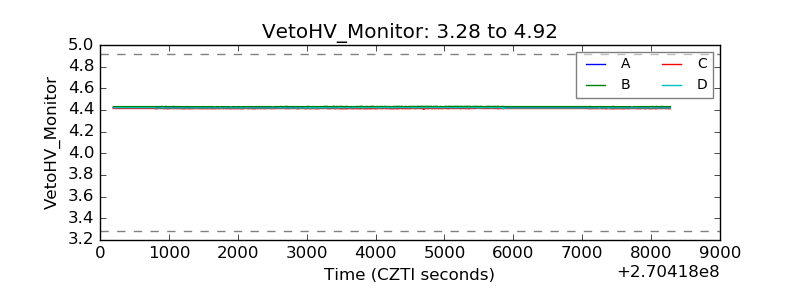 |
| Veto LLD | 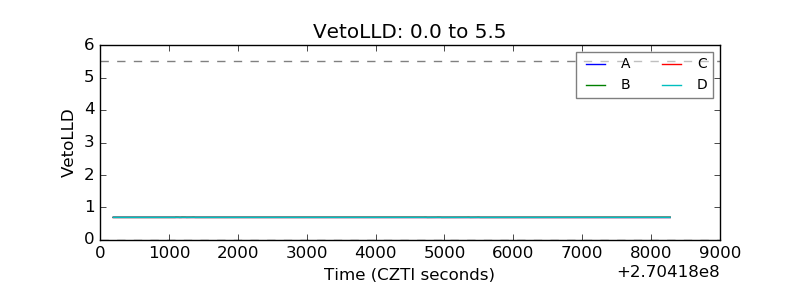 |
| Alpha Counter | 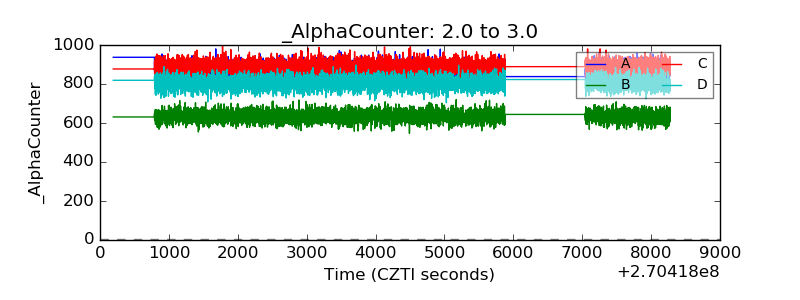 |
| _CPM_Rate | 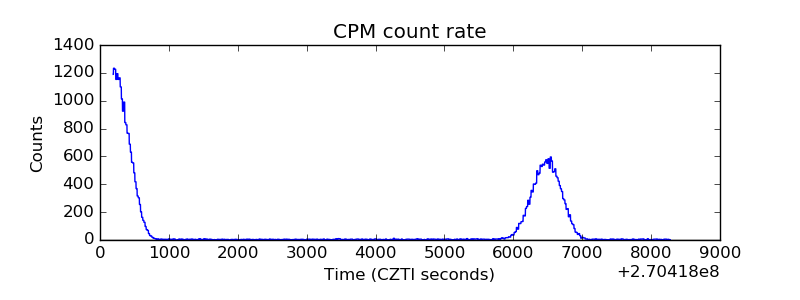 |
| CZT Counter | 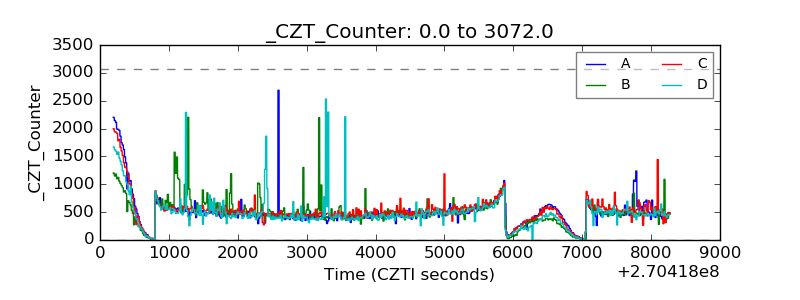 |
| +2.5 Volts monitor |  |
| +5 Volts monitor |  |
| _ROLL_ROT | 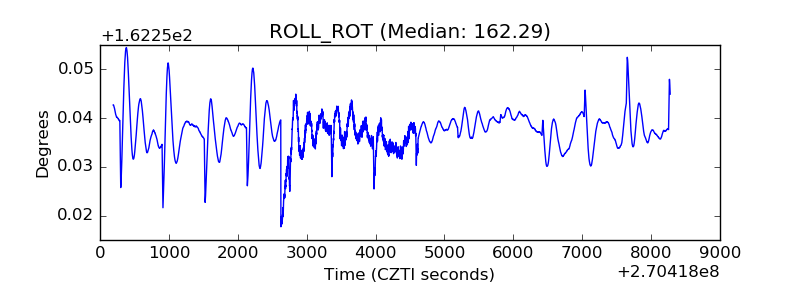 |
| _Roll_DEC |  |
| _Roll_RA | 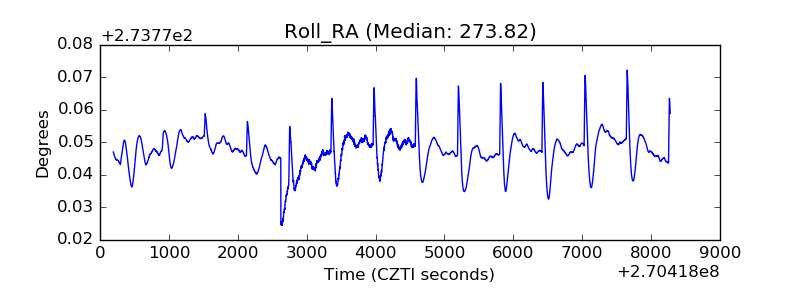 |
| Veto Counter | 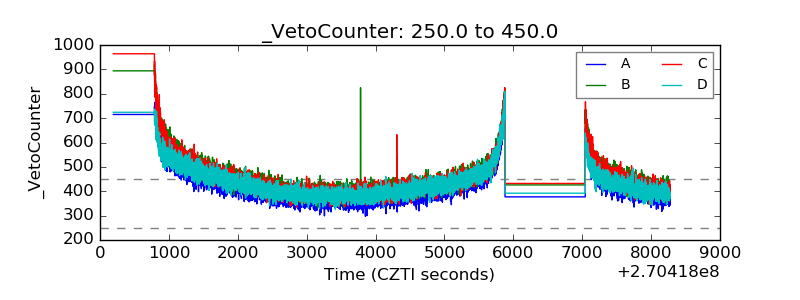 |