| Param | Original file | Final file |
|---|---|---|
| Filename | modeM0/AS1A04_223T01_9000002258_15302cztM0_level2.evt | modeM0/AS1A04_223T01_9000002258_15302cztM0_level2_quad_clean.evt |
| Size (bytes) | 477,492,480 | 94,121,280 |
| Size | 455.4 MB | 89.8 MB |
| Events in quadrant A | 3,283,670 | 600,890 |
| Events in quadrant B | 3,554,513 | 611,303 |
| Events in quadrant C | 3,693,510 | 595,023 |
| Events in quadrant D | 3,466,634 | 568,484 |
| Mode SS | |||
|---|---|---|---|
| Quadrant | BADHDUFLAG | Total packets | Discarded packets |
| A | 0 | 140 | 0 |
| B | 0 | 140 | 0 |
| C | 0 | 140 | 0 |
| D | 0 | 140 | 0 |
| Mode M9 | |||
|---|---|---|---|
| Quadrant | BADHDUFLAG | Total packets | Discarded packets |
| A | 0 | 20 | 0 |
| B | 0 | 20 | 0 |
| C | 0 | 20 | 0 |
| D | 0 | 20 | 0 |
| Mode M0 | |||
|---|---|---|---|
| Quadrant | BADHDUFLAG | Total packets | Discarded packets |
| A | 0 | 14330 | 3 |
| B | 0 | 14983 | 2 |
| C | 0 | 15183 | 2 |
| D | 0 | 14953 | 2 |
| Quadrant | Total seconds | Saturated seconds | Saturation percentage |
|---|---|---|---|
| A | 6813 | 45 | 0.660502% |
| B | 6813 | 103 | 1.511816% |
| C | 6813 | 34 | 0.499046% |
| D | 6813 | 79 | 1.159548% |
Noise dominated data is calculated using 1-second bins in cleaned event files. If a bin has >2000 counts, and if more than 50% of those come from <1% of pixels, then it is considered to be noise-dominated and hence unusable.
| Quadrant | # 1 sec bins | Bins with >0 counts | Bins with >2000 counts | High rate bins dominated by noise | Noise dominated (total time) | Noise dominated (detector-on time) | Marked lightcurve |
|---|---|---|---|---|---|---|---|
| A | 8809 | 6816 | 4 | 4 | 0.05% | 0.06% | 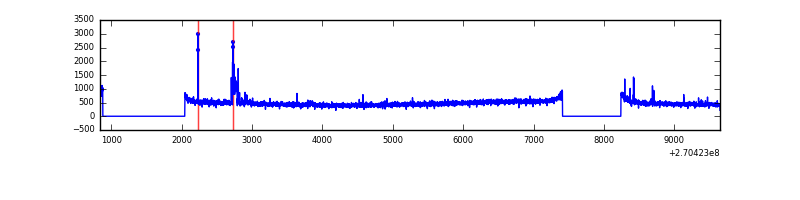 |
| B | 8809 | 6816 | 36 | 36 | 0.41% | 0.53% | 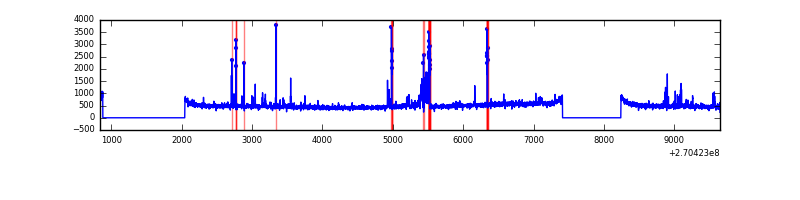 |
| C | 8809 | 6816 | 6 | 6 | 0.07% | 0.09% | 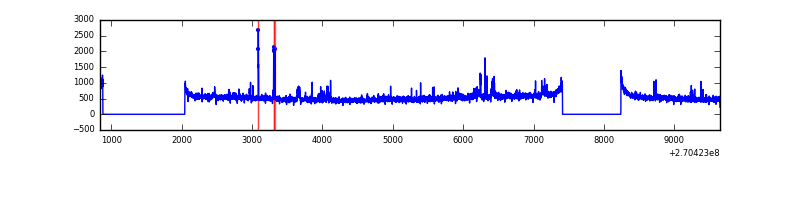 |
| D | 8809 | 6816 | 47 | 47 | 0.53% | 0.69% | 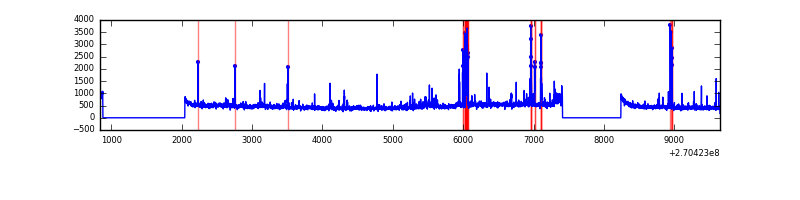 |
Top three noisy pixels from each quadrant. If the there are fewer than three noisy pixels in the level2.evt file, extra rows are filled as -1
| Pixel properties | Quadrant properties | ||||||
|---|---|---|---|---|---|---|---|
| Quadrant | DetID | PixID | Counts | Sigma | Mean | Median | Sigma |
| A | 15 | 69 | 70535 | 413.9 | 828 | 810 | 168.5 |
| A | 9 | 143 | 23904 | 137.09 | 828 | 810 | 168.5 |
| A | 0 | 226 | 7454 | 39.44 | 828 | 810 | 168.5 |
| B | 10 | 16 | 189746 | 1170.37 | 828 | 806 | 161.4 |
| B | 0 | 189 | 36648 | 222.02 | 828 | 806 | 161.4 |
| B | 3 | 209 | 34061 | 206.0 | 828 | 806 | 161.4 |
| C | 3 | 233 | 551243 | 2946.4 | 800 | 804 | 186.8 |
| C | 7 | 247 | 20177 | 103.7 | 800 | 804 | 186.8 |
| C | 13 | 61 | 5682 | 26.11 | 800 | 804 | 186.8 |
| D | 2 | 33 | 201511 | 1028.24 | 795 | 771 | 195.2 |
| D | 8 | 195 | 125961 | 641.26 | 795 | 771 | 195.2 |
| D | 10 | 70 | 52055 | 262.69 | 795 | 771 | 195.2 |
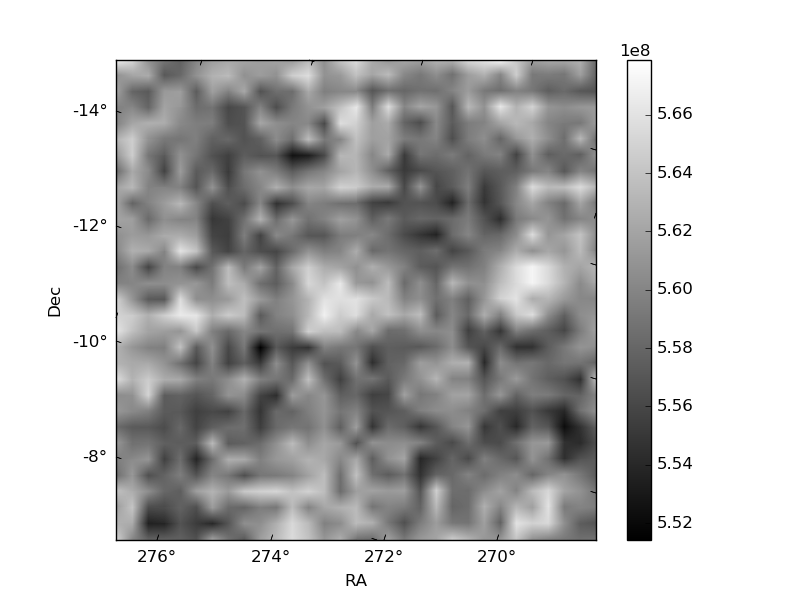
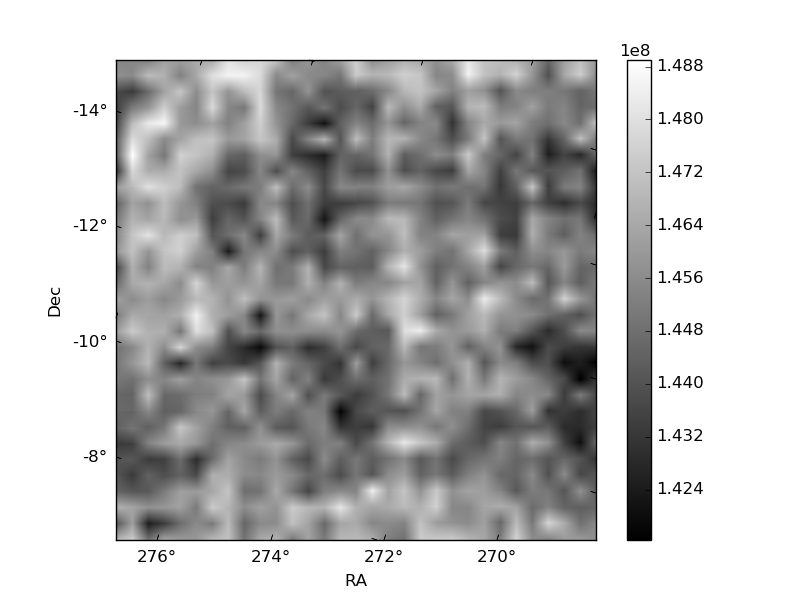
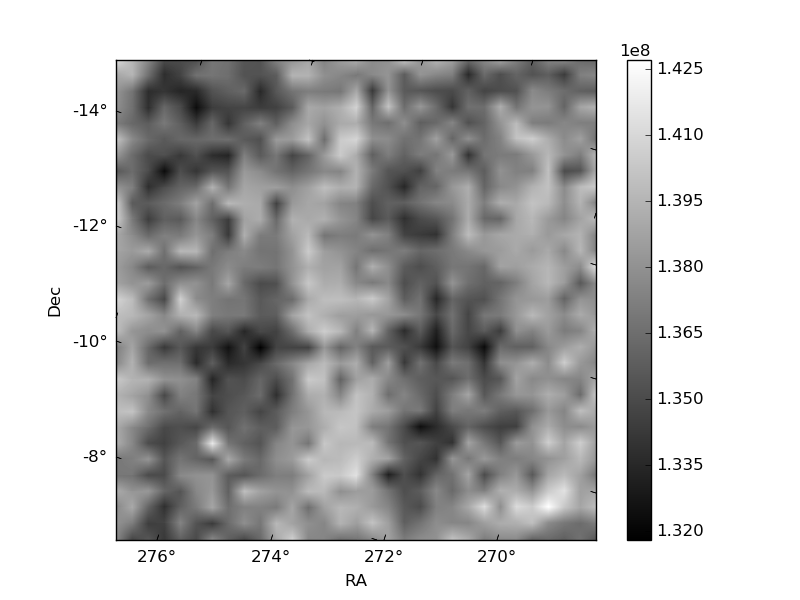
Histogram calculated using DETX and DETY for each event in the final _common_clean file
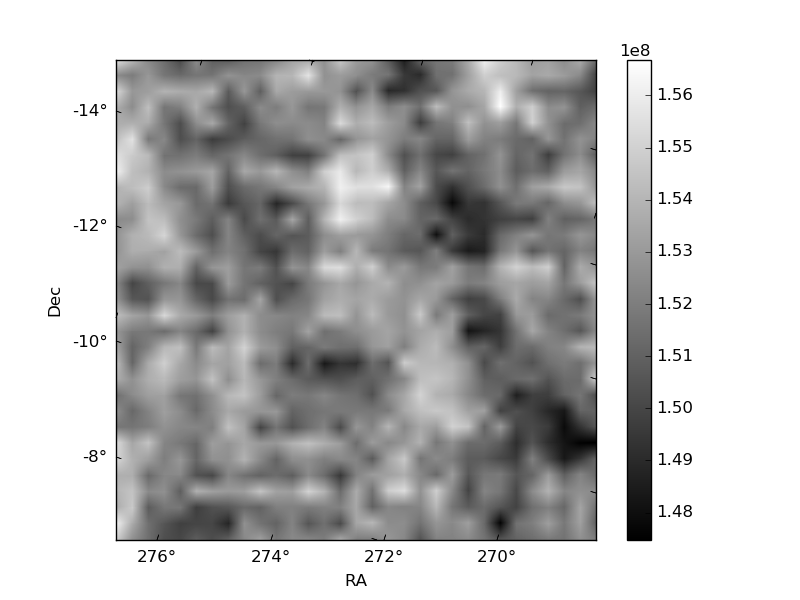
| Quadrant A | 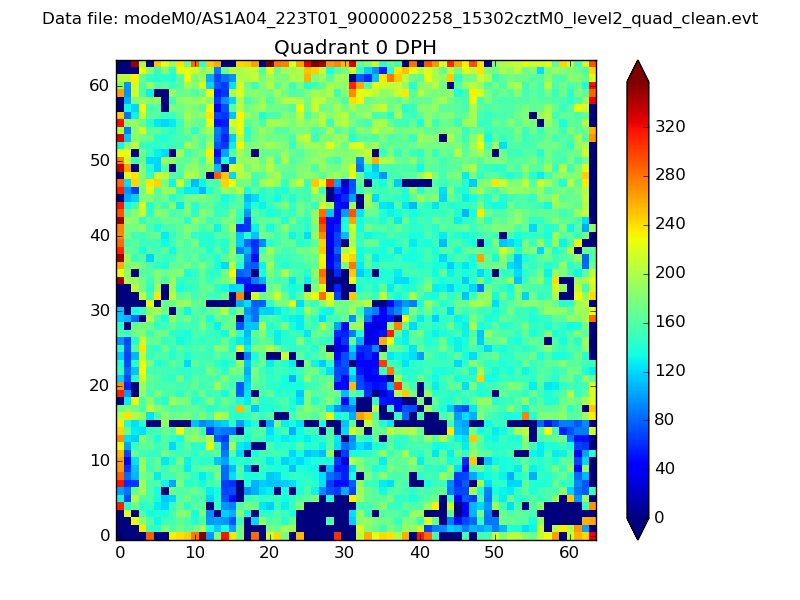 |
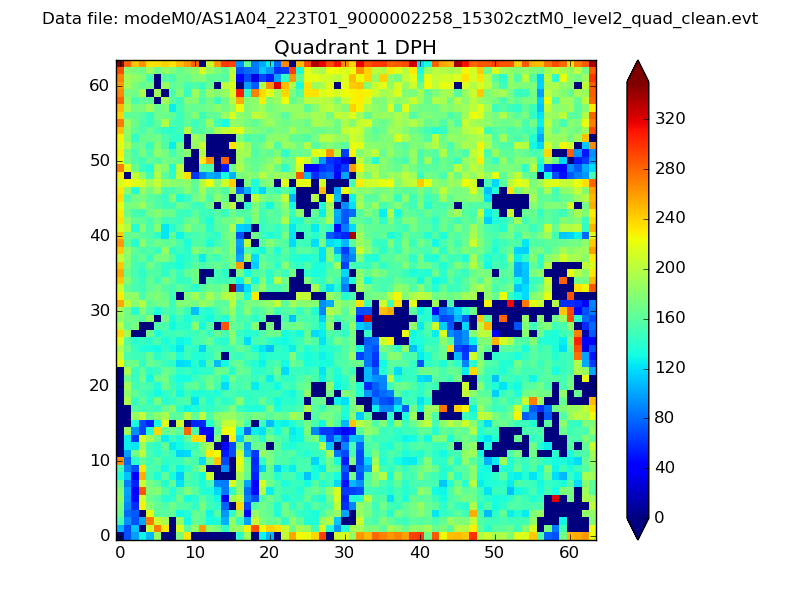 |
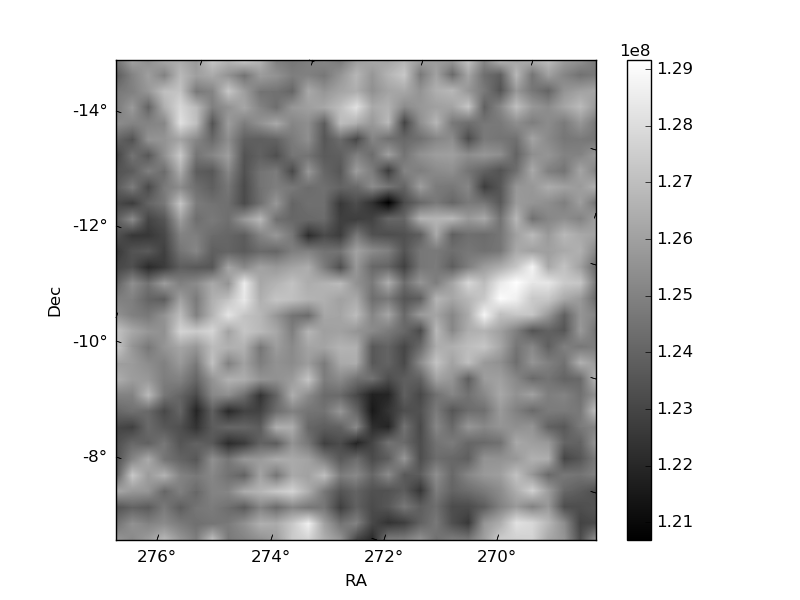
Quadrant B |
|---|---|---|---|
| Quadrant D | 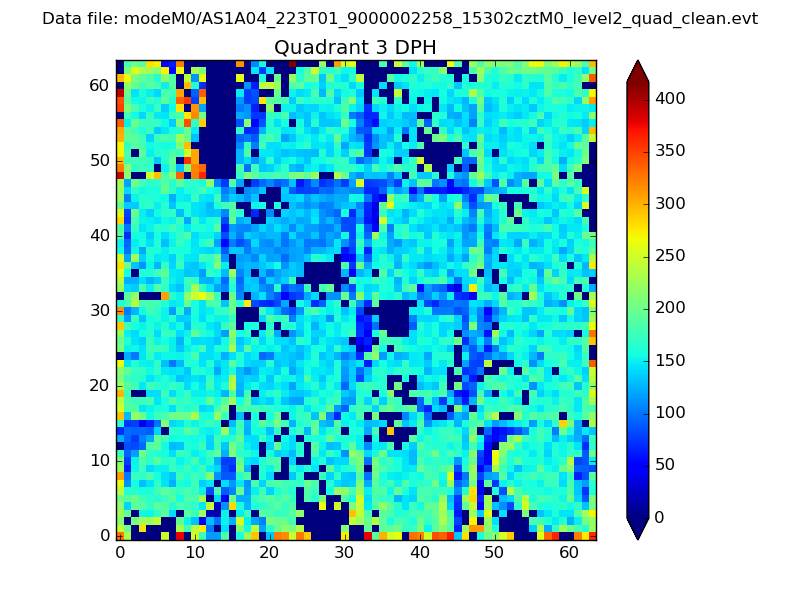 |
 |
Quadrant C |
| Plot type | Count rate plots | Images |
|---|---|---|
| Comparison with Poisson distribution Blue bars denote a histogram of data divided into 1 sec bins. Red curve is a Poisson curve with rate = median count rate of data. |
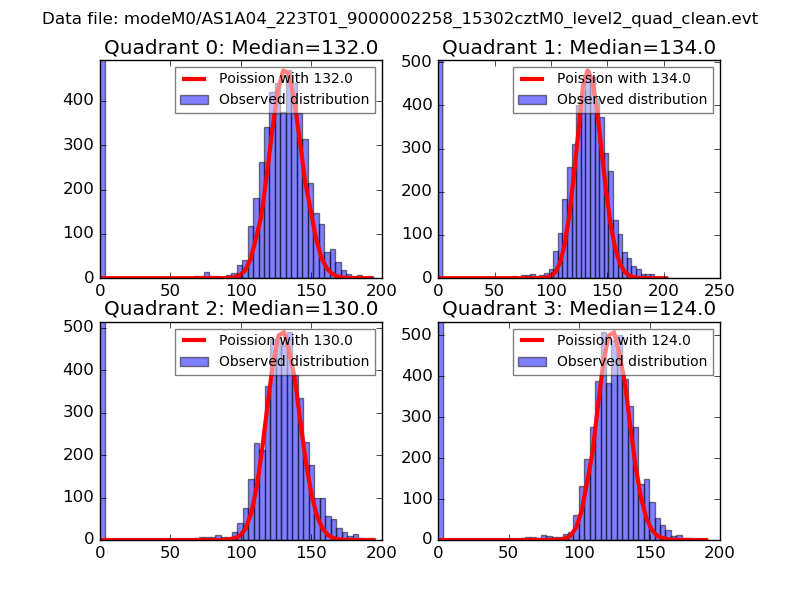 |
 |
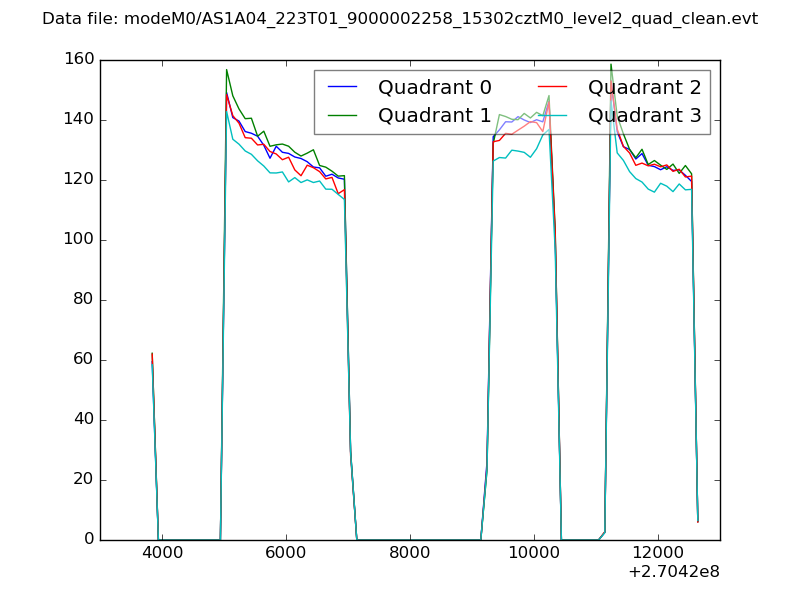
| Quadrant-wise count rates Data is divided into 100 sec bins |
 |
|
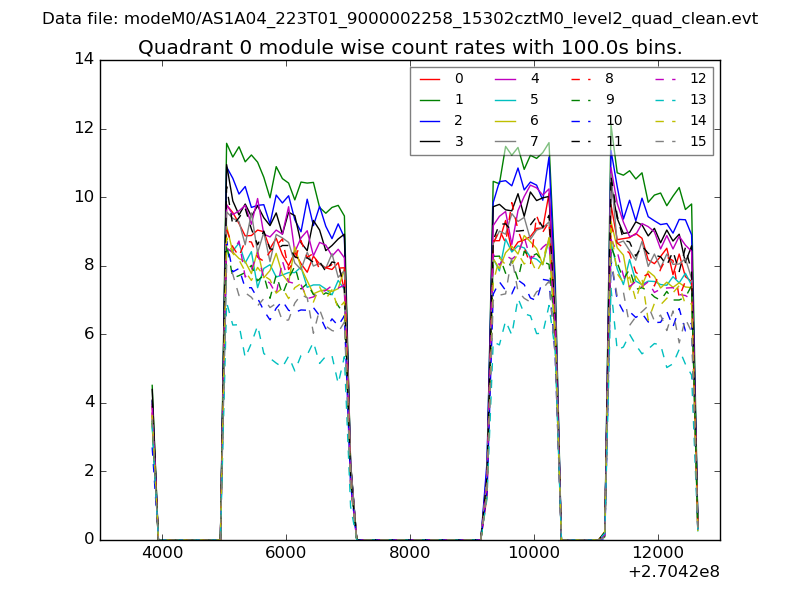
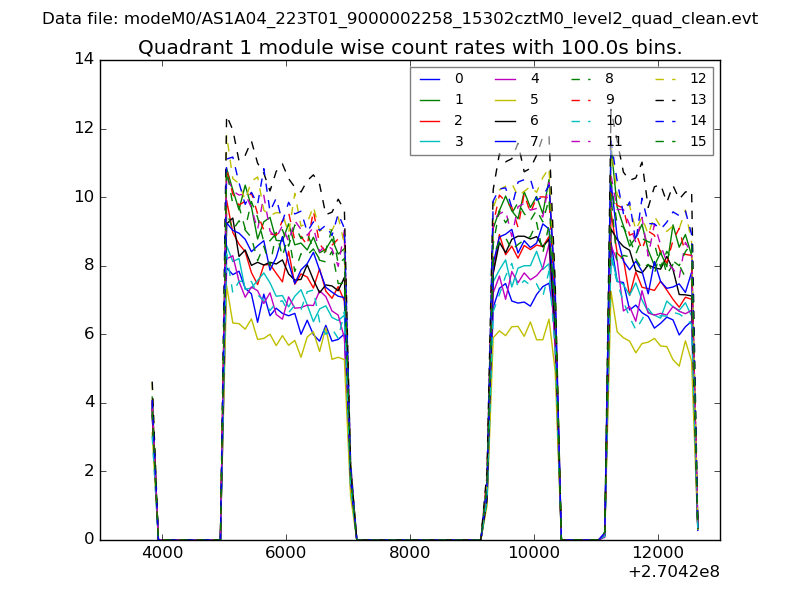
| Module-wise count rates for Quadrant A Data is divided into 100 sec bins |
 |
 |
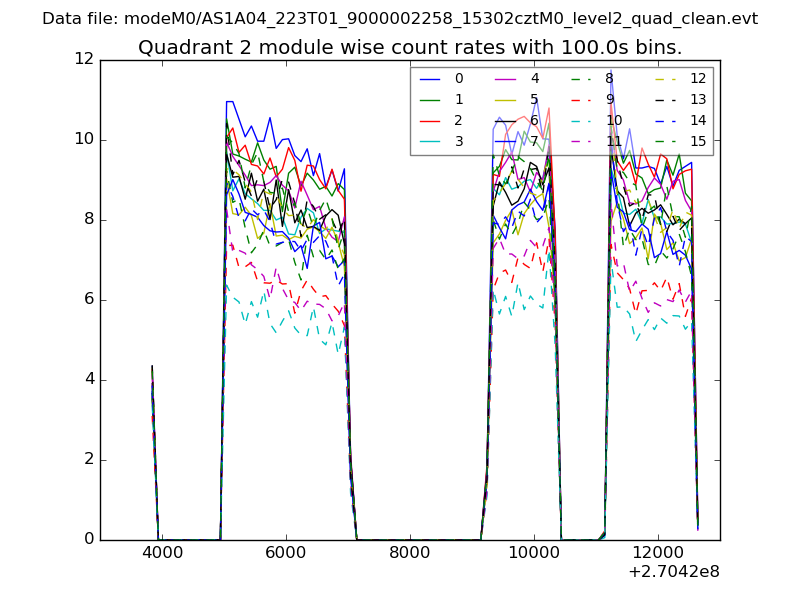
| Module-wise count rates for Quadrant B Data is divided into 100 sec bins |
 |
 |
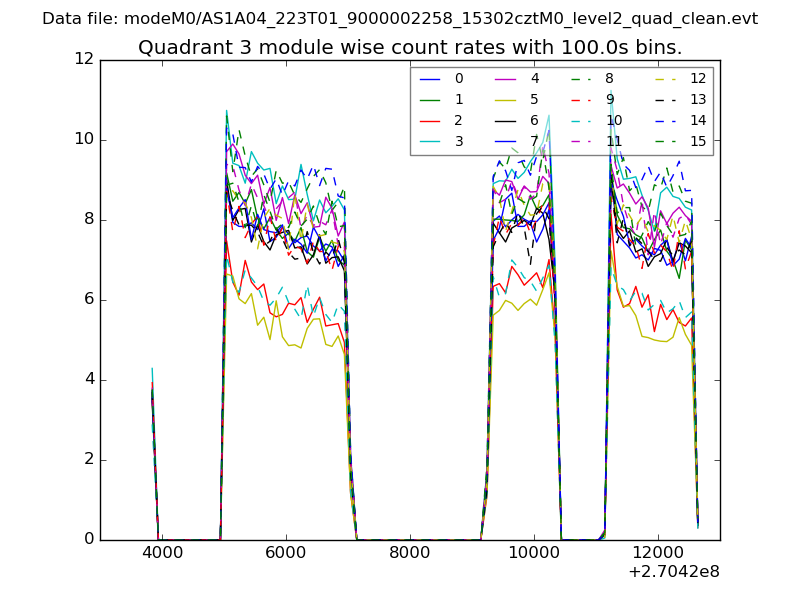
| Module-wise count rates for Quadrant C Data is divided into 100 sec bins |
 |
 |
| Module-wise count rates for Quadrant D Data is divided into 100 sec bins |
 |
 |
| Parameter | Plot |
|---|---|
| CZT HV Monitor | 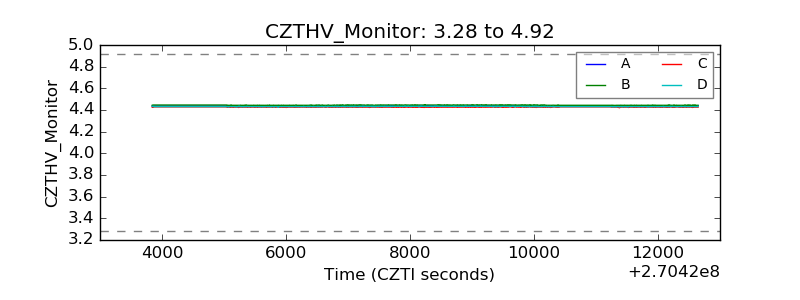 |
| D_VDD | 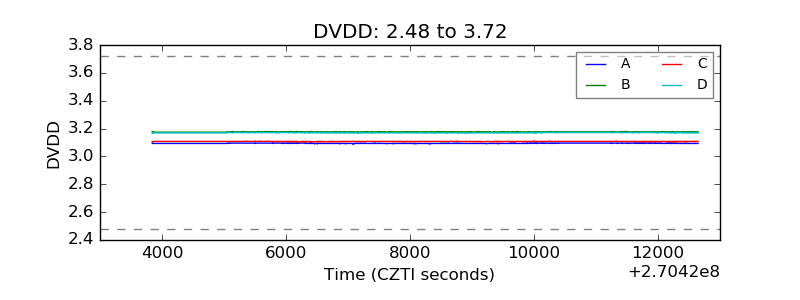 |
| Temperature 1 | 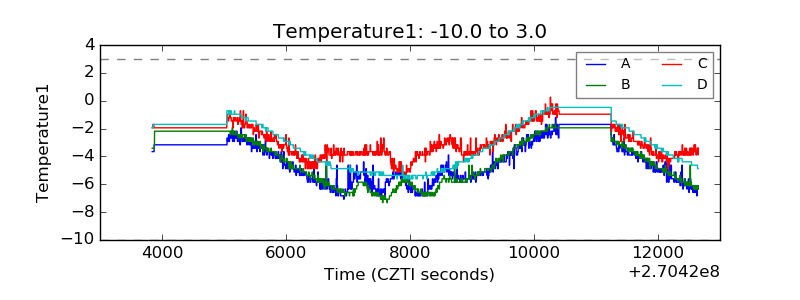 |
| Veto HV Monitor | 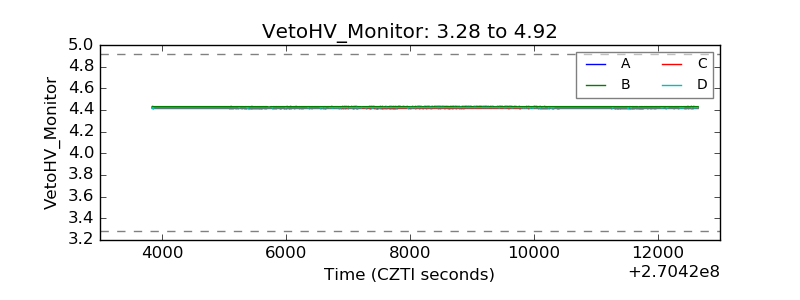 |
| Veto LLD | 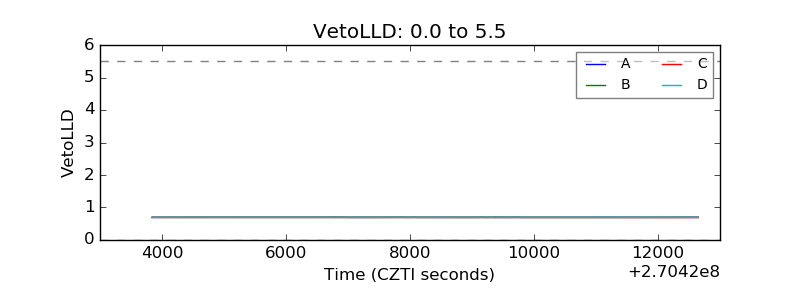 |
| Alpha Counter | 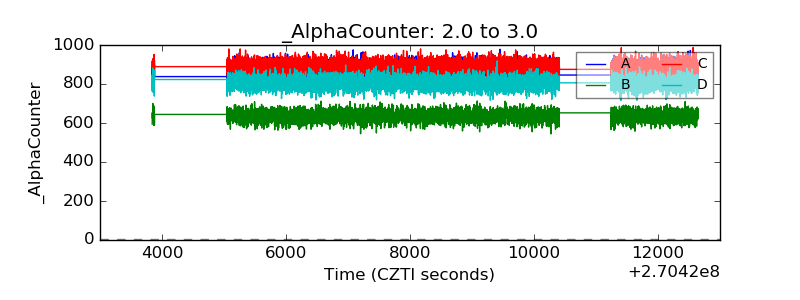 |
| _CPM_Rate | 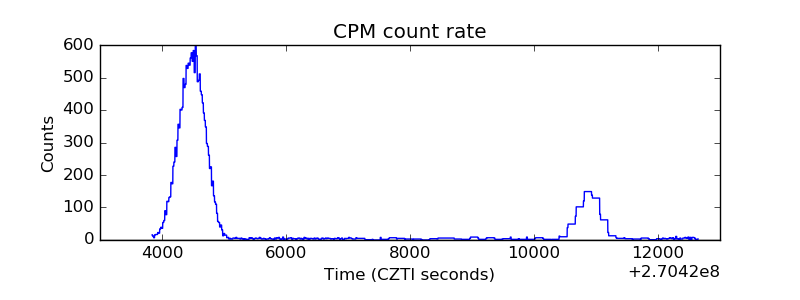 |
| CZT Counter | 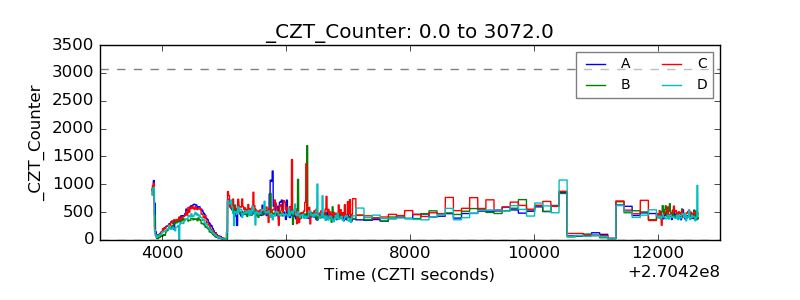 |
| +2.5 Volts monitor |  |
| +5 Volts monitor | 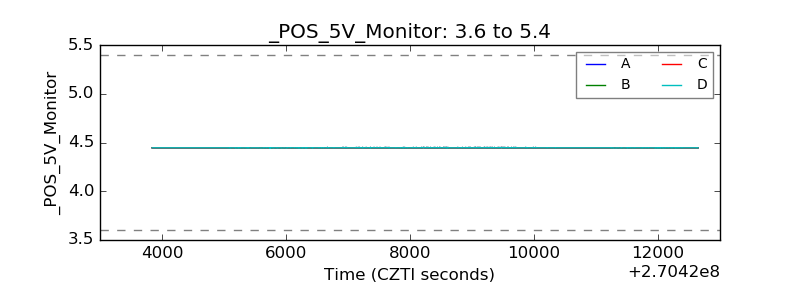 |
| _ROLL_ROT | 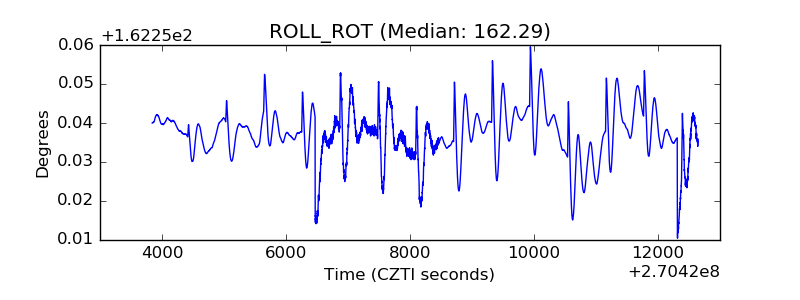 |
| _Roll_DEC | 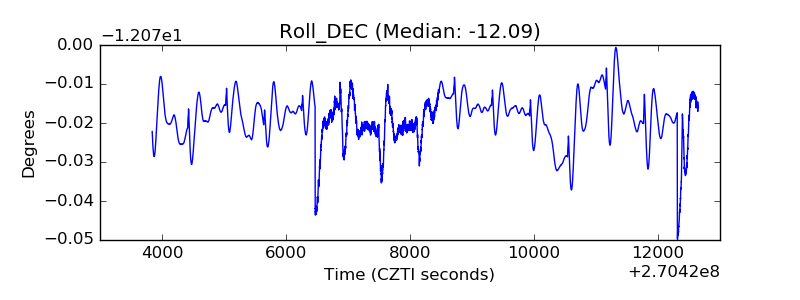 |
| _Roll_RA | 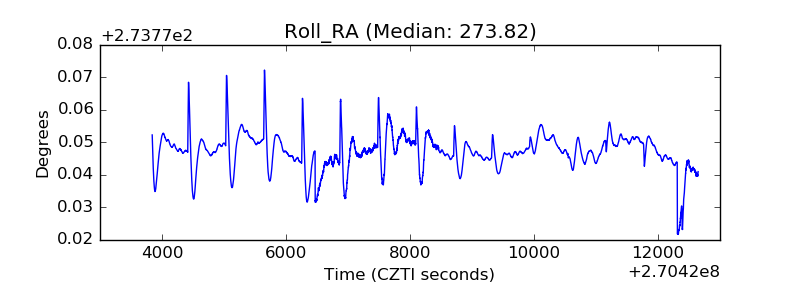 |
| Veto Counter | 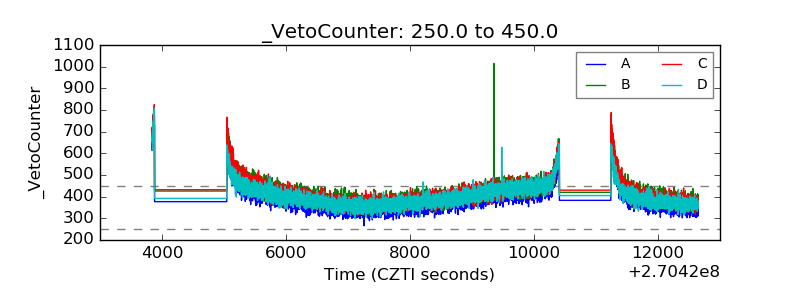 |