| Param | Original file | Final file |
|---|---|---|
| Filename | modeM0/AS1A04_223T01_9000002258_15303cztM0_level2.evt | modeM0/AS1A04_223T01_9000002258_15303cztM0_level2_quad_clean.evt |
| Size (bytes) | 492,580,800 | 97,701,120 |
| Size | 469.8 MB | 93.2 MB |
| Events in quadrant A | 3,393,726 | 620,055 |
| Events in quadrant B | 3,674,832 | 628,947 |
| Events in quadrant C | 3,831,470 | 617,055 |
| Events in quadrant D | 3,521,634 | 584,313 |
| Mode SS | |||
|---|---|---|---|
| Quadrant | BADHDUFLAG | Total packets | Discarded packets |
| A | 0 | 150 | 0 |
| B | 0 | 150 | 0 |
| C | 0 | 150 | 0 |
| D | 0 | 150 | 0 |
| Mode M9 | |||
|---|---|---|---|
| Quadrant | BADHDUFLAG | Total packets | Discarded packets |
| A | 0 | 9 | 0 |
| B | 0 | 9 | 0 |
| C | 0 | 9 | 0 |
| D | 0 | 10 | 0 |
| Mode M0 | |||
|---|---|---|---|
| Quadrant | BADHDUFLAG | Total packets | Discarded packets |
| A | 0 | 15041 | 3 |
| B | 0 | 15602 | 2 |
| C | 0 | 15720 | 2 |
| D | 0 | 15780 | 2 |
| Quadrant | Total seconds | Saturated seconds | Saturation percentage |
|---|---|---|---|
| A | 7297 | 37 | 0.507058% |
| B | 7297 | 64 | 0.877073% |
| C | 7297 | 25 | 0.342607% |
| D | 7297 | 84 | 1.151158% |
Noise dominated data is calculated using 1-second bins in cleaned event files. If a bin has >2000 counts, and if more than 50% of those come from <1% of pixels, then it is considered to be noise-dominated and hence unusable.
| Quadrant | # 1 sec bins | Bins with >0 counts | Bins with >2000 counts | High rate bins dominated by noise | Noise dominated (total time) | Noise dominated (detector-on time) | Marked lightcurve |
|---|---|---|---|---|---|---|---|
| A | 7753 | 7299 | 0 | 0 | 0.00% | 0.00% | 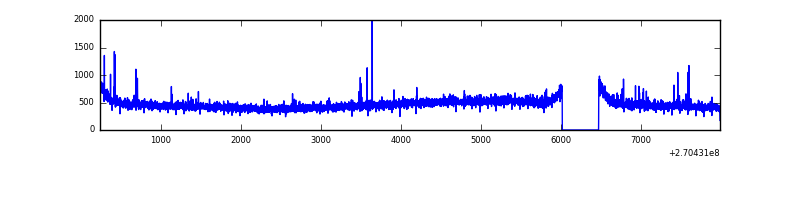 |
| B | 7753 | 7299 | 6 | 6 | 0.08% | 0.08% | 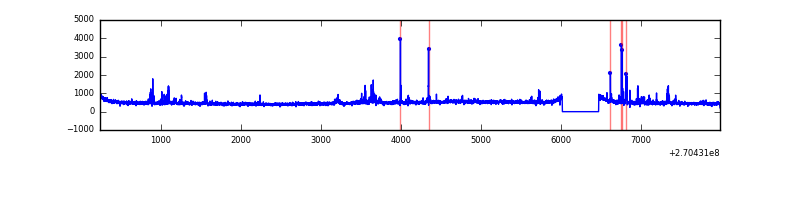 |
| C | 7753 | 7299 | 0 | 0 | 0.00% | 0.00% | 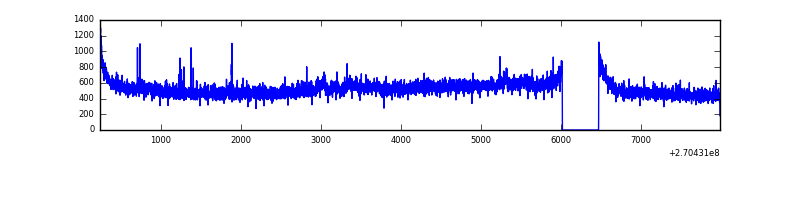 |
| D | 7753 | 7299 | 61 | 61 | 0.79% | 0.84% | 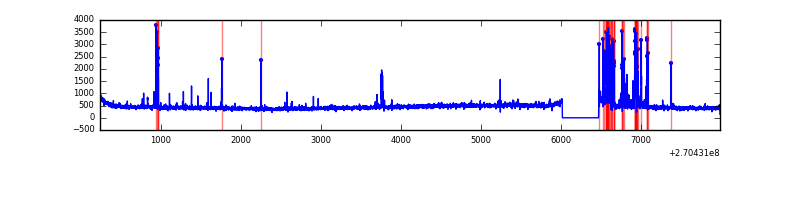 |
Top three noisy pixels from each quadrant. If the there are fewer than three noisy pixels in the level2.evt file, extra rows are filled as -1
| Pixel properties | Quadrant properties | ||||||
|---|---|---|---|---|---|---|---|
| Quadrant | DetID | PixID | Counts | Sigma | Mean | Median | Sigma |
| A | 9 | 143 | 33314 | 182.18 | 871 | 851 | 178.2 |
| A | 0 | 226 | 7906 | 39.59 | 871 | 851 | 178.2 |
| A | 12 | 194 | 6436 | 31.34 | 871 | 851 | 178.2 |
| B | 10 | 16 | 99982 | 588.53 | 874 | 850 | 168.4 |
| B | 0 | 189 | 54054 | 315.87 | 874 | 850 | 168.4 |
| B | 0 | 197 | 43568 | 253.61 | 874 | 850 | 168.4 |
| C | 3 | 233 | 535246 | 2747.99 | 842 | 848 | 194.5 |
| C | 7 | 247 | 10717 | 50.75 | 842 | 848 | 194.5 |
| C | 13 | 61 | 6035 | 26.67 | 842 | 848 | 194.5 |
| D | 7 | 38 | 286730 | 1379.18 | 838 | 812 | 207.3 |
| D | 10 | 70 | 31765 | 149.31 | 838 | 812 | 207.3 |
| D | 2 | 234 | 27582 | 129.13 | 838 | 812 | 207.3 |
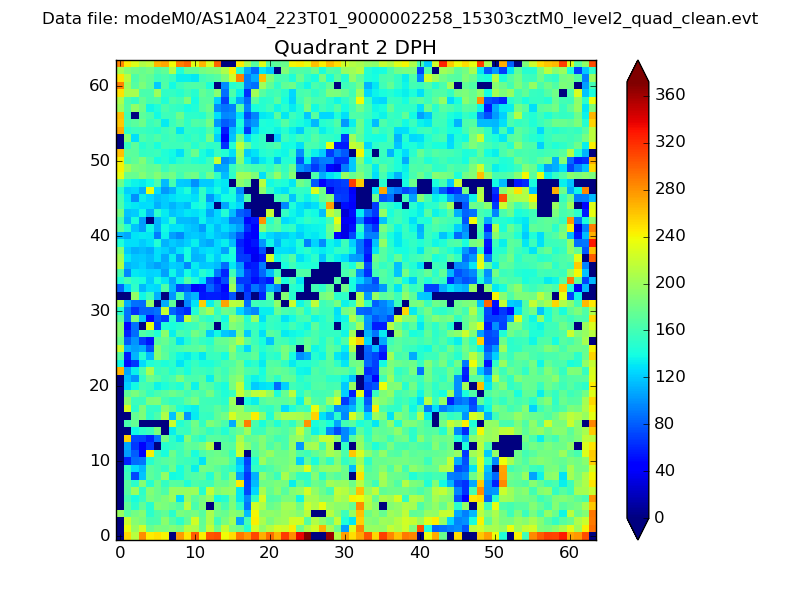
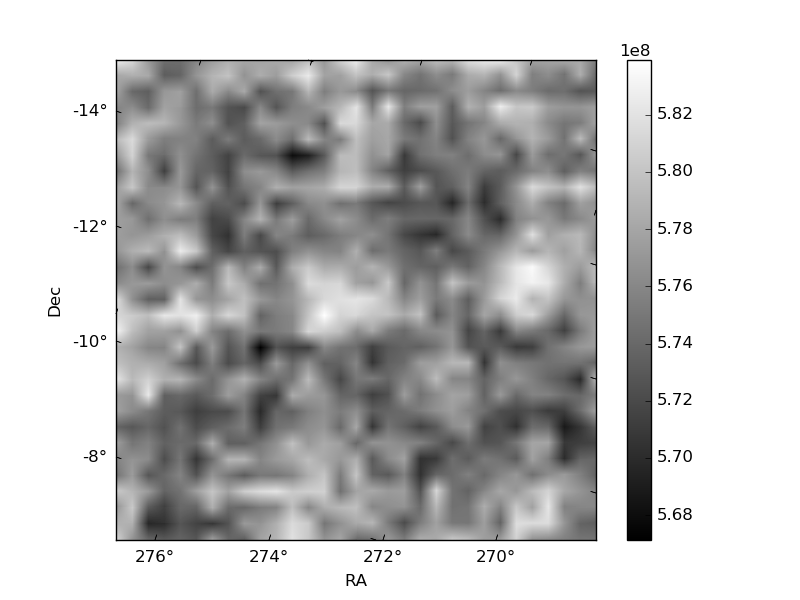
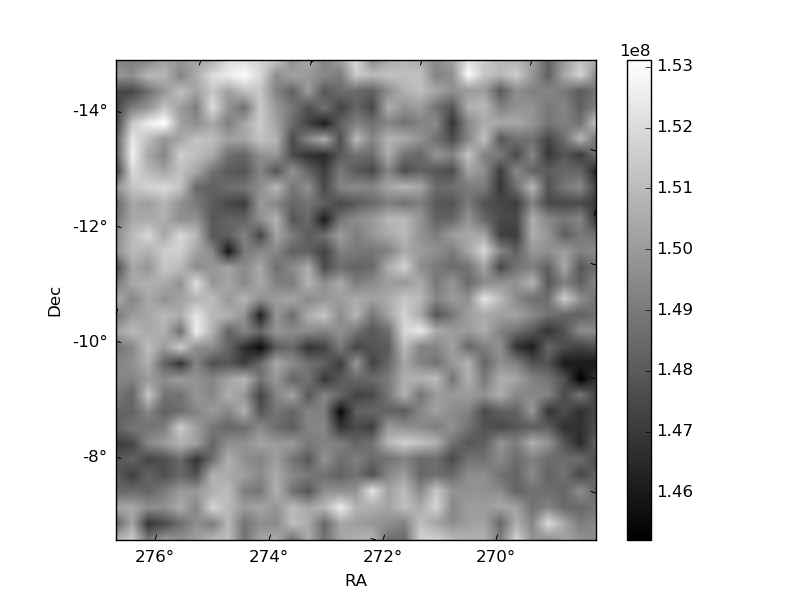
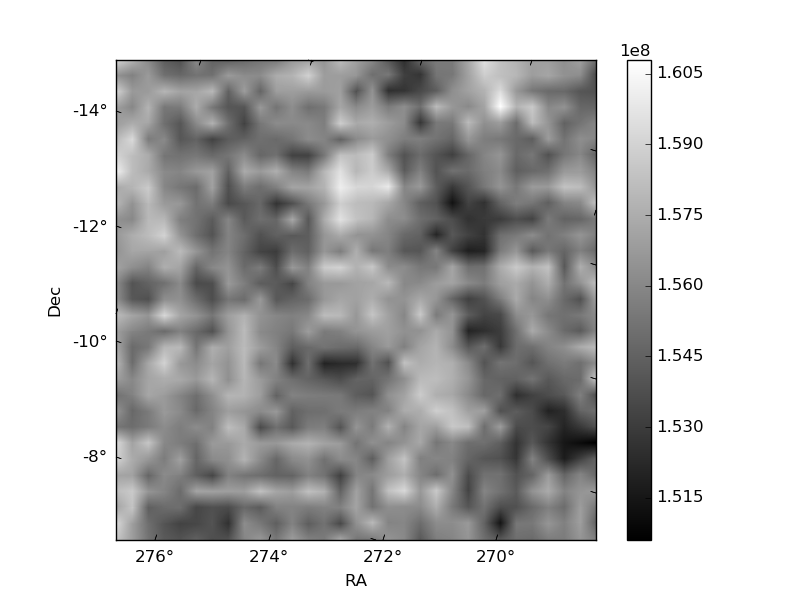
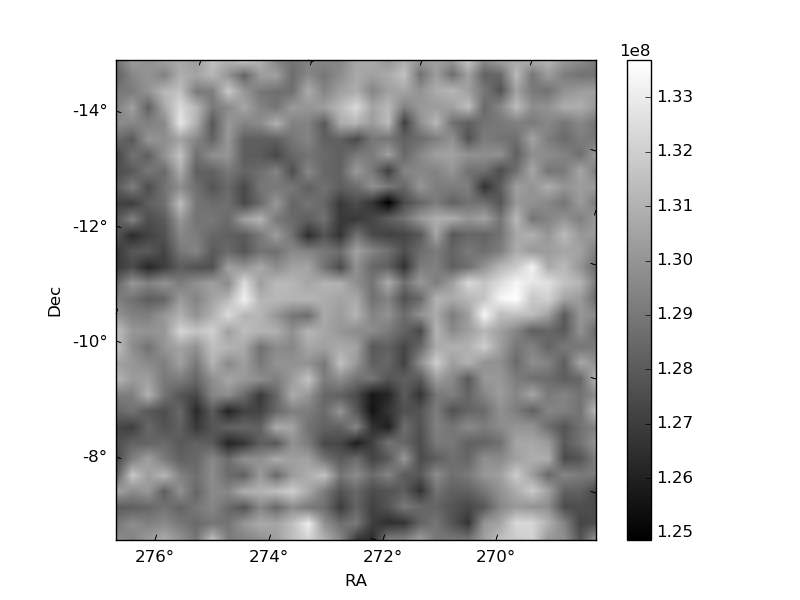
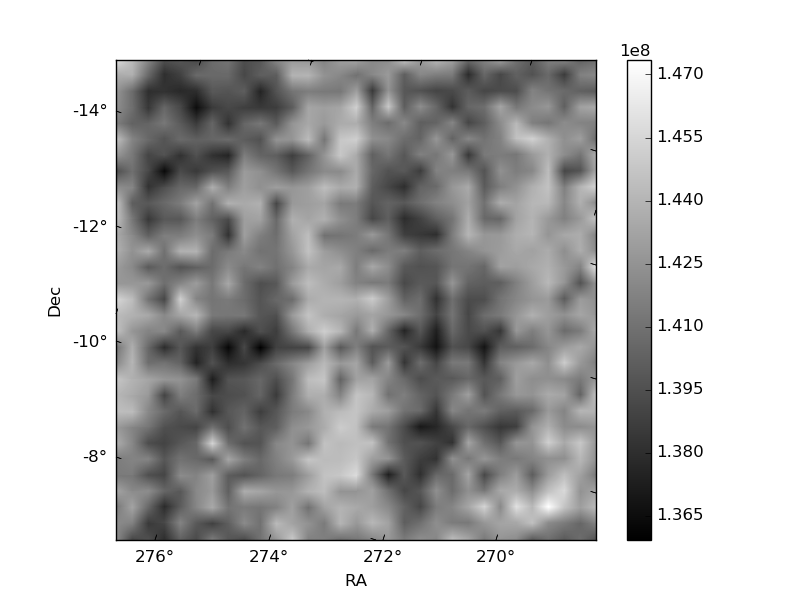
Histogram calculated using DETX and DETY for each event in the final _common_clean file
| Quadrant A | 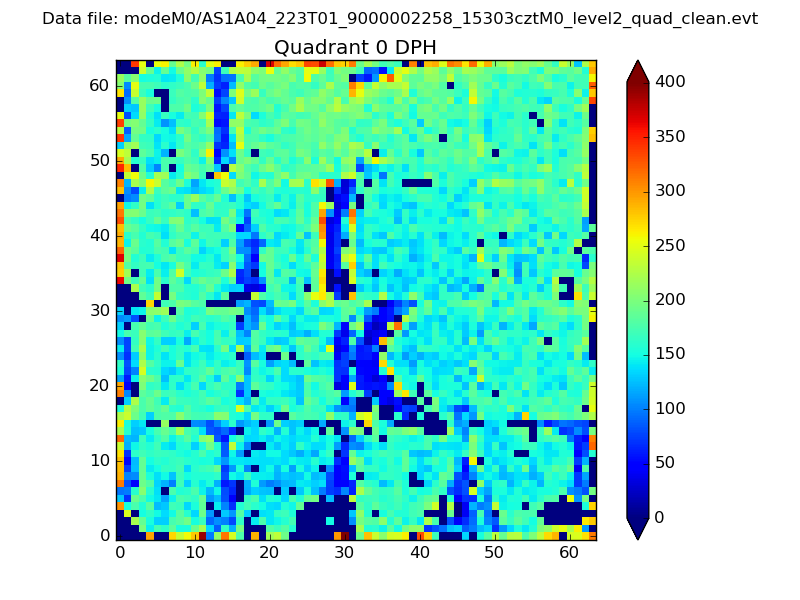 |
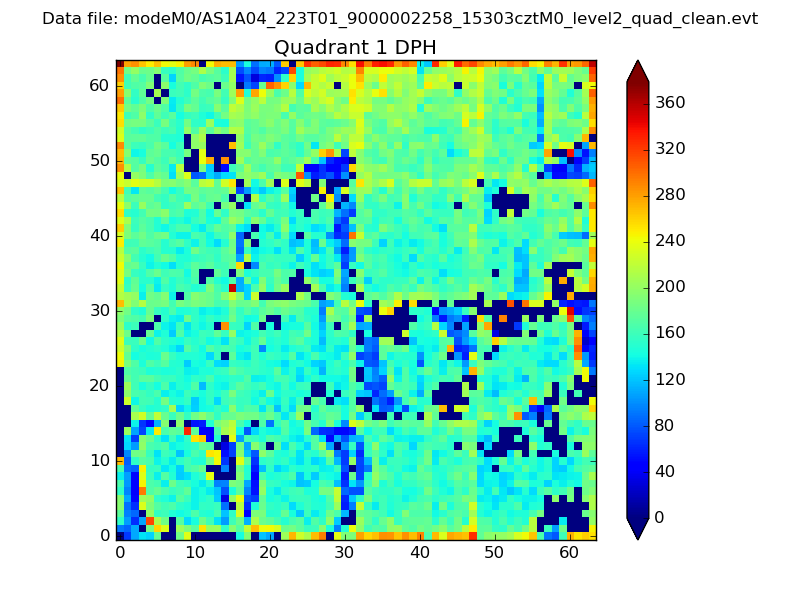 |
Quadrant B |
|---|---|---|---|
| Quadrant D | 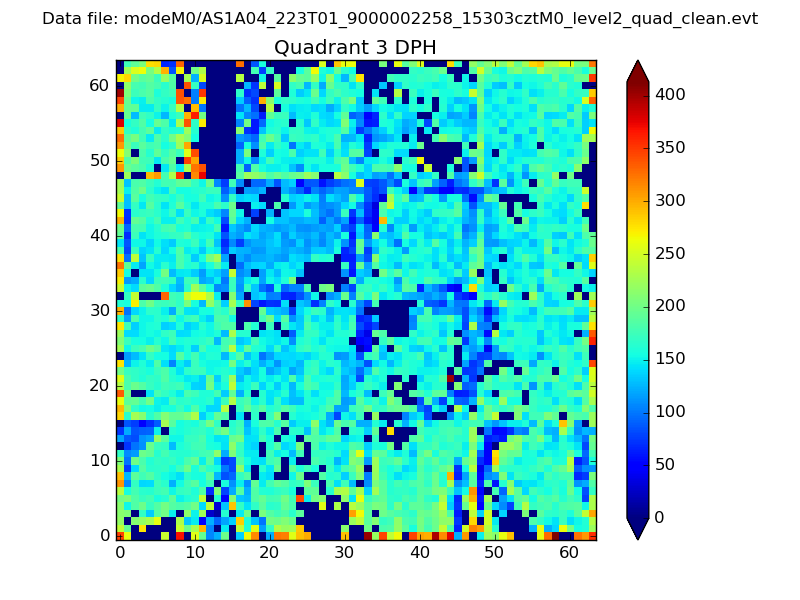 |
 |
Quadrant C |
| Plot type | Count rate plots | Images |
|---|---|---|
| Comparison with Poisson distribution Blue bars denote a histogram of data divided into 1 sec bins. Red curve is a Poisson curve with rate = median count rate of data. |
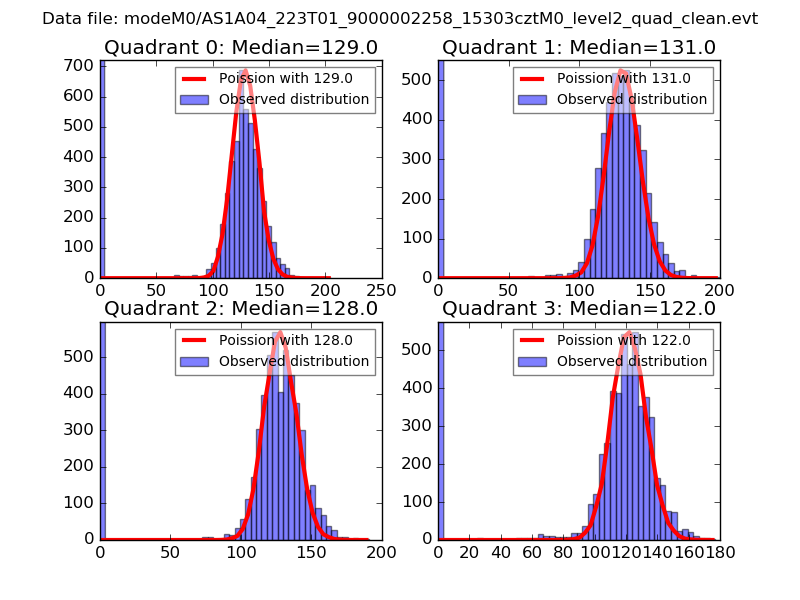 |
 |
| Quadrant-wise count rates Data is divided into 100 sec bins |
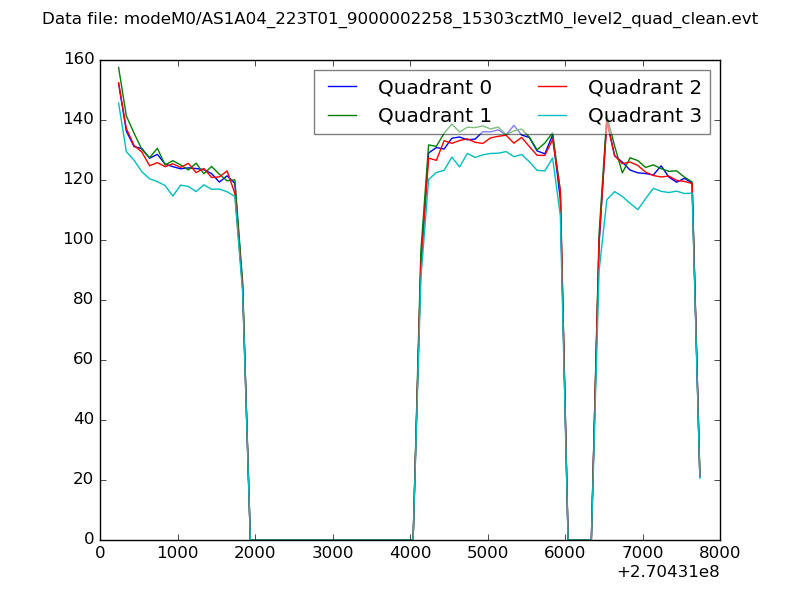 |
|
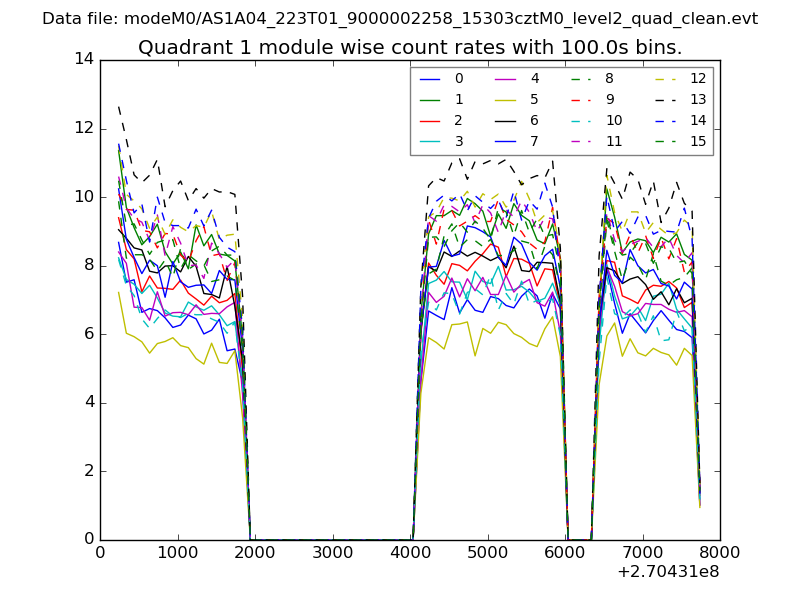
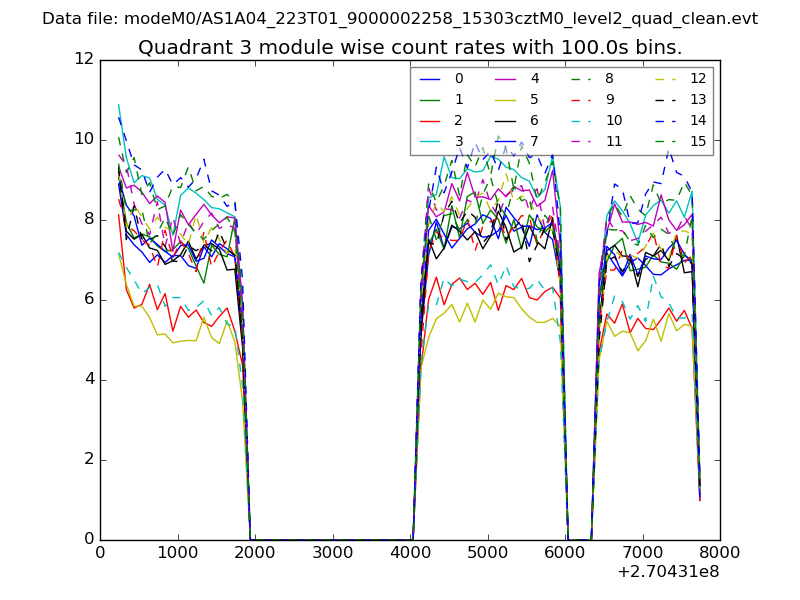
| Module-wise count rates for Quadrant A Data is divided into 100 sec bins |
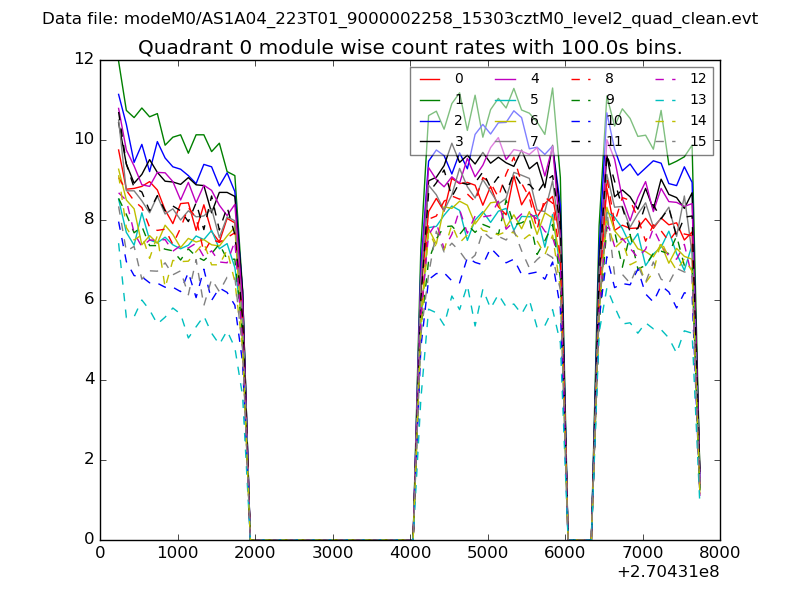 |
 |
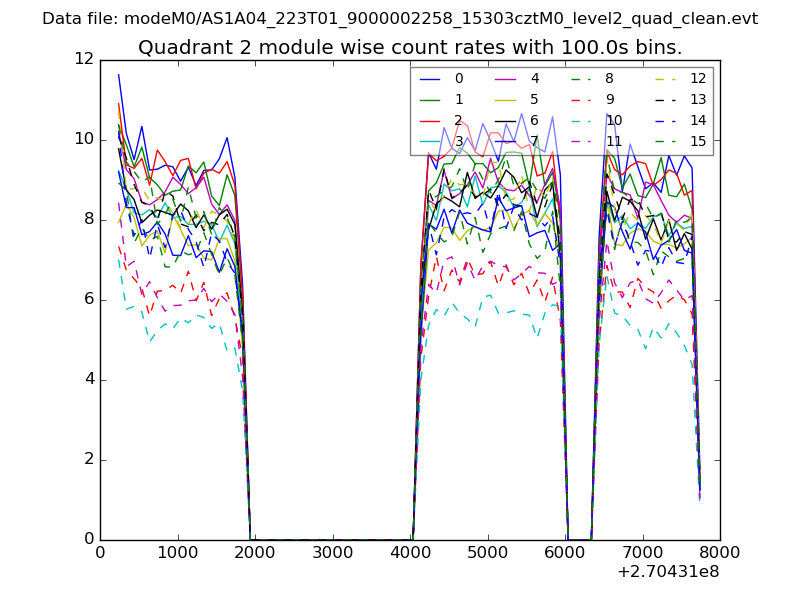
| Module-wise count rates for Quadrant B Data is divided into 100 sec bins |
 |
 |
| Module-wise count rates for Quadrant C Data is divided into 100 sec bins |
 |
 |
| Module-wise count rates for Quadrant D Data is divided into 100 sec bins |
 |
 |
| Parameter | Plot |
|---|---|
| CZT HV Monitor | 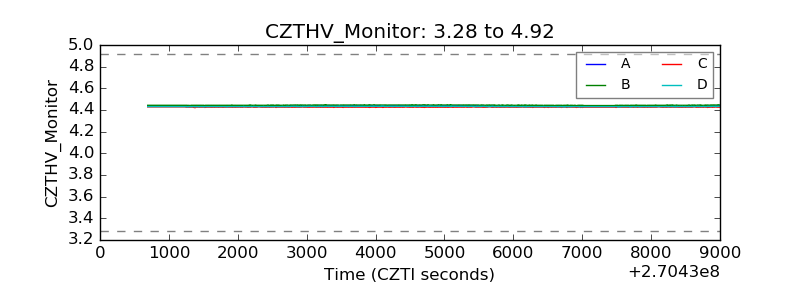 |
| D_VDD | 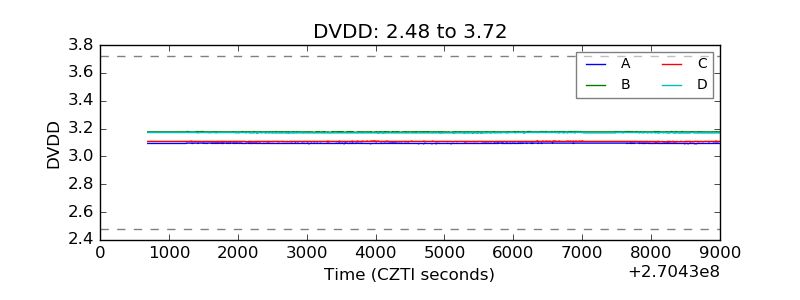 |
| Temperature 1 | 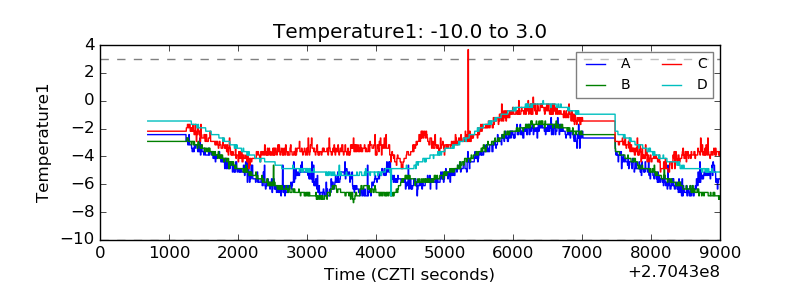 |
| Veto HV Monitor | 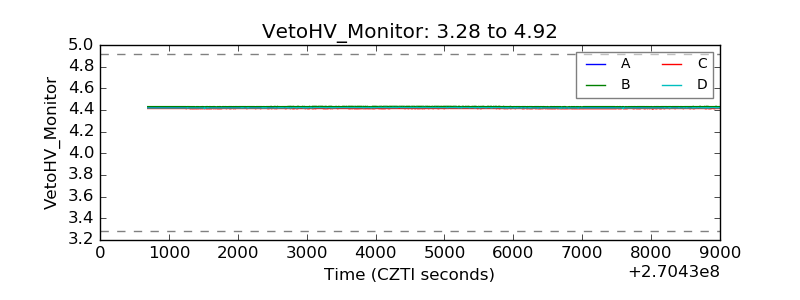 |
| Veto LLD | 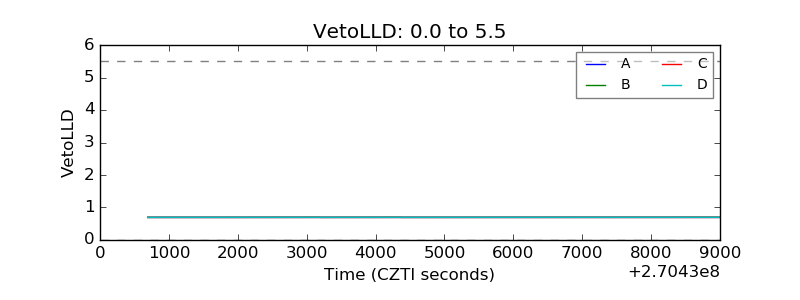 |
| Alpha Counter | 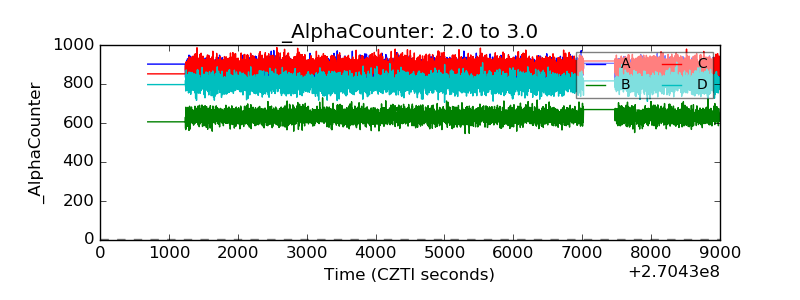 |
| _CPM_Rate |  |
| CZT Counter | 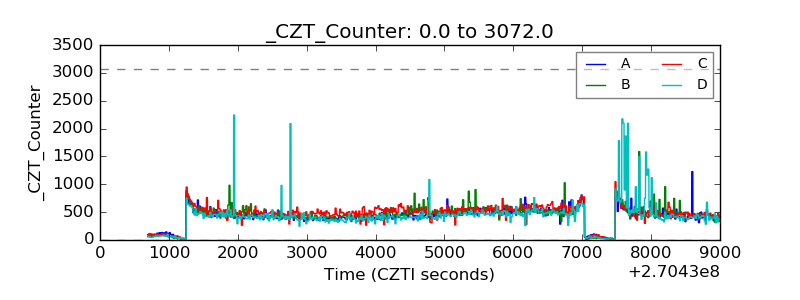 |
| +2.5 Volts monitor |  |
| +5 Volts monitor |  |
| _ROLL_ROT | 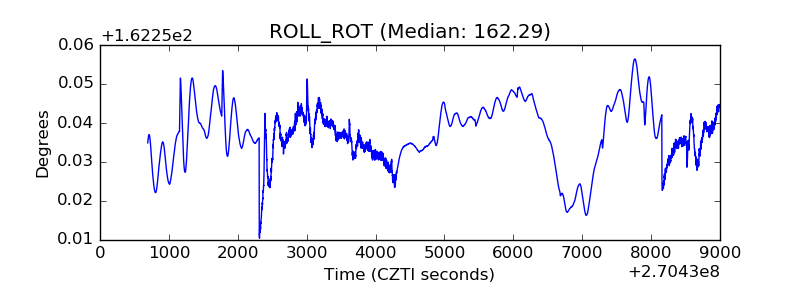 |
| _Roll_DEC | 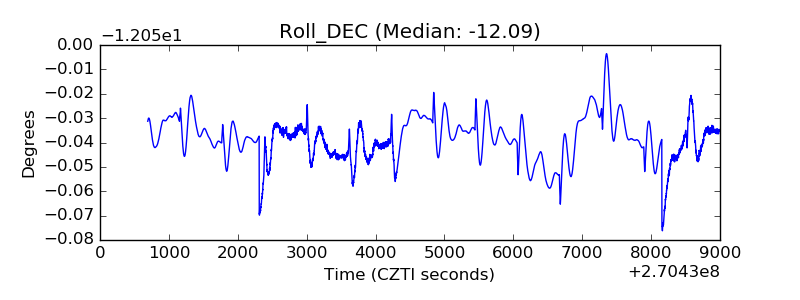 |
| _Roll_RA | 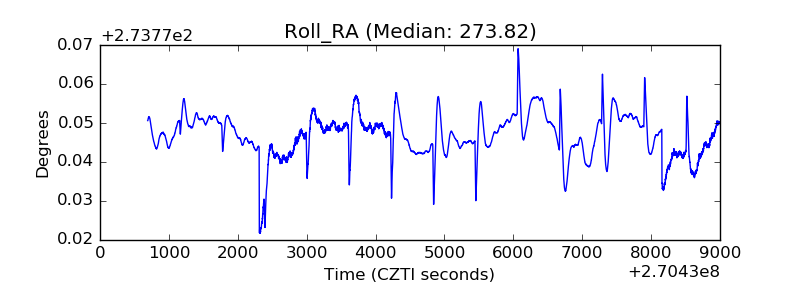 |
| Veto Counter | 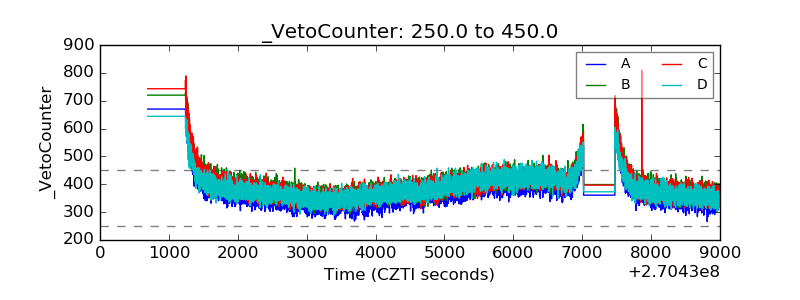 |