| Param | Original file | Final file |
|---|---|---|
| Filename | modeM0/AS1A04_223T01_9000002258_15304cztM0_level2.evt | modeM0/AS1A04_223T01_9000002258_15304cztM0_level2_quad_clean.evt |
| Size (bytes) | 581,581,440 | 110,059,200 |
| Size | 554.6 MB | 105.0 MB |
| Events in quadrant A | 3,926,008 | 699,074 |
| Events in quadrant B | 4,186,405 | 707,571 |
| Events in quadrant C | 4,689,690 | 689,378 |
| Events in quadrant D | 4,243,069 | 655,428 |
| Mode SS | |||
|---|---|---|---|
| Quadrant | BADHDUFLAG | Total packets | Discarded packets |
| A | 0 | 174 | 0 |
| B | 0 | 174 | 0 |
| C | 0 | 174 | 0 |
| D | 0 | 174 | 0 |
| Mode M9 | |||
|---|---|---|---|
| Quadrant | BADHDUFLAG | Total packets | Discarded packets |
| A | 0 | 7 | 0 |
| B | 0 | 7 | 0 |
| C | 0 | 7 | 0 |
| D | 0 | 7 | 0 |
| Mode M0 | |||
|---|---|---|---|
| Quadrant | BADHDUFLAG | Total packets | Discarded packets |
| A | 0 | 17280 | 3 |
| B | 0 | 17754 | 2 |
| C | 0 | 19139 | 2 |
| D | 0 | 18613 | 2 |
| Quadrant | Total seconds | Saturated seconds | Saturation percentage |
|---|---|---|---|
| A | 8362 | 75 | 0.896915% |
| B | 8362 | 127 | 1.518775% |
| C | 8362 | 168 | 2.009089% |
| D | 8362 | 143 | 1.710117% |
Noise dominated data is calculated using 1-second bins in cleaned event files. If a bin has >2000 counts, and if more than 50% of those come from <1% of pixels, then it is considered to be noise-dominated and hence unusable.
| Quadrant | # 1 sec bins | Bins with >0 counts | Bins with >2000 counts | High rate bins dominated by noise | Noise dominated (total time) | Noise dominated (detector-on time) | Marked lightcurve |
|---|---|---|---|---|---|---|---|
| A | 9128 | 8365 | 0 | 0 | 0.00% | 0.00% | 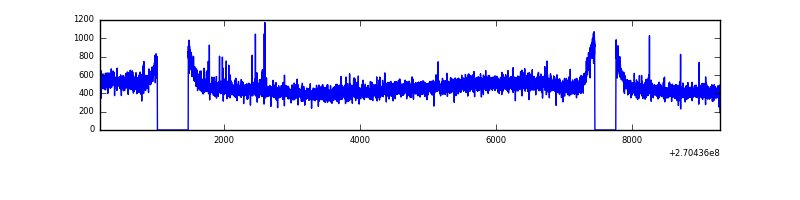 |
| B | 9128 | 8365 | 6 | 6 | 0.07% | 0.07% | 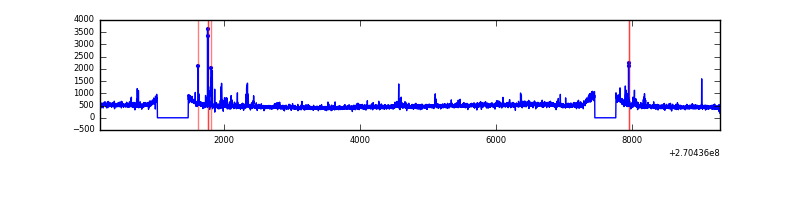 |
| C | 9128 | 8365 | 72 | 72 | 0.79% | 0.86% | 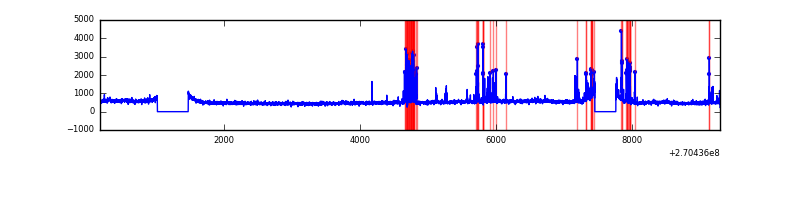 |
| D | 9128 | 8365 | 81 | 81 | 0.89% | 0.97% | 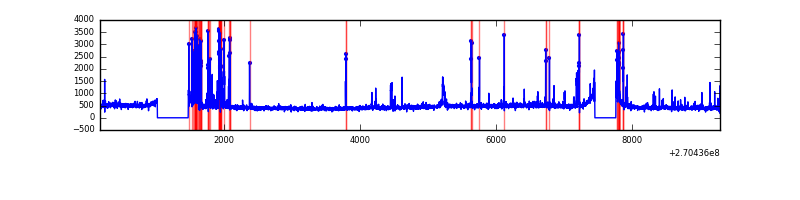 |
Top three noisy pixels from each quadrant. If the there are fewer than three noisy pixels in the level2.evt file, extra rows are filled as -1
| Pixel properties | Quadrant properties | ||||||
|---|---|---|---|---|---|---|---|
| Quadrant | DetID | PixID | Counts | Sigma | Mean | Median | Sigma |
| A | 9 | 143 | 22028 | 101.65 | 1014 | 992 | 206.9 |
| A | 0 | 226 | 9215 | 39.73 | 1014 | 992 | 206.9 |
| A | 12 | 194 | 7636 | 32.1 | 1014 | 992 | 206.9 |
| B | 0 | 189 | 68089 | 338.25 | 1014 | 985 | 198.4 |
| B | 0 | 197 | 42283 | 208.17 | 1014 | 985 | 198.4 |
| B | 12 | 111 | 22952 | 110.73 | 1014 | 985 | 198.4 |
| C | 3 | 233 | 501008 | 2215.08 | 970 | 975 | 225.7 |
| C | 4 | 254 | 397973 | 1758.64 | 970 | 975 | 225.7 |
| C | 13 | 61 | 6865 | 26.09 | 970 | 975 | 225.7 |
| D | 7 | 38 | 325369 | 1358.49 | 971 | 942 | 238.8 |
| D | 2 | 33 | 96057 | 398.28 | 971 | 942 | 238.8 |
| D | 1 | 52 | 92919 | 385.14 | 971 | 942 | 238.8 |
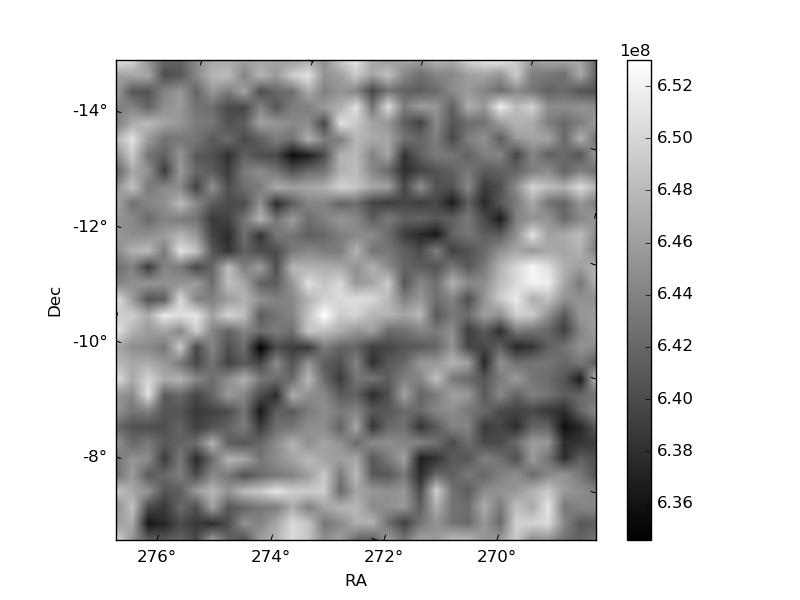
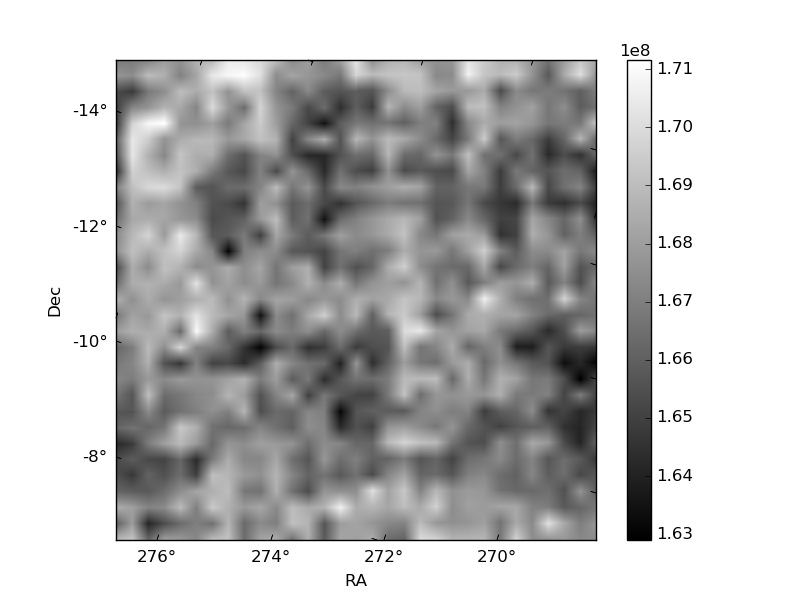
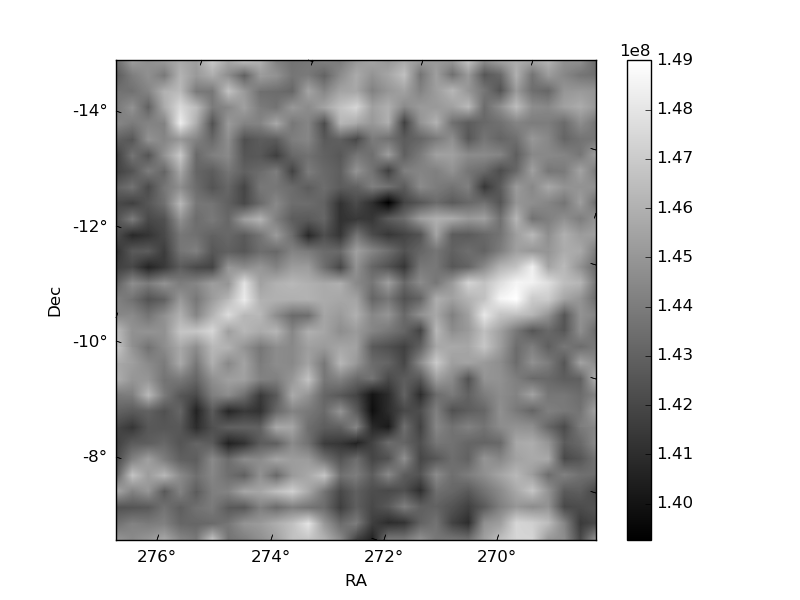
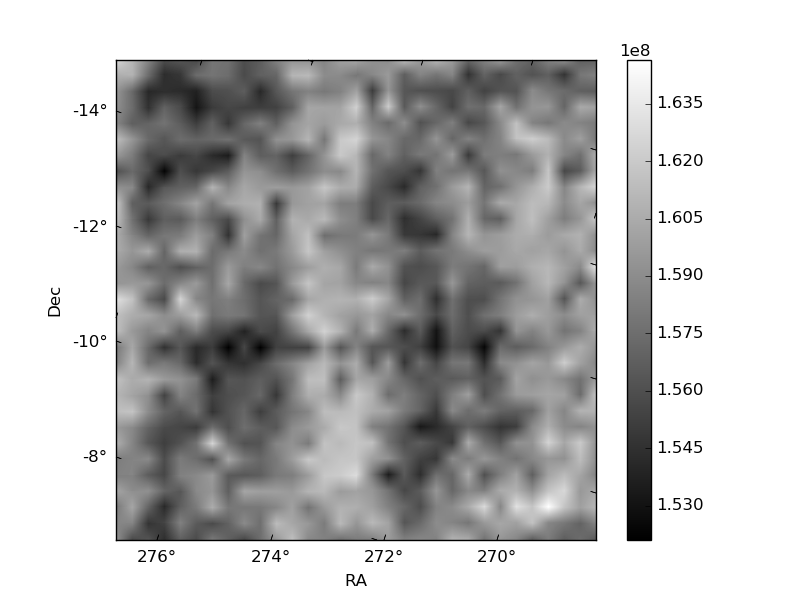
Histogram calculated using DETX and DETY for each event in the final _common_clean file
| Quadrant A | 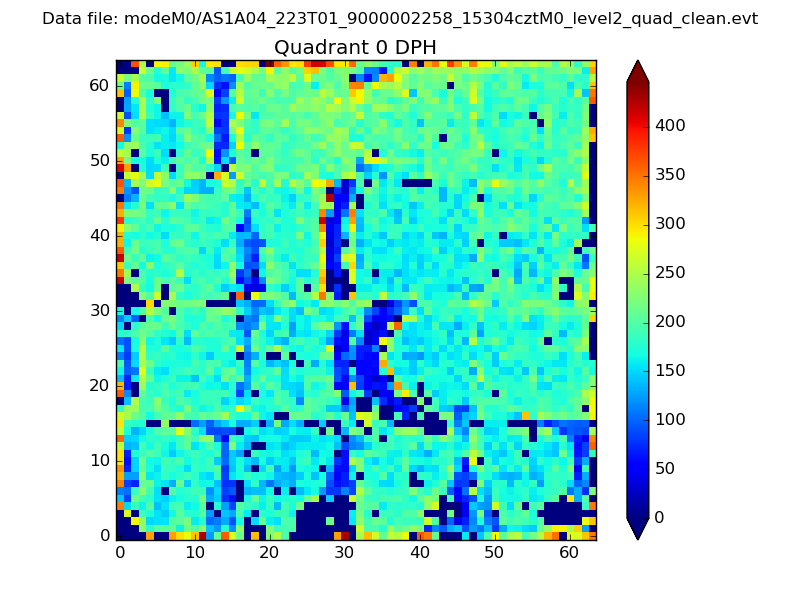 |
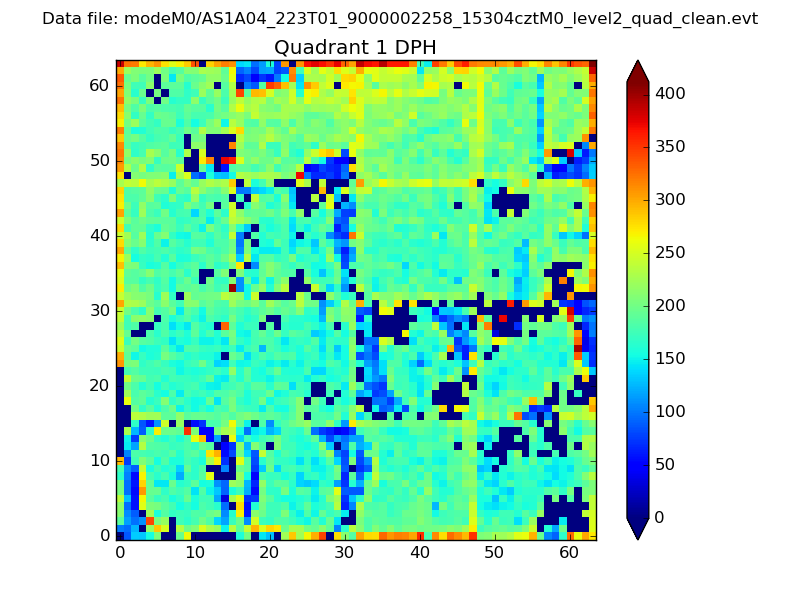 |
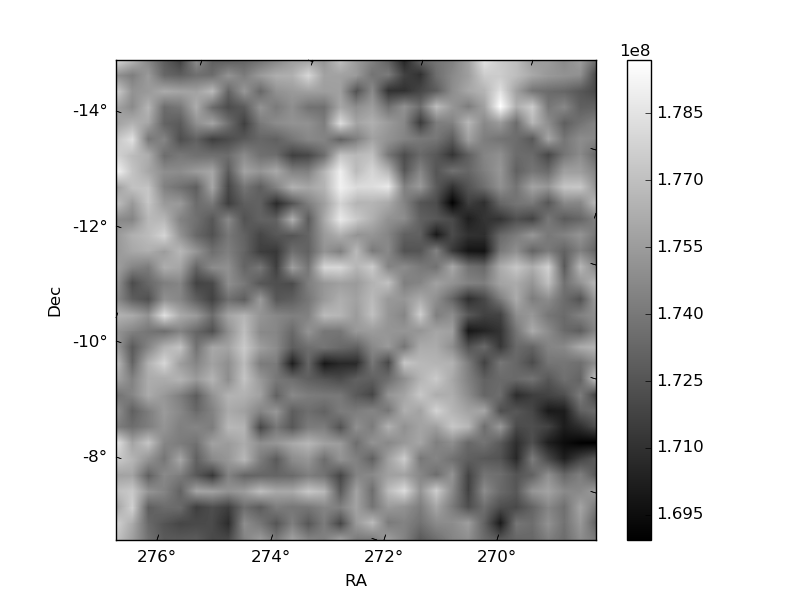
Quadrant B |
|---|---|---|---|
| Quadrant D | 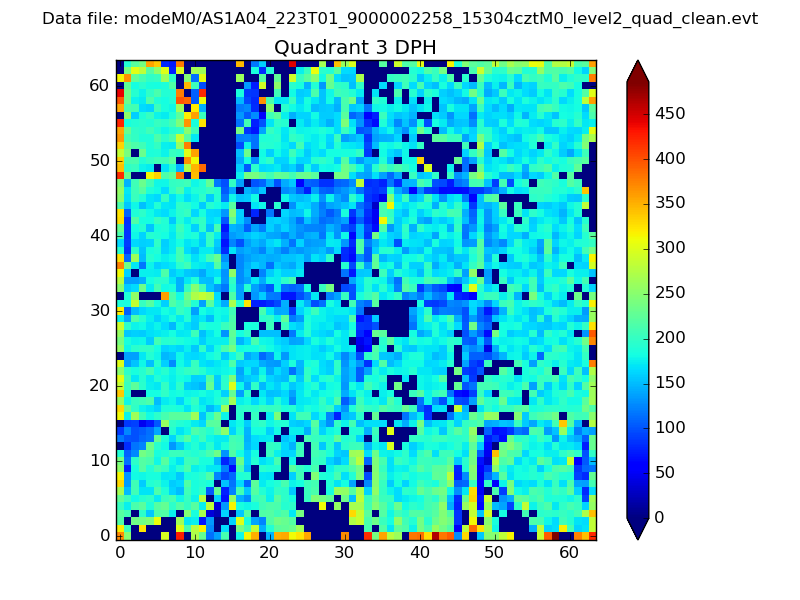 |
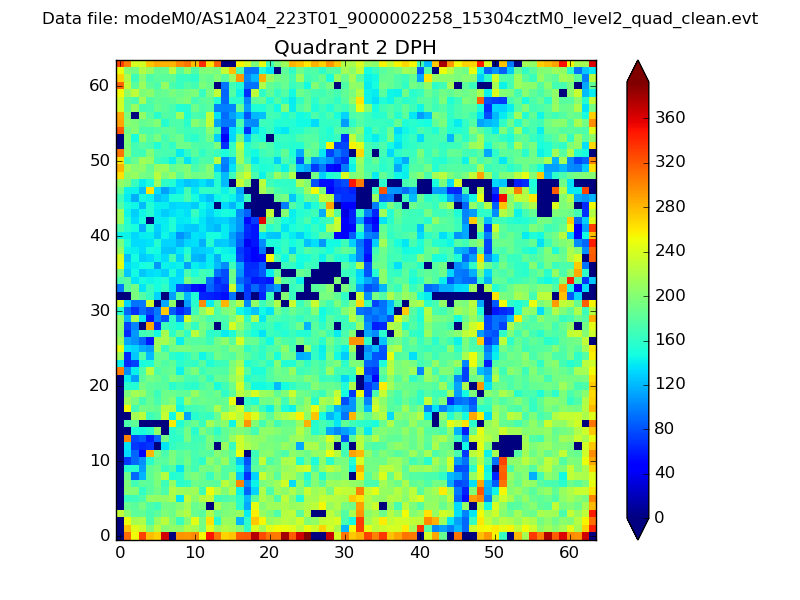 |
Quadrant C |
| Plot type | Count rate plots | Images |
|---|---|---|
| Comparison with Poisson distribution Blue bars denote a histogram of data divided into 1 sec bins. Red curve is a Poisson curve with rate = median count rate of data. |
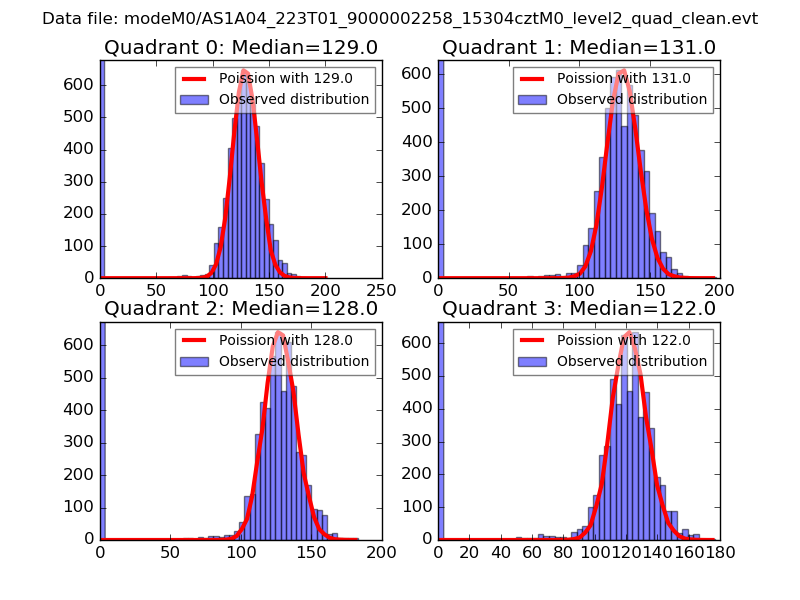 |
 |
| Quadrant-wise count rates Data is divided into 100 sec bins |
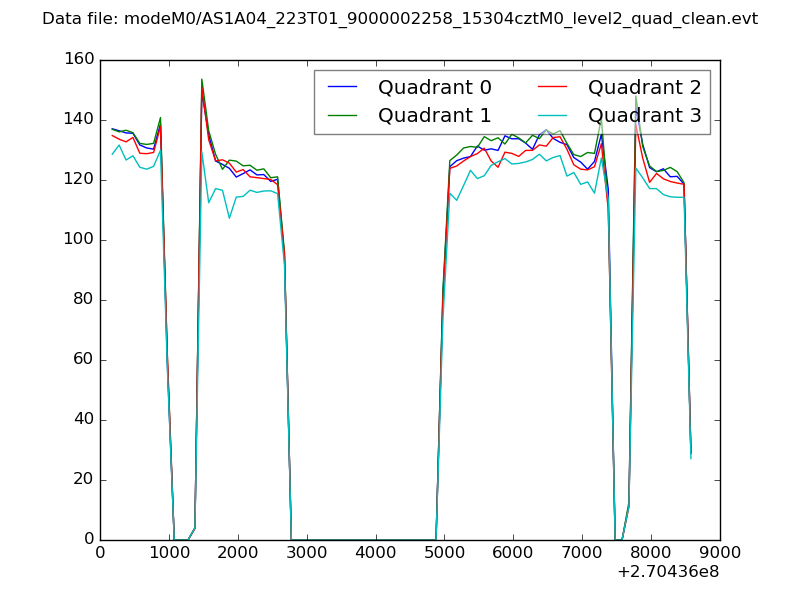 |
|
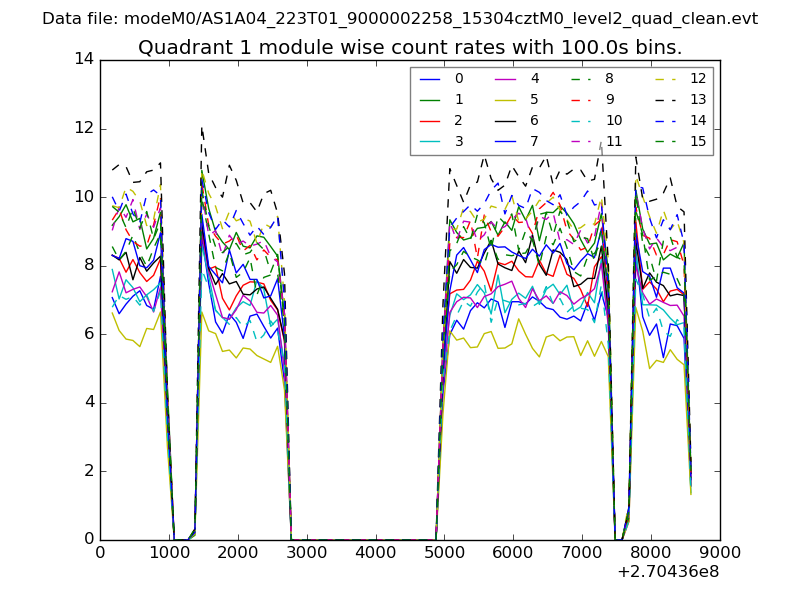
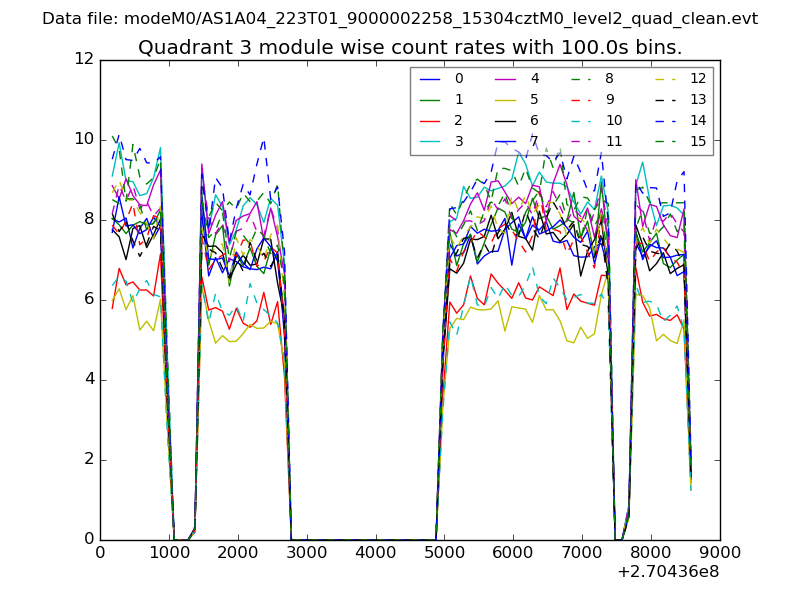
| Module-wise count rates for Quadrant A Data is divided into 100 sec bins |
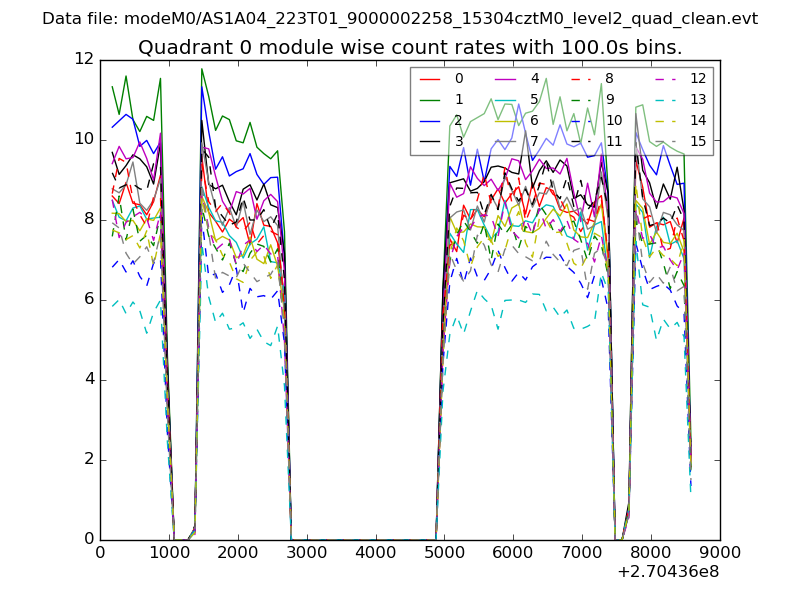 |
 |
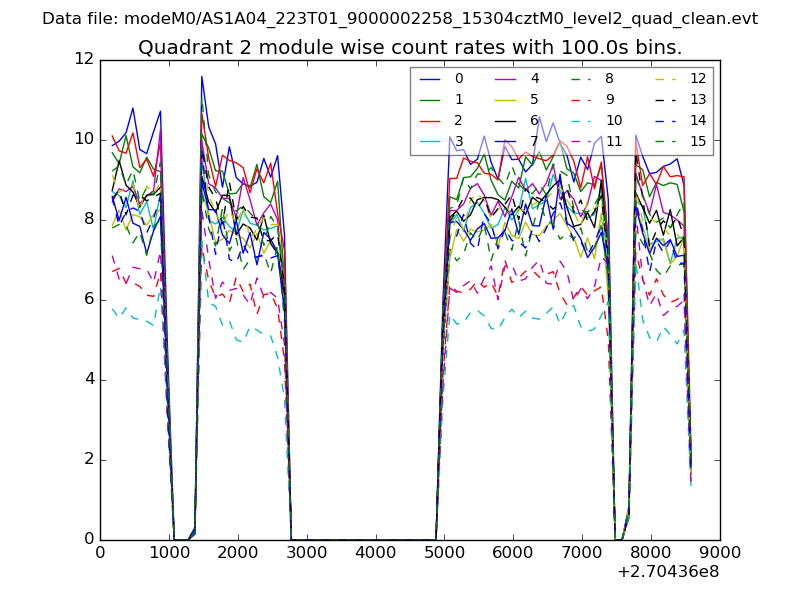
| Module-wise count rates for Quadrant B Data is divided into 100 sec bins |
 |
 |
| Module-wise count rates for Quadrant C Data is divided into 100 sec bins |
 |
 |
| Module-wise count rates for Quadrant D Data is divided into 100 sec bins |
 |
 |
| Parameter | Plot |
|---|---|
| CZT HV Monitor | 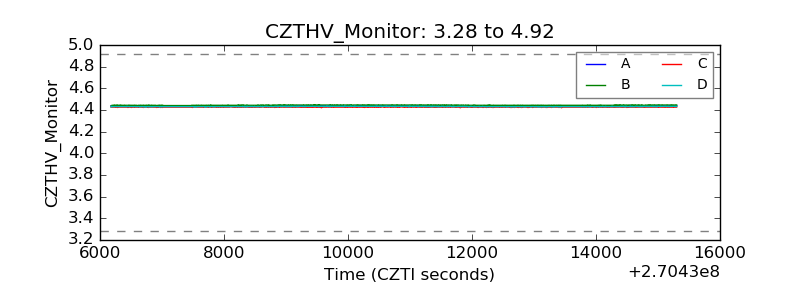 |
| D_VDD | 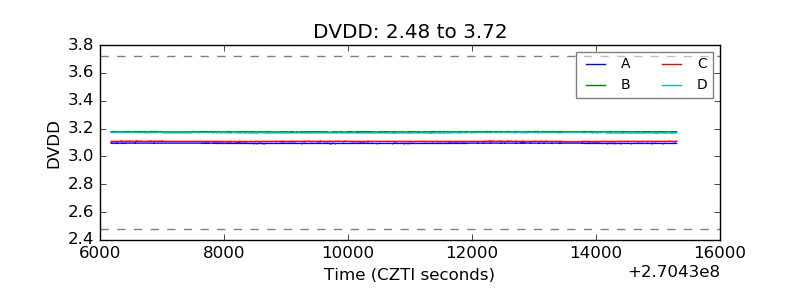 |
| Temperature 1 |  |
| Veto HV Monitor | 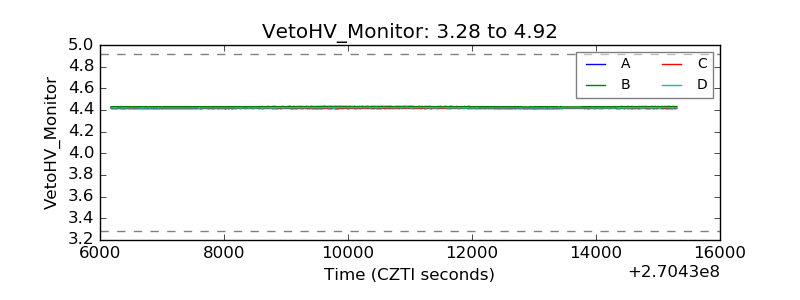 |
| Veto LLD | 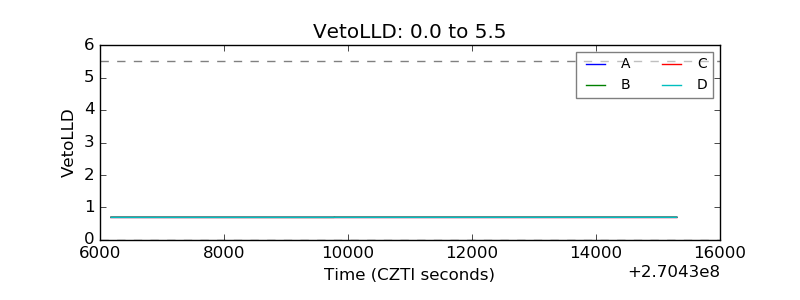 |
| Alpha Counter | 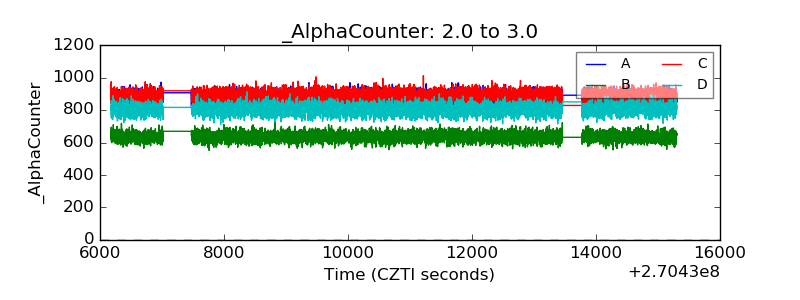 |
| _CPM_Rate | 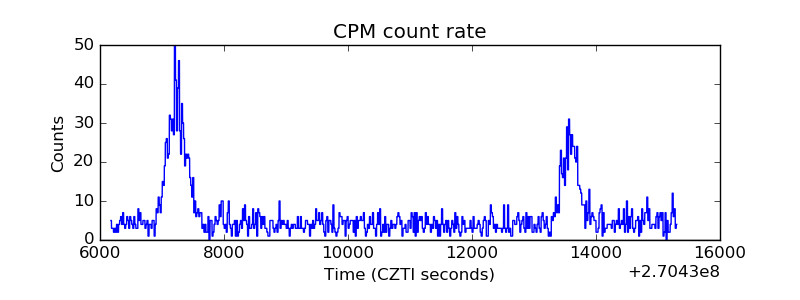 |
| CZT Counter |  |
| +2.5 Volts monitor |  |
| +5 Volts monitor |  |
| _ROLL_ROT | 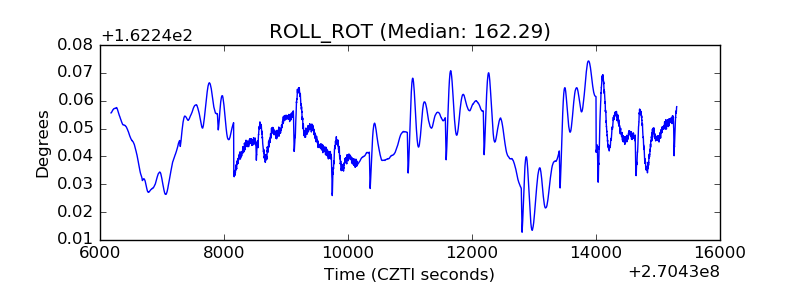 |
| _Roll_DEC | 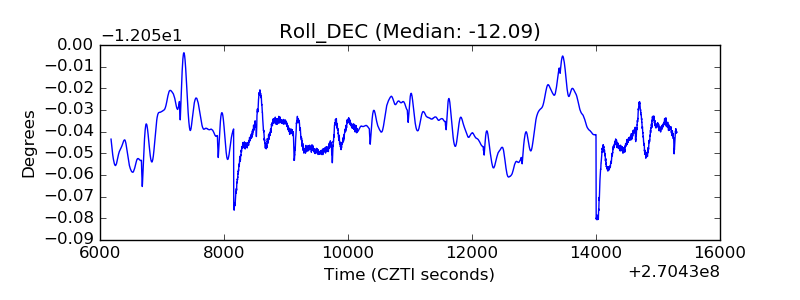 |
| _Roll_RA | 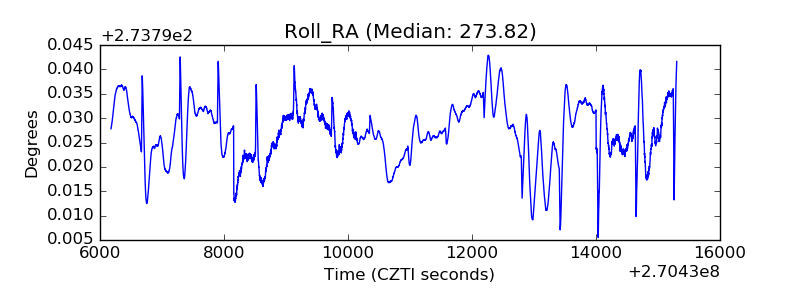 |
| Veto Counter | 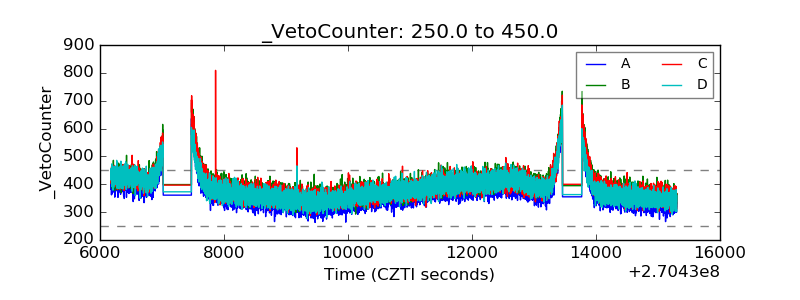 |