| Param | Original file | Final file |
|---|---|---|
| Filename | modeM0/AS1A04_223T01_9000002258_15305cztM0_level2.evt | modeM0/AS1A04_223T01_9000002258_15305cztM0_level2_quad_clean.evt |
| Size (bytes) | 314,256,960 | 51,618,240 |
| Size | 299.7 MB | 49.2 MB |
| Events in quadrant A | 2,157,854 | 313,141 |
| Events in quadrant B | 2,349,842 | 316,971 |
| Events in quadrant C | 2,528,090 | 306,665 |
| Events in quadrant D | 2,159,970 | 294,980 |
| Mode SS | |||
|---|---|---|---|
| Quadrant | BADHDUFLAG | Total packets | Discarded packets |
| A | 0 | 96 | 0 |
| B | 0 | 96 | 0 |
| C | 0 | 96 | 0 |
| D | 0 | 96 | 0 |
| Mode M9 | |||
|---|---|---|---|
| Quadrant | BADHDUFLAG | Total packets | Discarded packets |
| A | 0 | 3 | 0 |
| B | 0 | 3 | 0 |
| C | 0 | 3 | 0 |
| D | 0 | 3 | 0 |
| Mode M0 | |||
|---|---|---|---|
| Quadrant | BADHDUFLAG | Total packets | Discarded packets |
| A | 0 | 9682 | 1 |
| B | 0 | 10076 | 1 |
| C | 0 | 10392 | 1 |
| D | 0 | 9965 | 1 |
| Quadrant | Total seconds | Saturated seconds | Saturation percentage |
|---|---|---|---|
| A | 4713 | 50 | 1.060895% |
| B | 4713 | 95 | 2.015701% |
| C | 4713 | 88 | 1.867176% |
| D | 4713 | 58 | 1.230639% |
Noise dominated data is calculated using 1-second bins in cleaned event files. If a bin has >2000 counts, and if more than 50% of those come from <1% of pixels, then it is considered to be noise-dominated and hence unusable.
| Quadrant | # 1 sec bins | Bins with >0 counts | Bins with >2000 counts | High rate bins dominated by noise | Noise dominated (total time) | Noise dominated (detector-on time) | Marked lightcurve |
|---|---|---|---|---|---|---|---|
| A | 5024 | 4715 | 0 | 0 | 0.00% | 0.00% | 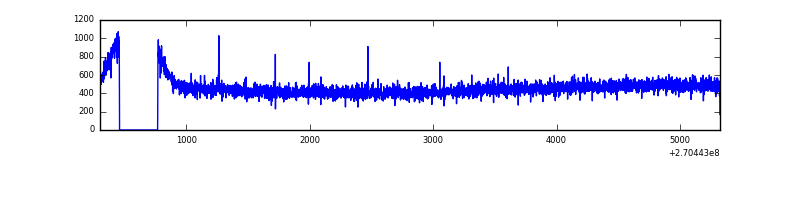 |
| B | 5024 | 4715 | 9 | 9 | 0.18% | 0.19% | 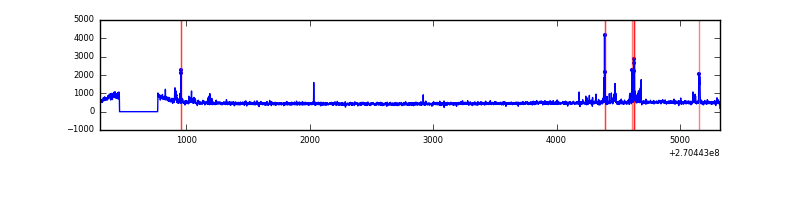 |
| C | 5024 | 4715 | 27 | 27 | 0.54% | 0.57% | 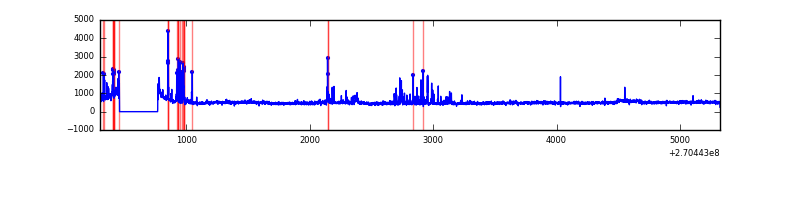 |
| D | 5024 | 4715 | 19 | 19 | 0.38% | 0.40% | 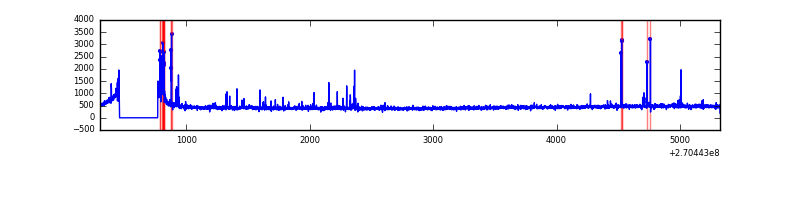 |
Top three noisy pixels from each quadrant. If the there are fewer than three noisy pixels in the level2.evt file, extra rows are filled as -1
| Pixel properties | Quadrant properties | ||||||
|---|---|---|---|---|---|---|---|
| Quadrant | DetID | PixID | Counts | Sigma | Mean | Median | Sigma |
| A | 0 | 226 | 4915 | 38.28 | 560 | 547 | 114.1 |
| A | 12 | 194 | 4227 | 32.25 | 560 | 547 | 114.1 |
| A | 3 | 137 | 3875 | 29.16 | 560 | 547 | 114.1 |
| B | 10 | 16 | 70824 | 635.87 | 561 | 545 | 110.5 |
| B | 0 | 189 | 29388 | 260.96 | 561 | 545 | 110.5 |
| B | 4 | 48 | 15557 | 135.82 | 561 | 545 | 110.5 |
| C | 3 | 233 | 222623 | 1750.43 | 538 | 540 | 126.9 |
| C | 4 | 254 | 203263 | 1597.84 | 538 | 540 | 126.9 |
| C | 10 | 22 | 4008 | 27.33 | 538 | 540 | 126.9 |
| D | 7 | 38 | 66928 | 503.73 | 536 | 521 | 131.8 |
| D | 2 | 234 | 17634 | 129.81 | 536 | 521 | 131.8 |
| D | 5 | 222 | 16616 | 122.09 | 536 | 521 | 131.8 |
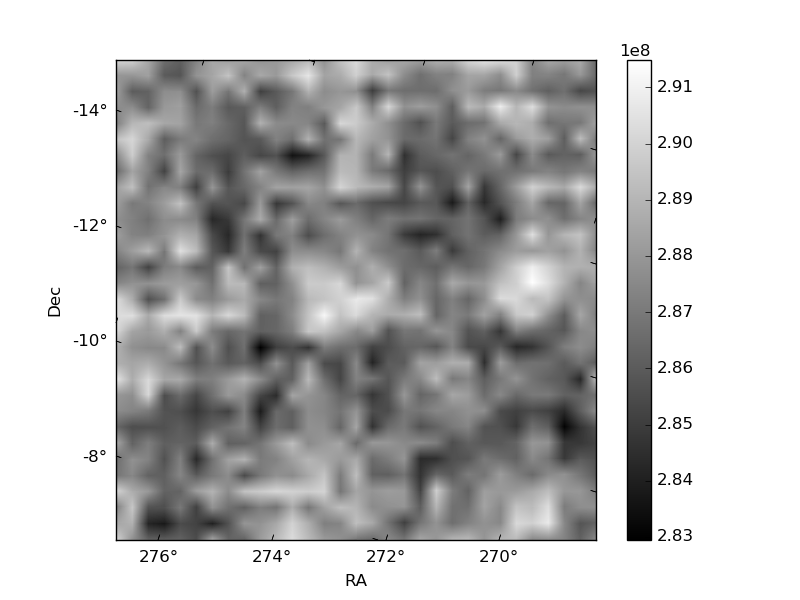
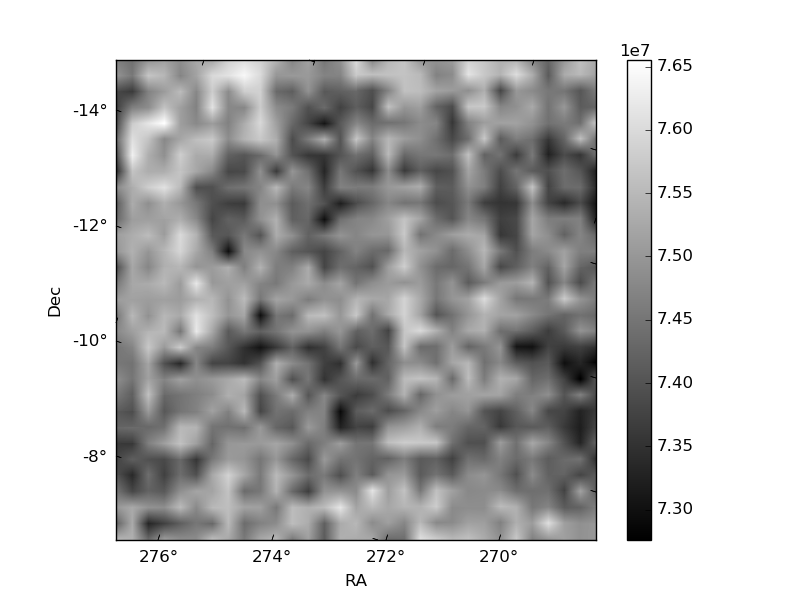
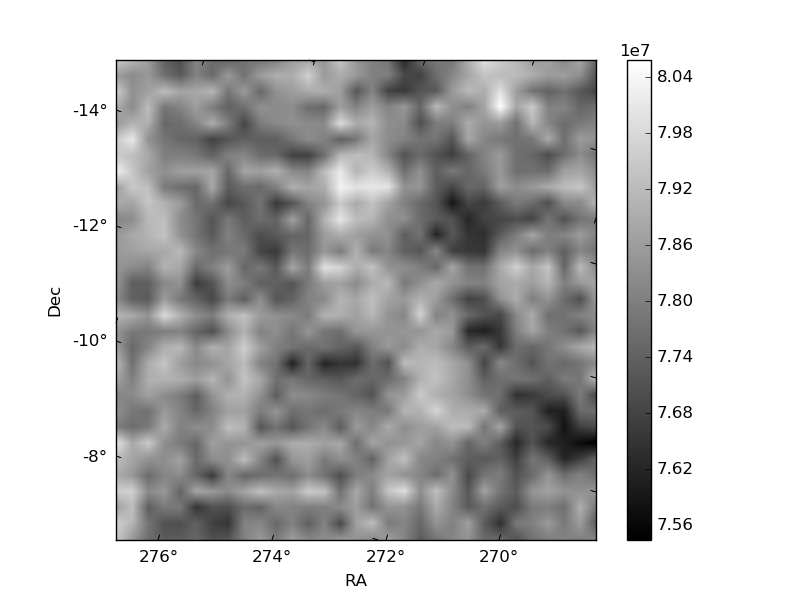
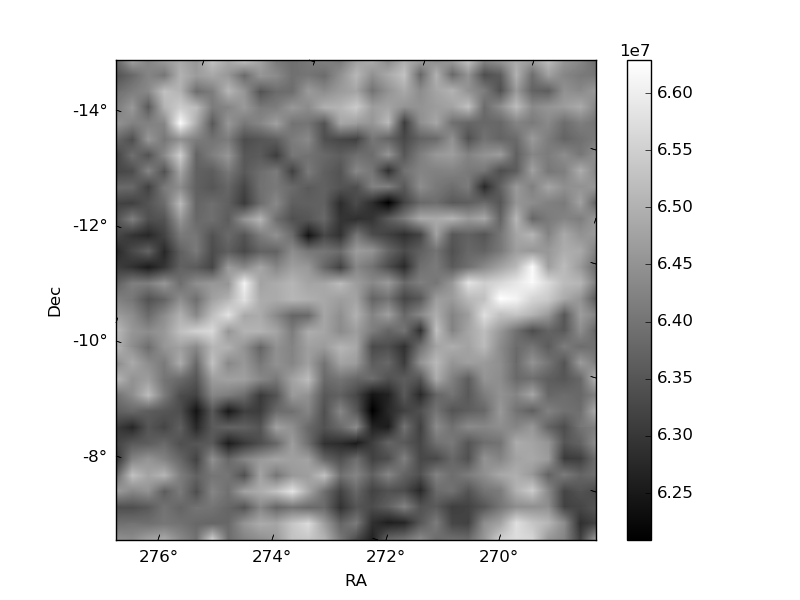
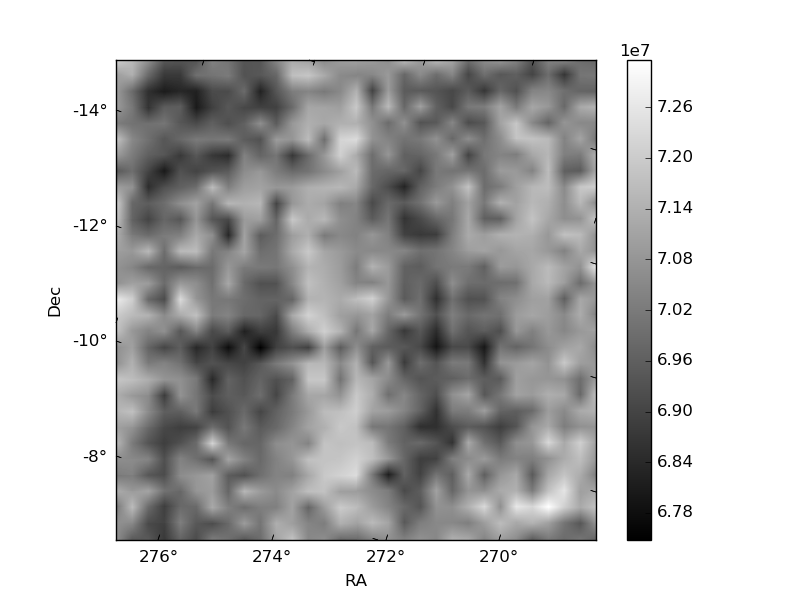
Histogram calculated using DETX and DETY for each event in the final _common_clean file
| Quadrant A | 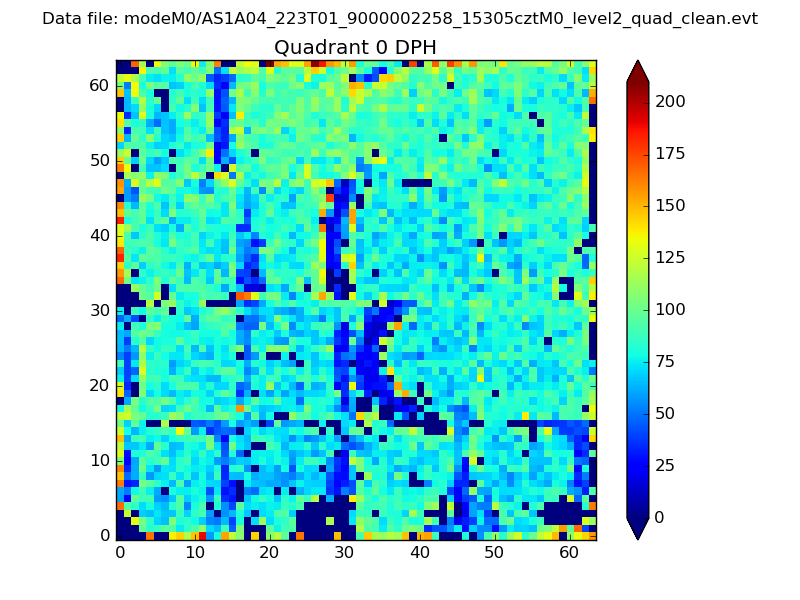 |
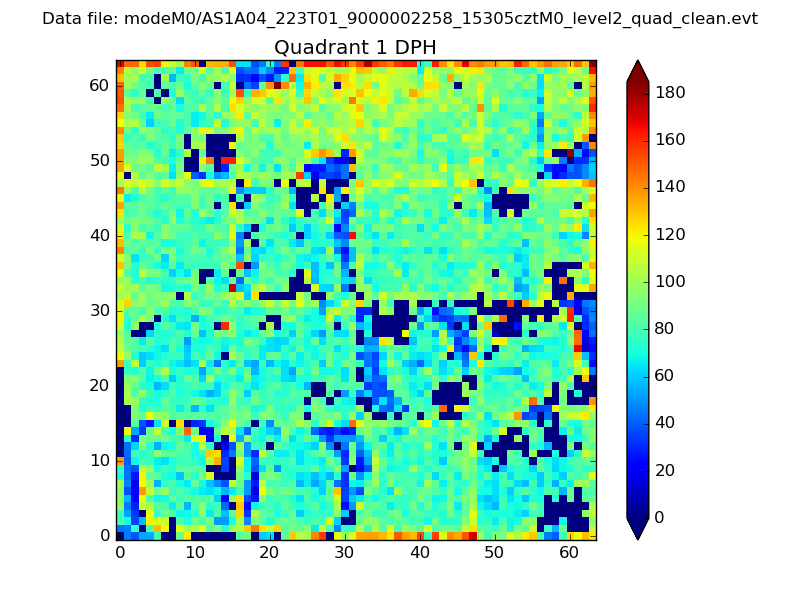 |
Quadrant B |
|---|---|---|---|
| Quadrant D | 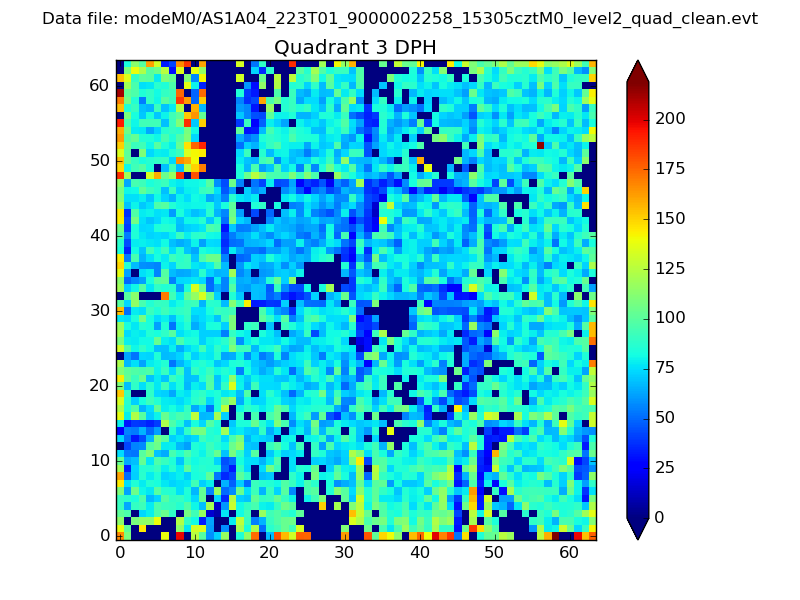 |
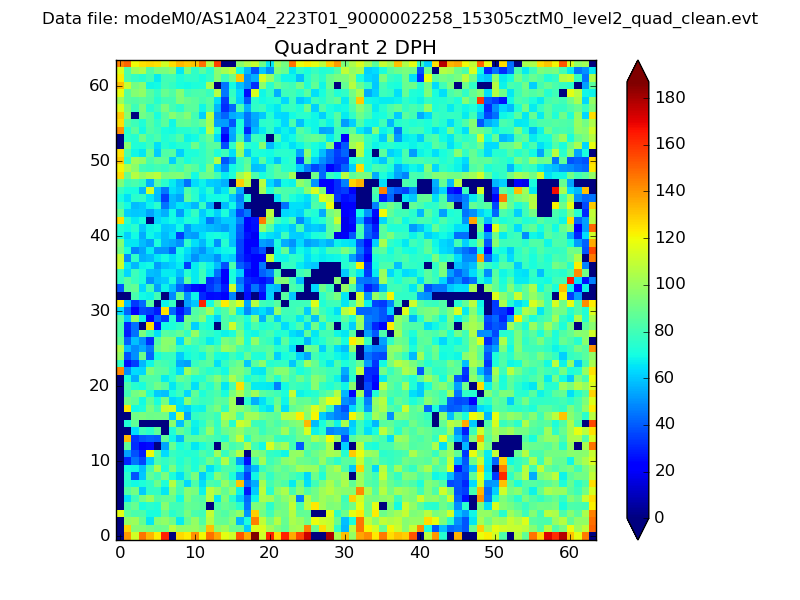 |
Quadrant C |
| Plot type | Count rate plots | Images |
|---|---|---|
| Comparison with Poisson distribution Blue bars denote a histogram of data divided into 1 sec bins. Red curve is a Poisson curve with rate = median count rate of data. |
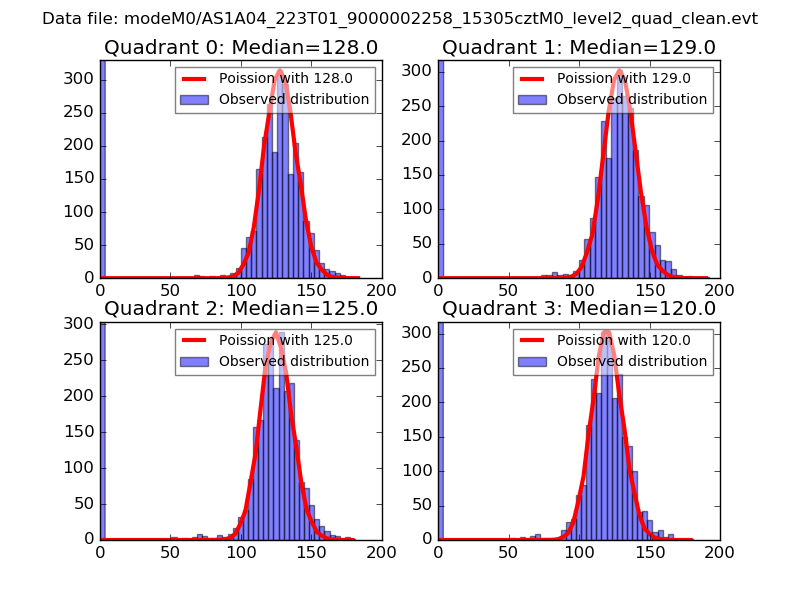 |
 |
| Quadrant-wise count rates Data is divided into 100 sec bins |
 |
|
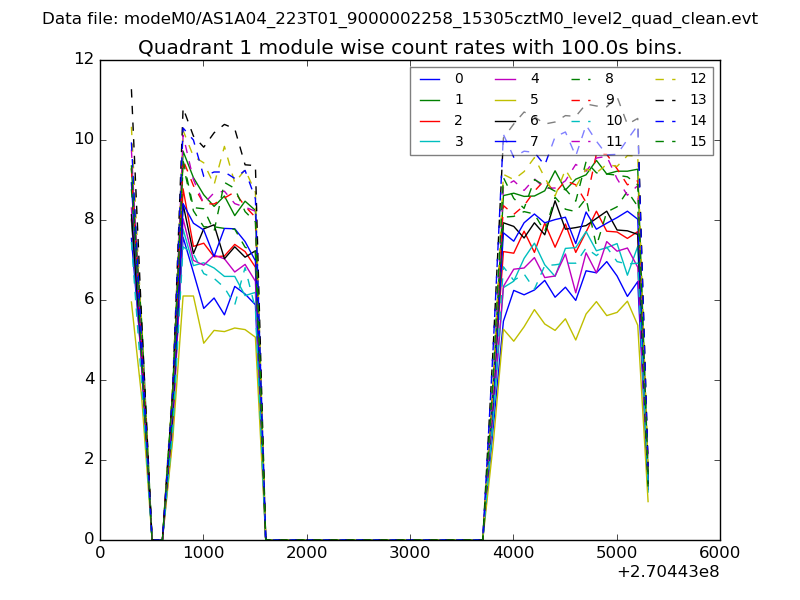
| Module-wise count rates for Quadrant A Data is divided into 100 sec bins |
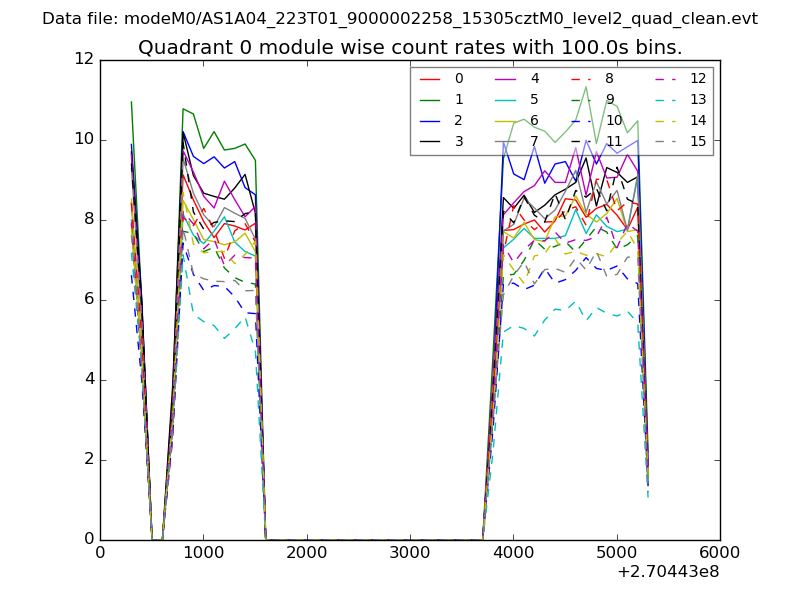 |
 |
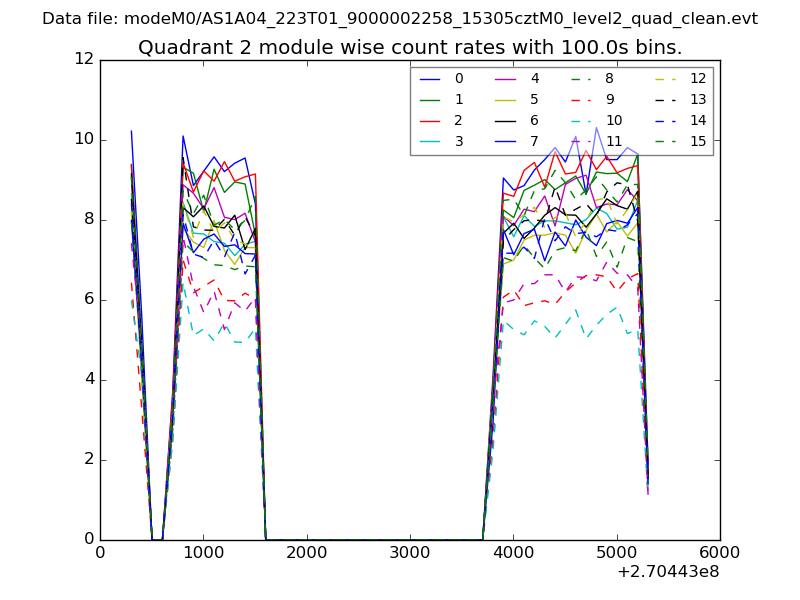
| Module-wise count rates for Quadrant B Data is divided into 100 sec bins |
 |
 |
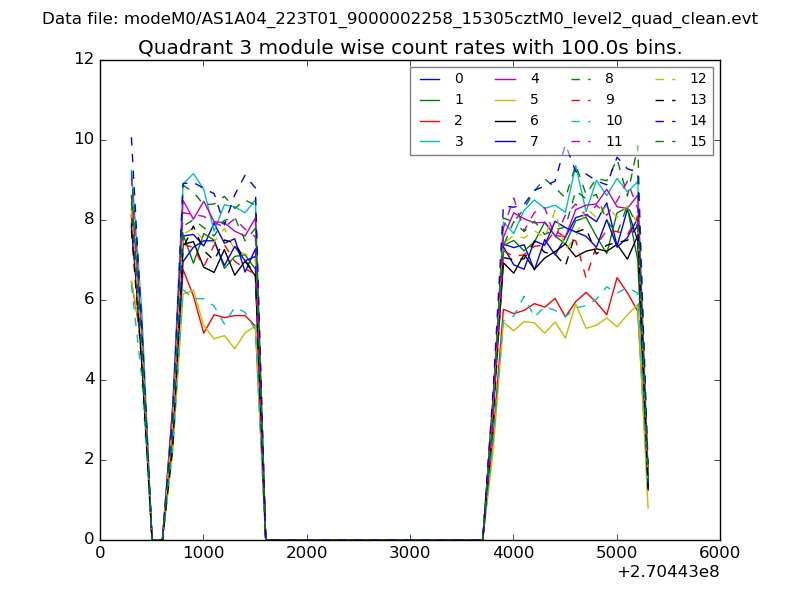
| Module-wise count rates for Quadrant C Data is divided into 100 sec bins |
 |
 |
| Module-wise count rates for Quadrant D Data is divided into 100 sec bins |
 |
 |
| Parameter | Plot |
|---|---|
| CZT HV Monitor | 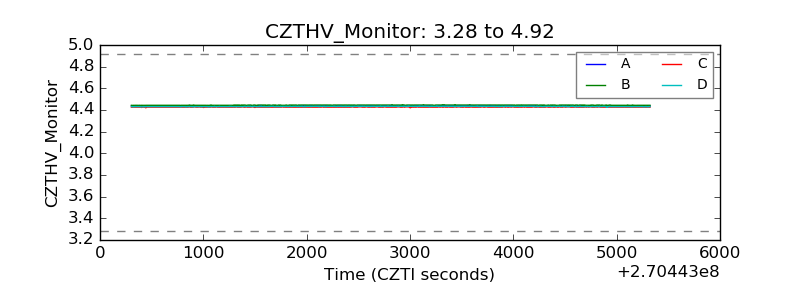 |
| D_VDD |  |
| Temperature 1 | 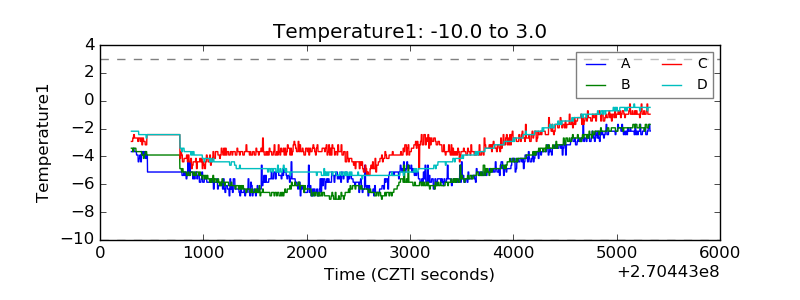 |
| Veto HV Monitor | 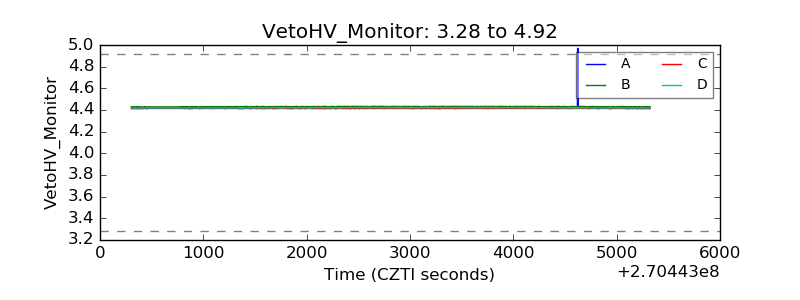 |
| Veto LLD | 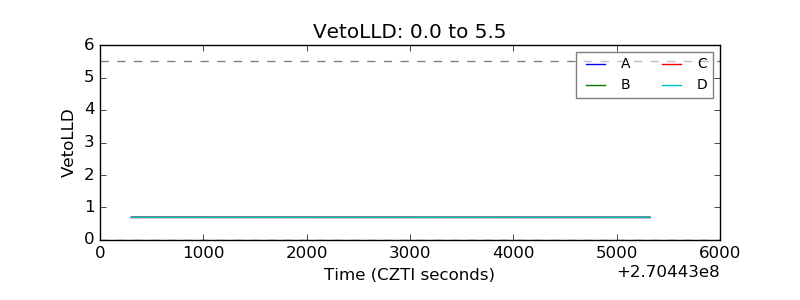 |
| Alpha Counter |  |
| _CPM_Rate | 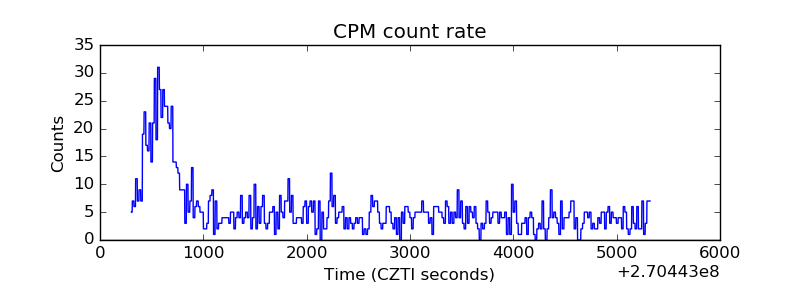 |
| CZT Counter | 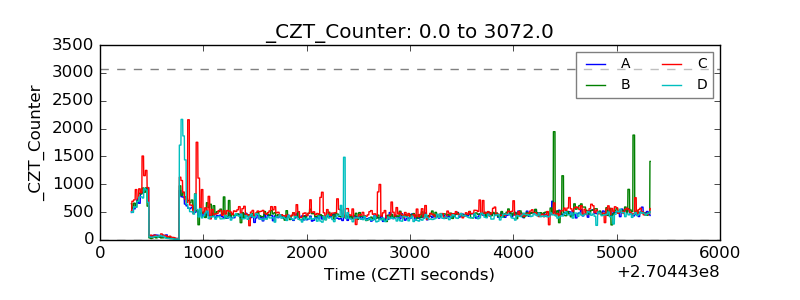 |
| +2.5 Volts monitor |  |
| +5 Volts monitor |  |
| _ROLL_ROT | 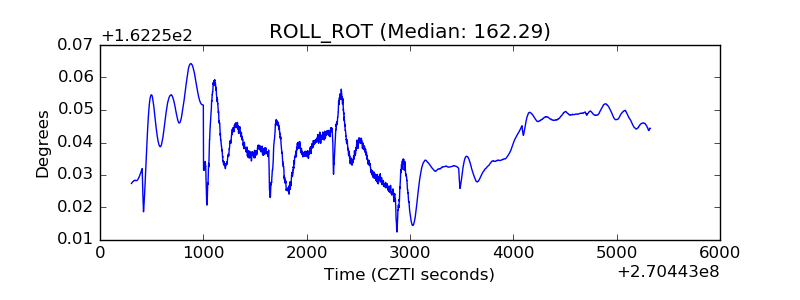 |
| _Roll_DEC | 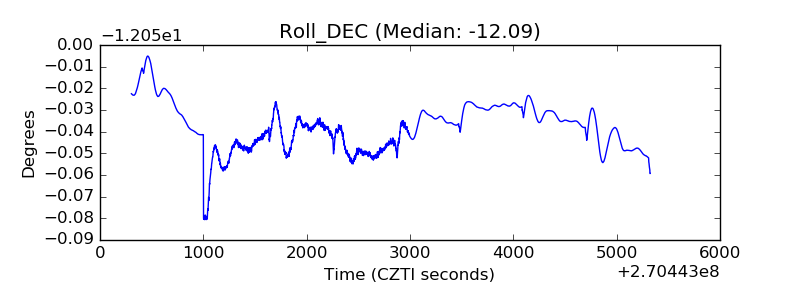 |
| _Roll_RA | 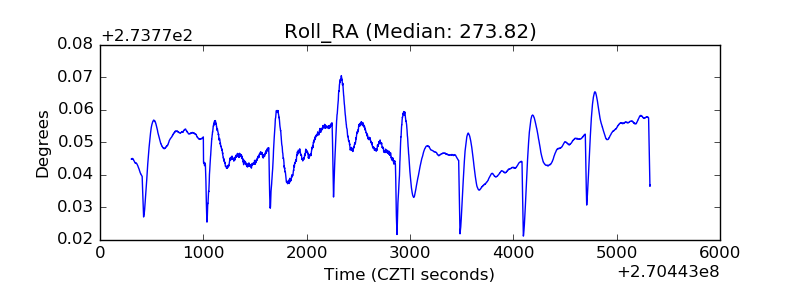 |
| Veto Counter | 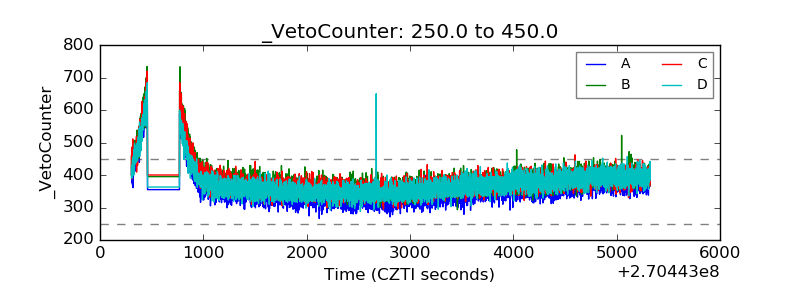 |