| Param | Original file | Final file |
|---|---|---|
| Filename | modeM0/AS1G08_037T01_9000002256cztM0_level2.fits | modeM0/AS1G08_037T01_9000002256cztM0_level2_quad_clean.evt |
| Size (bytes) | 297,734,400 | 265,921,920 |
| Size | 283.9 MB | 253.6 MB |
| Events in quadrant A | 1,848,686 | 1,568,636 |
| Events in quadrant B | 1,735,604 | 1,560,014 |
| Events in quadrant C | 1,791,410 | 1,488,848 |
| Events in quadrant D | 1,576,540 | 1,370,798 |
| Mode M9 | |||
|---|---|---|---|
| Quadrant | BADHDUFLAG | Total packets | Discarded packets |
| A | 0 | 61 | 0 |
| B | 0 | 61 | 0 |
| C | 0 | 61 | 0 |
| D | 0 | 61 | 0 |
| Mode SS | |||
|---|---|---|---|
| Quadrant | BADHDUFLAG | Total packets | Discarded packets |
| A | 0 | 614 | 0 |
| B | 0 | 614 | 0 |
| C | 0 | 614 | 0 |
| D | 0 | 614 | 0 |
| Mode M0 | |||
|---|---|---|---|
| Quadrant | BADHDUFLAG | Total packets | Discarded packets |
| A | 0 | 63885 | 0 |
| B | 0 | 73598 | 0 |
| C | 0 | 63955 | 0 |
| D | 0 | 63904 | 0 |
| Quadrant | Total seconds | Saturated seconds | Saturation percentage |
|---|---|---|---|
| A | 30033 | 435 | 1.448407% |
| B | 30033 | 1212 | 4.035561% |
| C | 30033 | 338 | 1.125429% |
| D | 30033 | 466 | 1.551627% |
Noise dominated data is calculated using 1-second bins in cleaned event files. If a bin has >2000 counts, and if more than 50% of those come from <1% of pixels, then it is considered to be noise-dominated and hence unusable.
| Quadrant | # 1 sec bins | Bins with >0 counts | Bins with >2000 counts | High rate bins dominated by noise | Noise dominated (total time) | Noise dominated (detector-on time) | Marked lightcurve |
|---|---|---|---|---|---|---|---|
| A | 36168 | 30027 | 0 | 0 | 0.00% | 0.00% |  |
| B | 36168 | 30003 | 0 | 0 | 0.00% | 0.00% |  |
| C | 36168 | 30027 | 0 | 0 | 0.00% | 0.00% |  |
| D | 36168 | 30025 | 0 | 0 | 0.00% | 0.00% |  |
Top three noisy pixels from each quadrant. If the there are fewer than three noisy pixels in the level2.evt file, extra rows are filled as -1
| Pixel properties | Quadrant properties | ||||||
|---|---|---|---|---|---|---|---|
| Quadrant | DetID | PixID | Counts | Sigma | Mean | Median | Sigma |
| A | 0 | 29 | 1705 | 10.48 | 481 | 452 | 119.6 |
| A | 7 | 110 | 1434 | 8.21 | 481 | 452 | 119.6 |
| A | 15 | 236 | 1358 | 7.58 | 481 | 452 | 119.6 |
| B | 2 | 9 | 1397 | 10.41 | 458 | 438 | 92.1 |
| B | 2 | 8 | 1175 | 8.0 | 458 | 438 | 92.1 |
| B | 5 | 128 | 1173 | 7.98 | 458 | 438 | 92.1 |
| C | 1 | 81 | 1359 | 7.44 | 473 | 441 | 123.4 |
| C | 1 | 80 | 1357 | 7.42 | 473 | 441 | 123.4 |
| C | 12 | 241 | 1232 | 6.41 | 473 | 441 | 123.4 |
| D | 3 | 14 | 1158 | 6.23 | 449 | 409 | 120.2 |
| D | 6 | 231 | 1151 | 6.17 | 449 | 409 | 120.2 |
| D | 6 | 38 | 1127 | 5.97 | 449 | 409 | 120.2 |
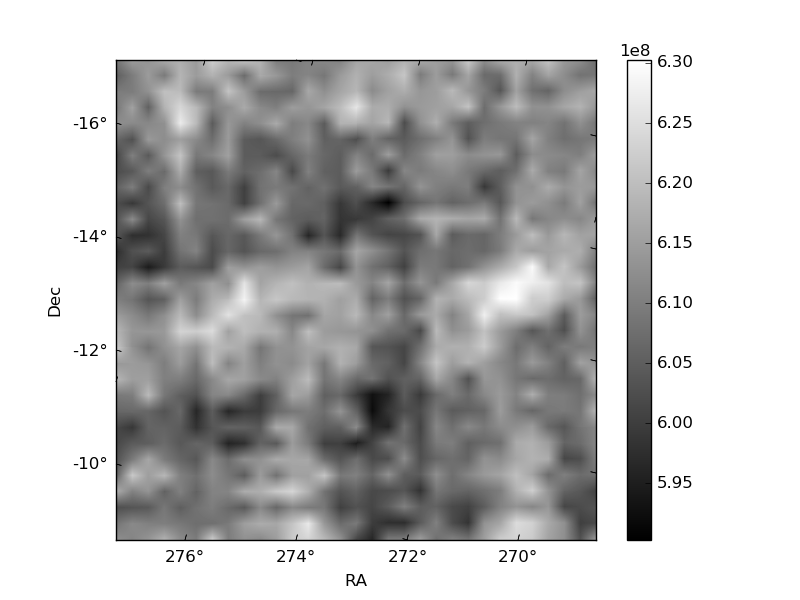
Histogram calculated using DETX and DETY for each event in the final _common_clean file
| Quadrant A | 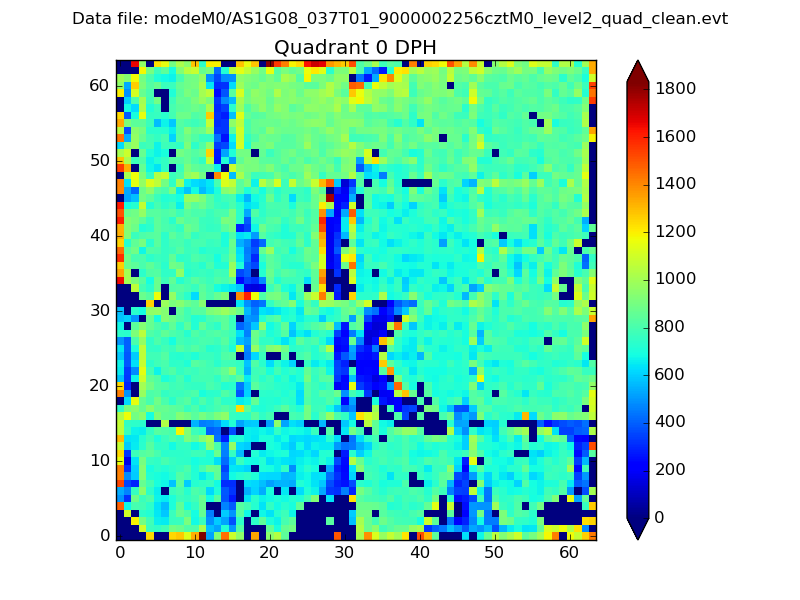 |
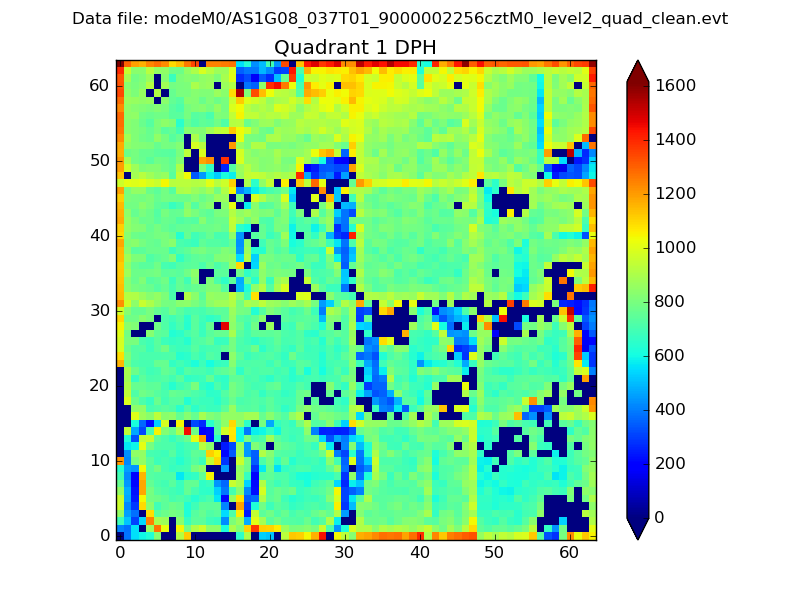 |
Quadrant B |
|---|---|---|---|
| Quadrant D | 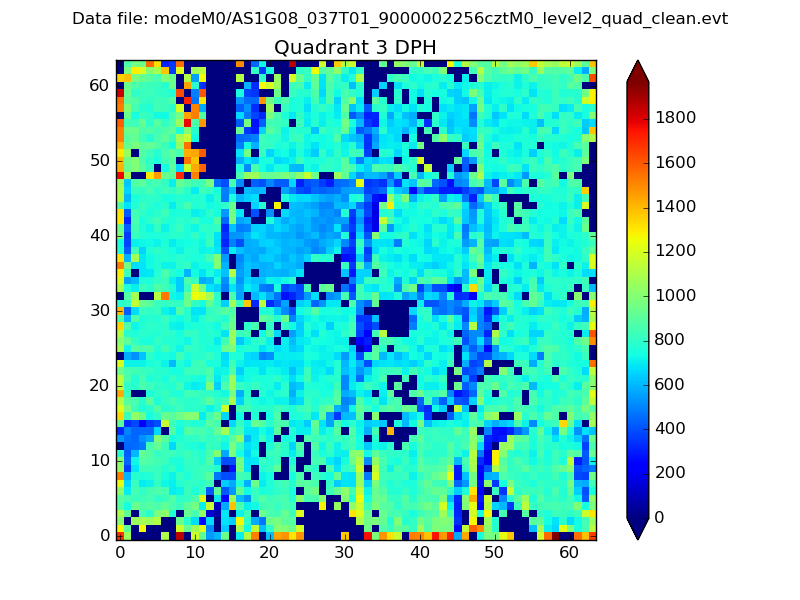 |
 |
Quadrant C |
| Plot type | Count rate plots | Images |
|---|---|---|
| Comparison with Poisson distribution Blue bars denote a histogram of data divided into 1 sec bins. Red curve is a Poisson curve with rate = median count rate of data. |
 |
 |
| Quadrant-wise count rates Data is divided into 100 sec bins |
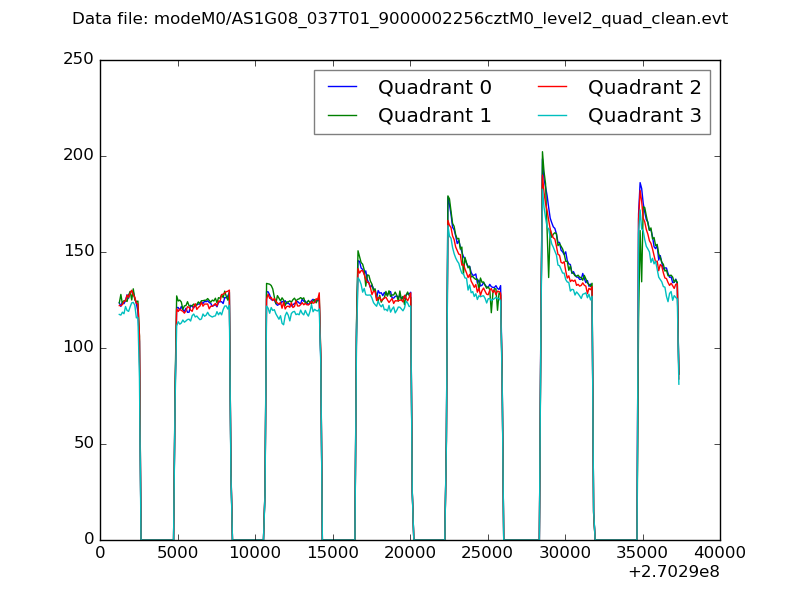 |
|
| Module-wise count rates for Quadrant A Data is divided into 100 sec bins |
 |
 |
| Module-wise count rates for Quadrant B Data is divided into 100 sec bins |
 |
 |
| Module-wise count rates for Quadrant C Data is divided into 100 sec bins |
 |
 |
| Module-wise count rates for Quadrant D Data is divided into 100 sec bins |
 |
 |
| Parameter | Plot |
|---|---|
| CZT HV Monitor |  |
| D_VDD |  |
| Temperature 1 |  |
| Veto HV Monitor |  |
| Veto LLD |  |
| Alpha Counter |  |
| _CPM_Rate |  |
| CZT Counter |  |
| +2.5 Volts monitor |  |
| +5 Volts monitor |  |
| _ROLL_ROT |  |
| _Roll_DEC |  |
| _Roll_RA |  |
| Veto Counter | 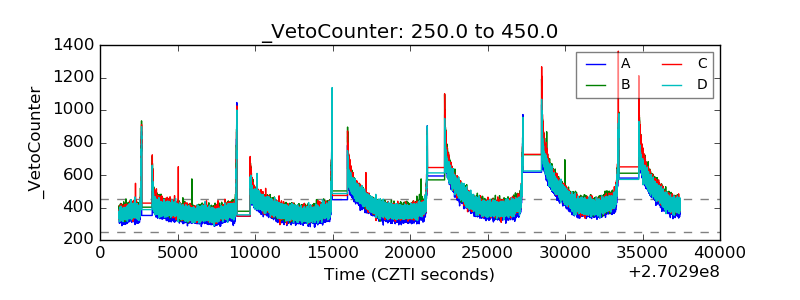 |