| Param | Original file | Final file |
|---|---|---|
| Filename | modeM0/AS1G08_037T01_9000002256_15278cztM0_level2.evt | modeM0/AS1G08_037T01_9000002256_15278cztM0_level2_quad_clean.evt |
| Size (bytes) | 213,926,400 | 30,078,720 |
| Size | 204.0 MB | 28.7 MB |
| Events in quadrant A | 1,467,316 | 176,224 |
| Events in quadrant B | 1,701,758 | 177,465 |
| Events in quadrant C | 1,596,534 | 176,414 |
| Events in quadrant D | 1,508,782 | 167,813 |
| Mode M9 | |||
|---|---|---|---|
| Quadrant | BADHDUFLAG | Total packets | Discarded packets |
| A | 0 | 7 | 0 |
| B | 0 | 7 | 0 |
| C | 0 | 7 | 0 |
| D | 0 | 7 | 0 |
| Mode SS | |||
|---|---|---|---|
| Quadrant | BADHDUFLAG | Total packets | Discarded packets |
| A | 0 | 62 | 0 |
| B | 0 | 62 | 0 |
| C | 0 | 62 | 0 |
| D | 0 | 62 | 0 |
| Mode M0 | |||
|---|---|---|---|
| Quadrant | BADHDUFLAG | Total packets | Discarded packets |
| A | 0 | 6193 | 2 |
| B | 0 | 6817 | 1 |
| C | 0 | 6367 | 1 |
| D | 0 | 6525 | 1 |
| Quadrant | Total seconds | Saturated seconds | Saturation percentage |
|---|---|---|---|
| A | 2976 | 51 | 1.713710% |
| B | 2976 | 83 | 2.788978% |
| C | 2976 | 43 | 1.444892% |
| D | 2976 | 103 | 3.461022% |
Noise dominated data is calculated using 1-second bins in cleaned event files. If a bin has >2000 counts, and if more than 50% of those come from <1% of pixels, then it is considered to be noise-dominated and hence unusable.
| Quadrant | # 1 sec bins | Bins with >0 counts | Bins with >2000 counts | High rate bins dominated by noise | Noise dominated (total time) | Noise dominated (detector-on time) | Marked lightcurve |
|---|---|---|---|---|---|---|---|
| A | 3662 | 2977 | 0 | 0 | 0.00% | 0.00% | 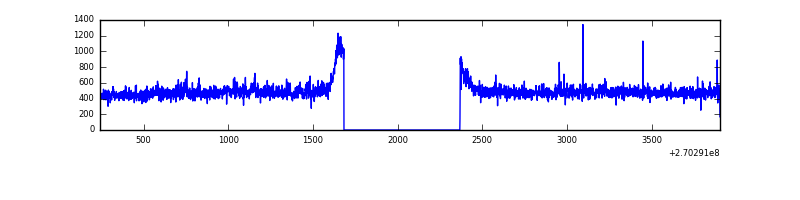 |
| B | 3662 | 2977 | 26 | 26 | 0.71% | 0.87% | 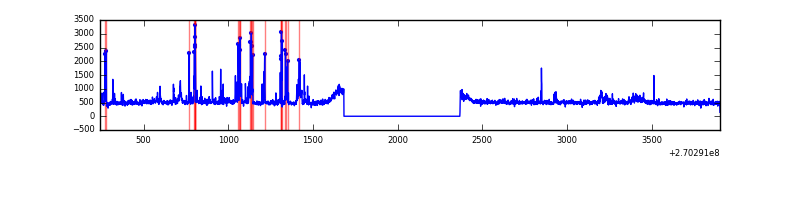 |
| C | 3662 | 2977 | 0 | 0 | 0.00% | 0.00% | 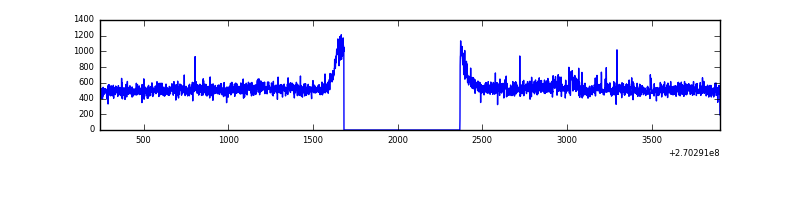 |
| D | 3662 | 2977 | 21 | 21 | 0.57% | 0.71% | 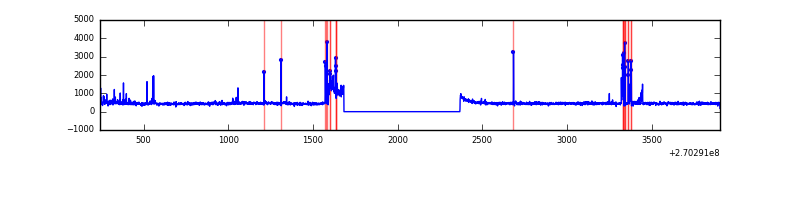 |
Top three noisy pixels from each quadrant. If the there are fewer than three noisy pixels in the level2.evt file, extra rows are filled as -1
| Pixel properties | Quadrant properties | ||||||
|---|---|---|---|---|---|---|---|
| Quadrant | DetID | PixID | Counts | Sigma | Mean | Median | Sigma |
| A | 12 | 189 | 38097 | 488.93 | 369 | 361 | 77.2 |
| A | 9 | 143 | 10416 | 130.28 | 369 | 361 | 77.2 |
| A | 0 | 226 | 3159 | 36.25 | 369 | 361 | 77.2 |
| B | 10 | 16 | 179818 | 2425.02 | 371 | 361 | 74.0 |
| B | 0 | 189 | 21244 | 282.19 | 371 | 361 | 74.0 |
| B | 0 | 229 | 18082 | 239.47 | 371 | 361 | 74.0 |
| C | 3 | 233 | 180953 | 2113.29 | 361 | 362 | 85.5 |
| C | 7 | 247 | 6381 | 70.43 | 361 | 362 | 85.5 |
| C | 13 | 61 | 2584 | 26.0 | 361 | 362 | 85.5 |
| D | 10 | 70 | 120575 | 1357.62 | 353 | 341 | 88.6 |
| D | 7 | 38 | 31342 | 350.05 | 353 | 341 | 88.6 |
| D | 2 | 234 | 11427 | 125.18 | 353 | 341 | 88.6 |
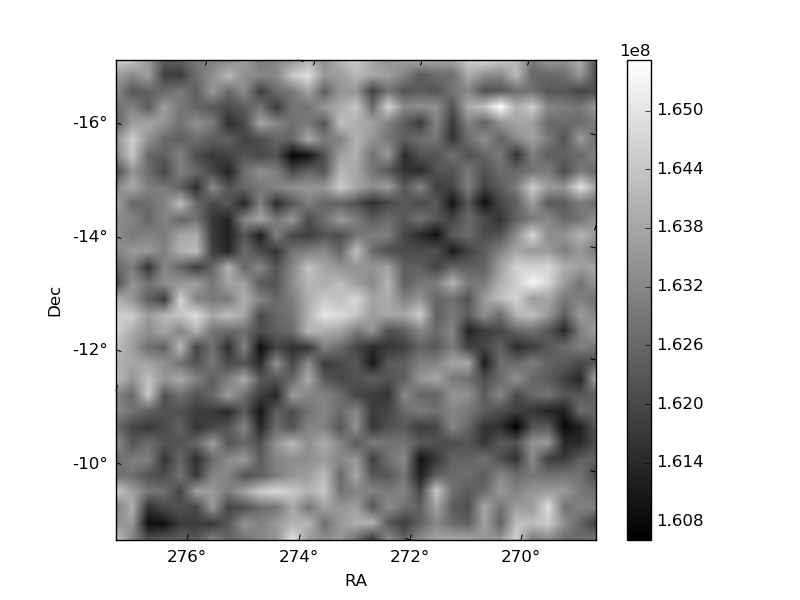
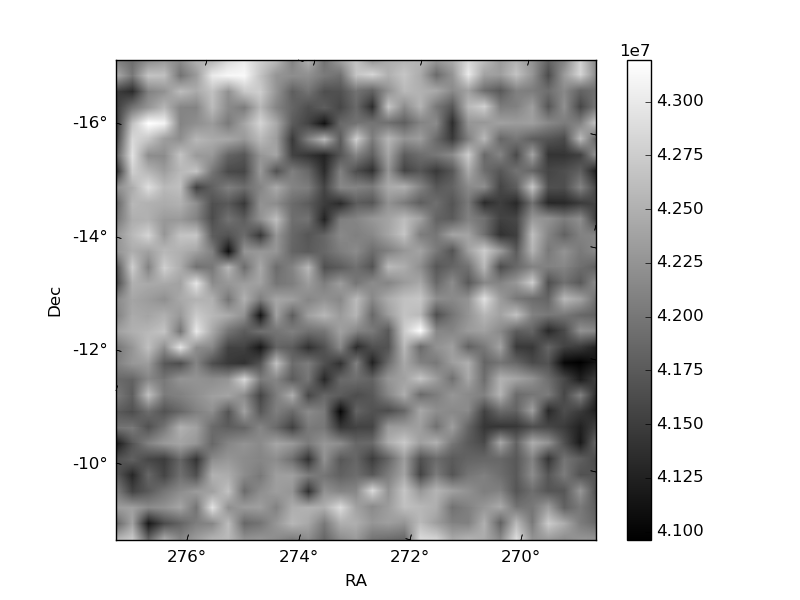
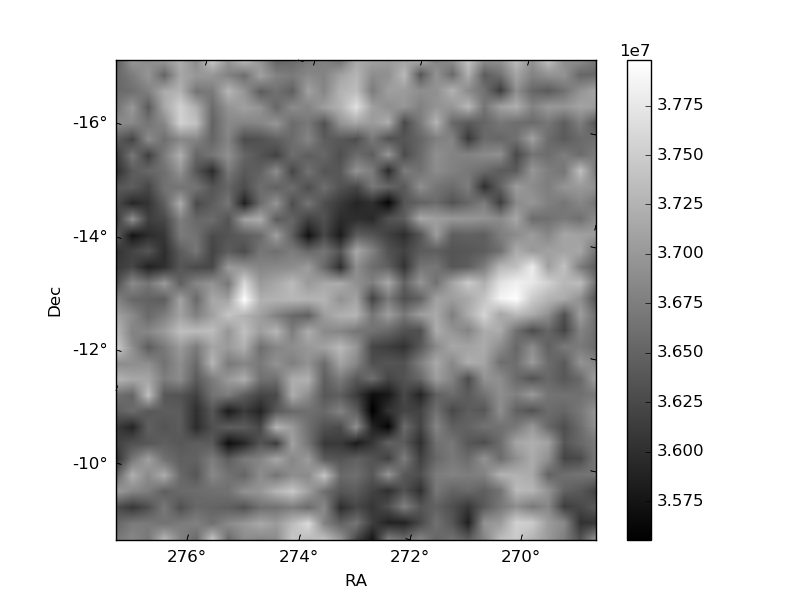
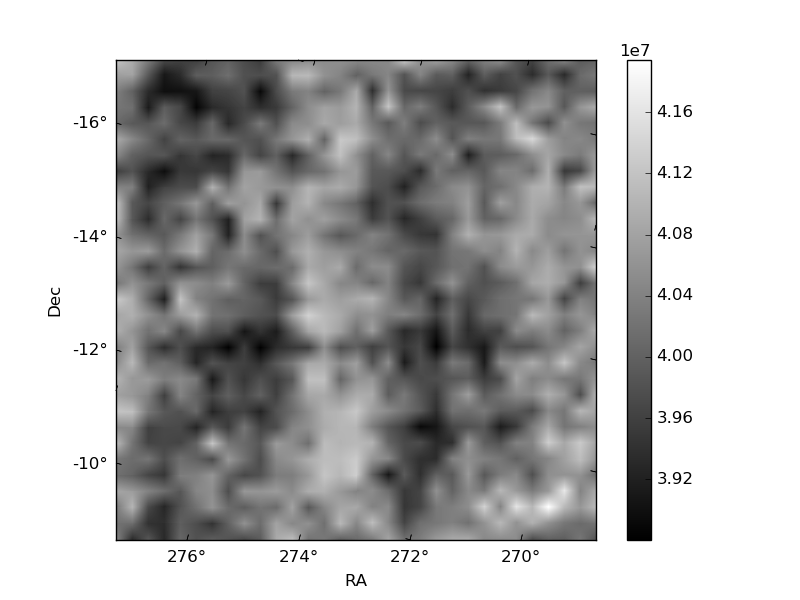
Histogram calculated using DETX and DETY for each event in the final _common_clean file
| Quadrant A | 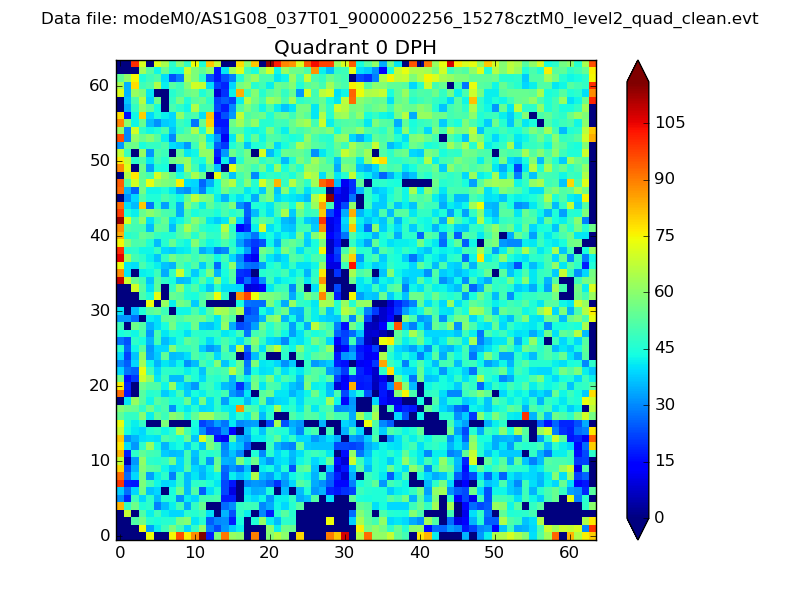 |
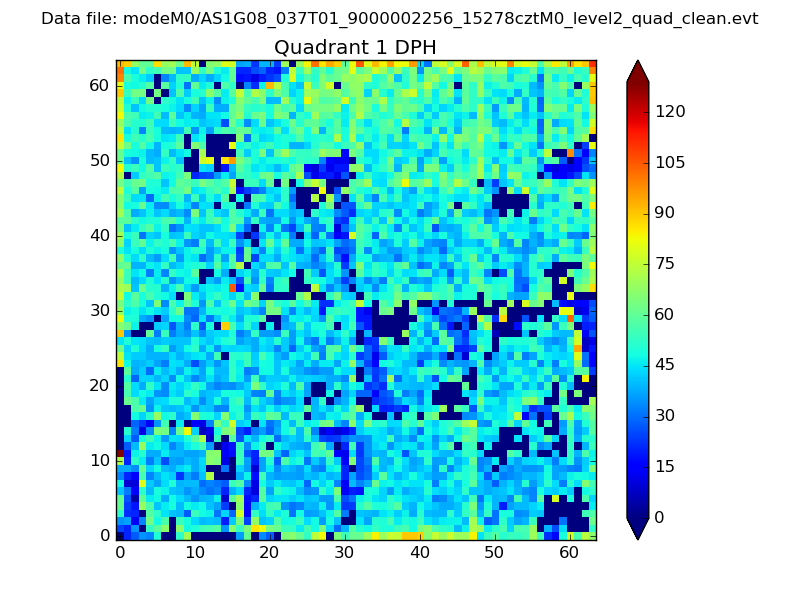 |
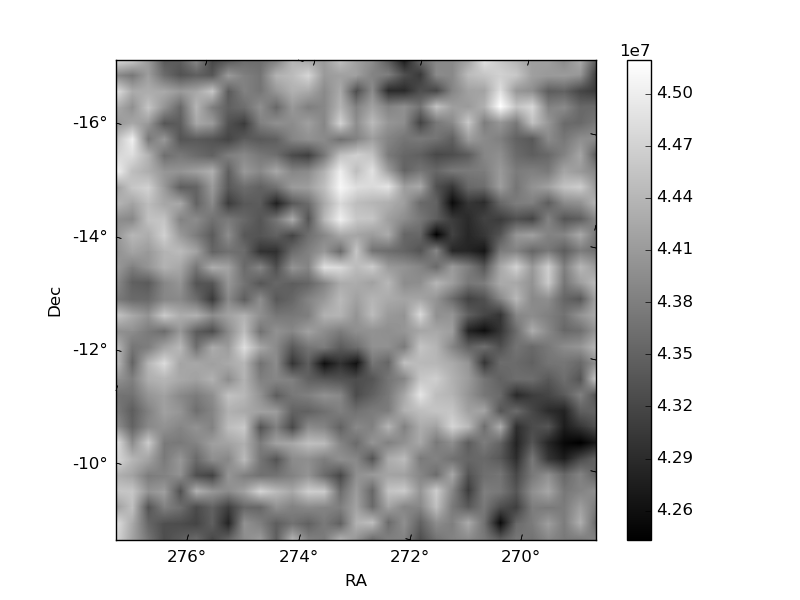
Quadrant B |
|---|---|---|---|
| Quadrant D | 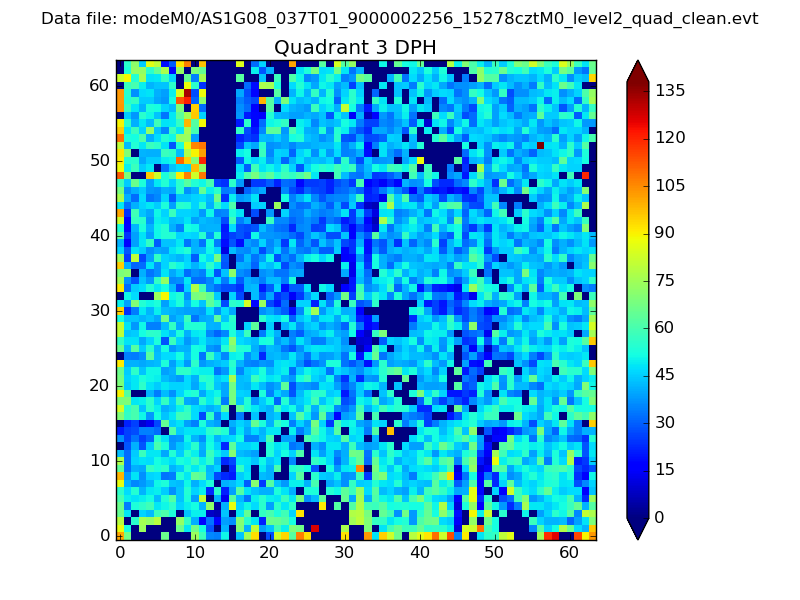 |
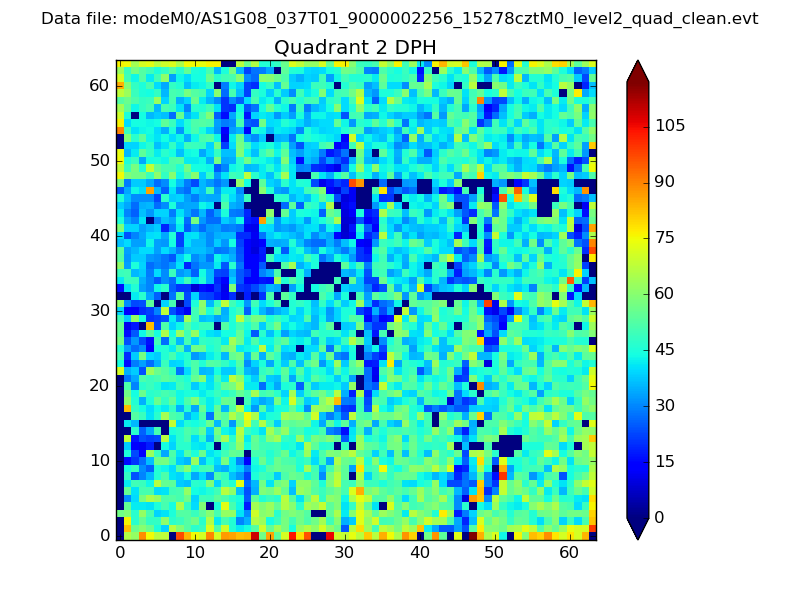 |
Quadrant C |
| Plot type | Count rate plots | Images |
|---|---|---|
| Comparison with Poisson distribution Blue bars denote a histogram of data divided into 1 sec bins. Red curve is a Poisson curve with rate = median count rate of data. |
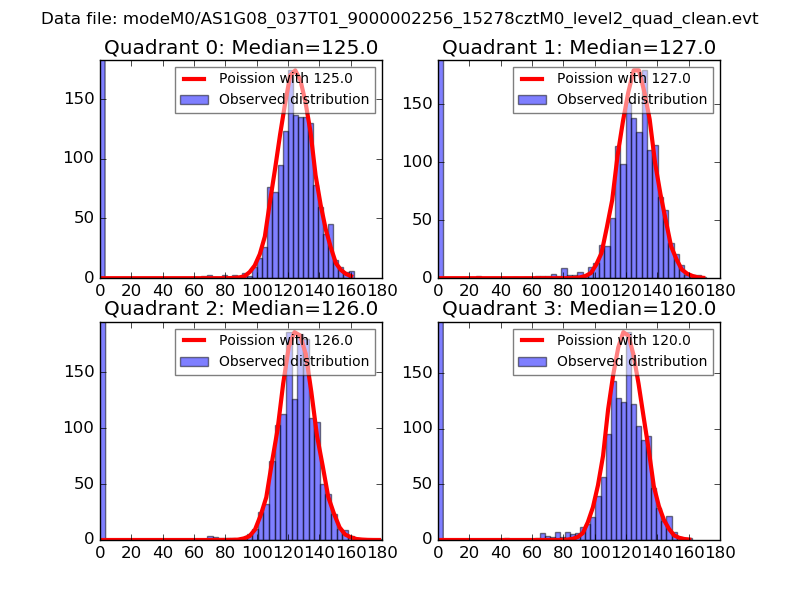 |
 |
| Quadrant-wise count rates Data is divided into 100 sec bins |
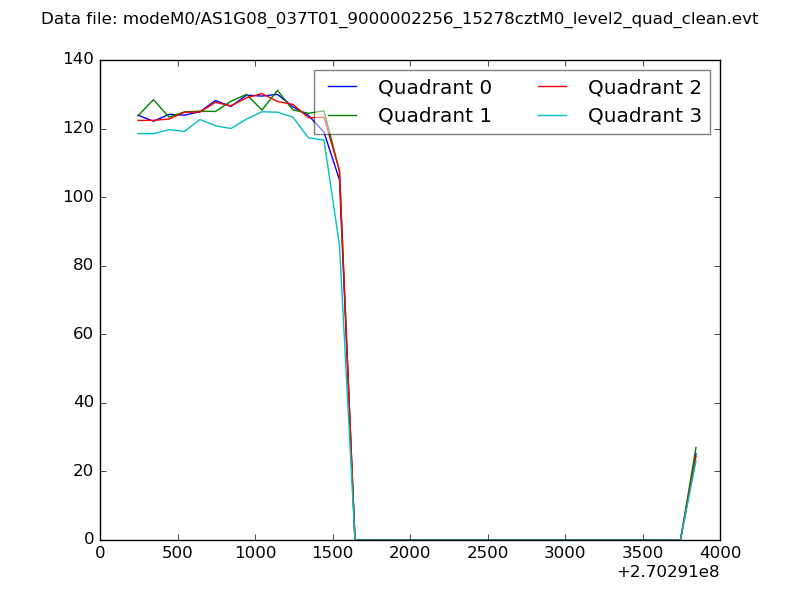 |
|
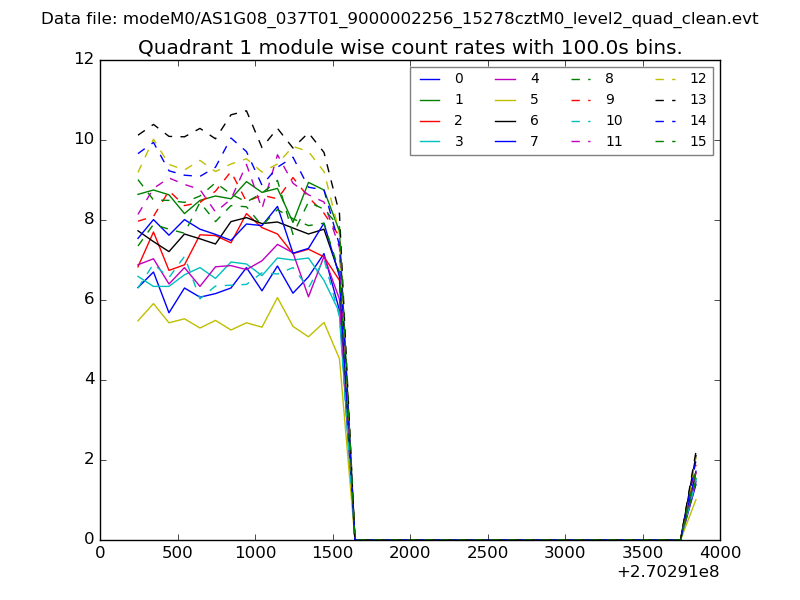
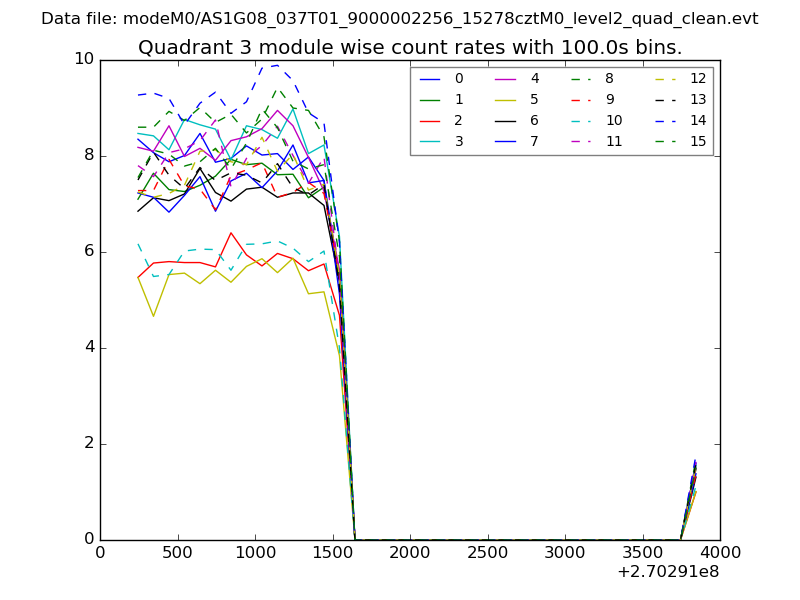
| Module-wise count rates for Quadrant A Data is divided into 100 sec bins |
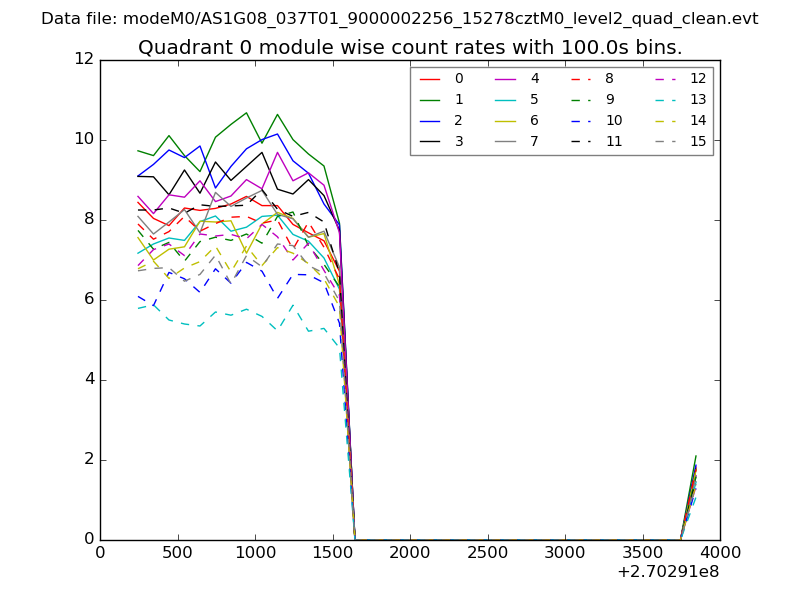 |
 |
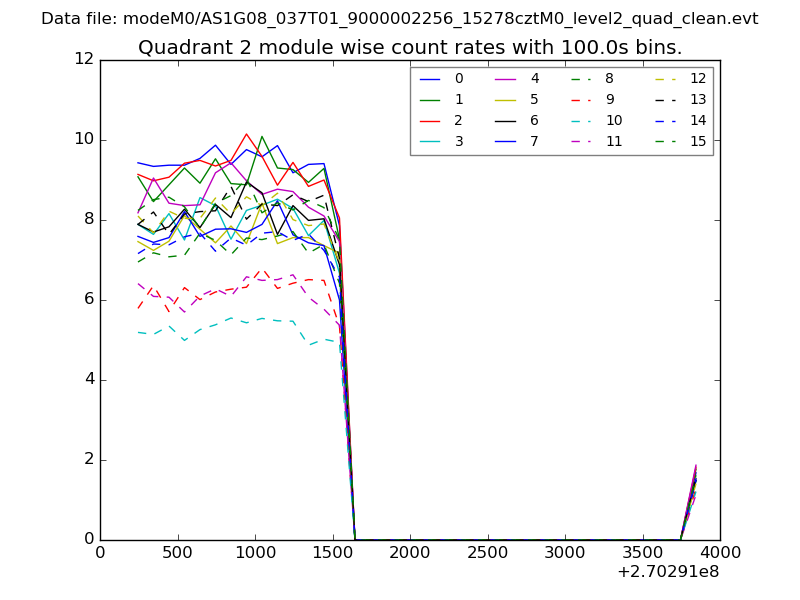
| Module-wise count rates for Quadrant B Data is divided into 100 sec bins |
 |
 |
| Module-wise count rates for Quadrant C Data is divided into 100 sec bins |
 |
 |
| Module-wise count rates for Quadrant D Data is divided into 100 sec bins |
 |
 |
| Parameter | Plot |
|---|---|
| CZT HV Monitor | 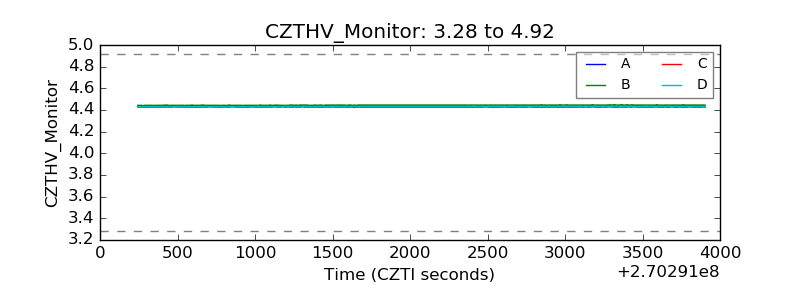 |
| D_VDD | 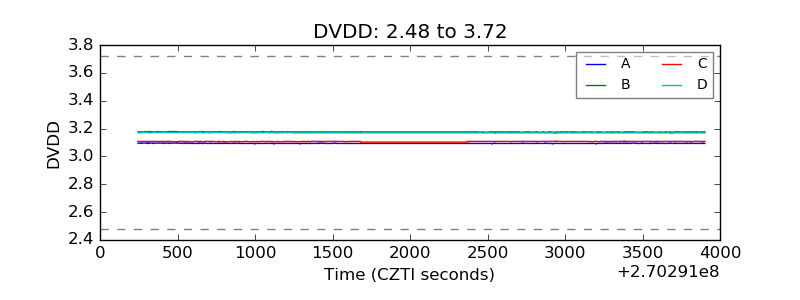 |
| Temperature 1 | 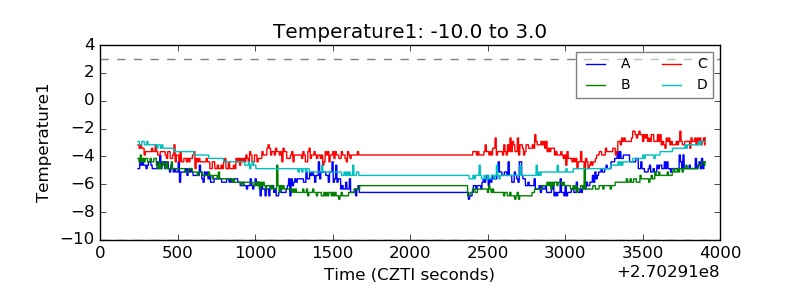 |
| Veto HV Monitor | 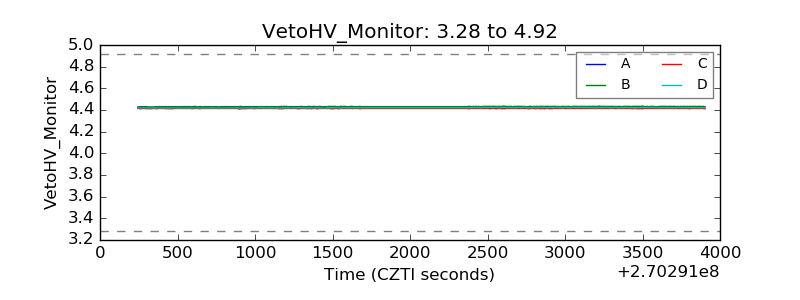 |
| Veto LLD | 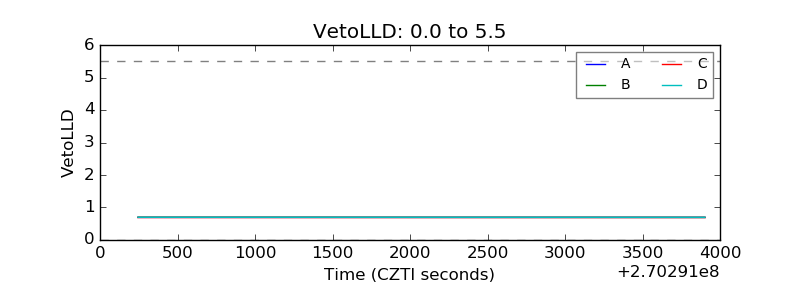 |
| Alpha Counter | 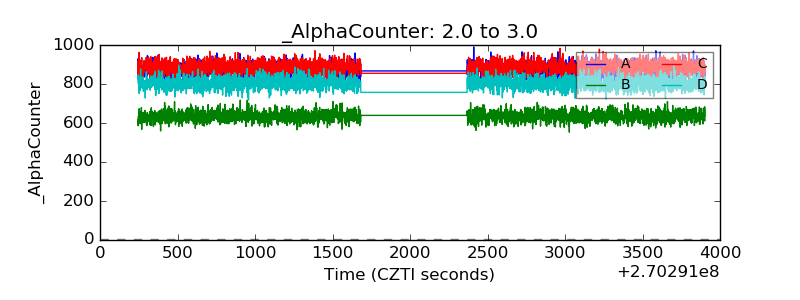 |
| _CPM_Rate | 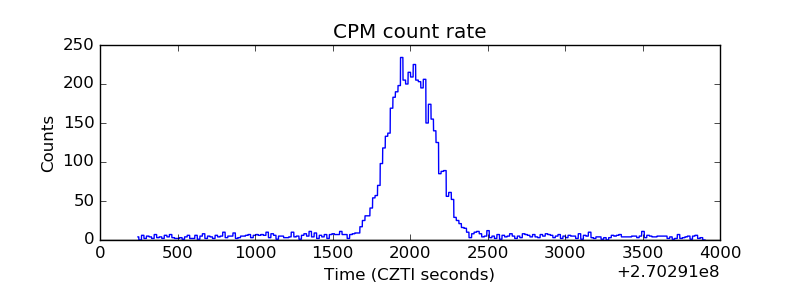 |
| CZT Counter | 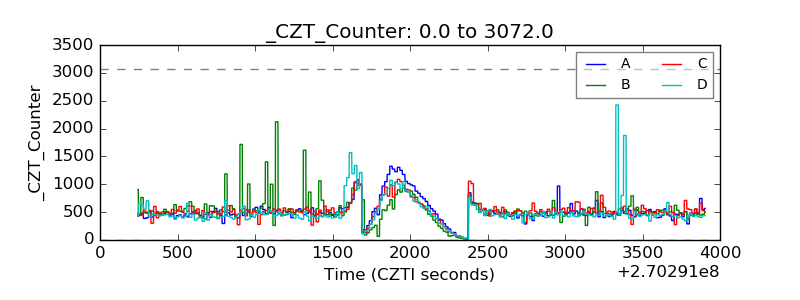 |
| +2.5 Volts monitor |  |
| +5 Volts monitor |  |
| _ROLL_ROT | 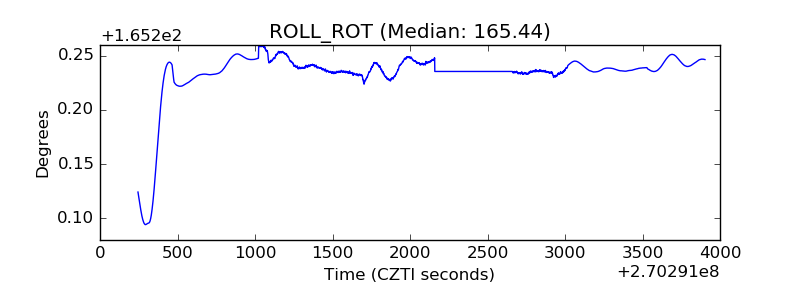 |
| _Roll_DEC |  |
| _Roll_RA | 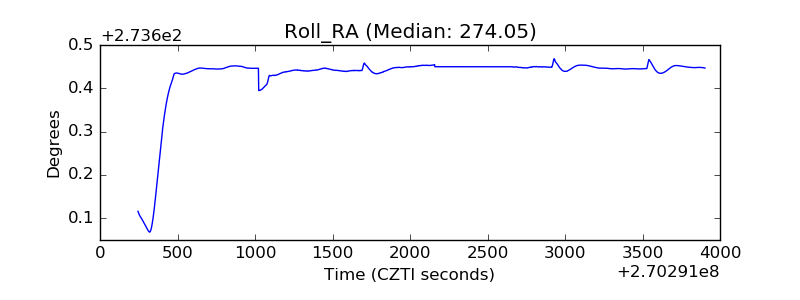 |
| Veto Counter | 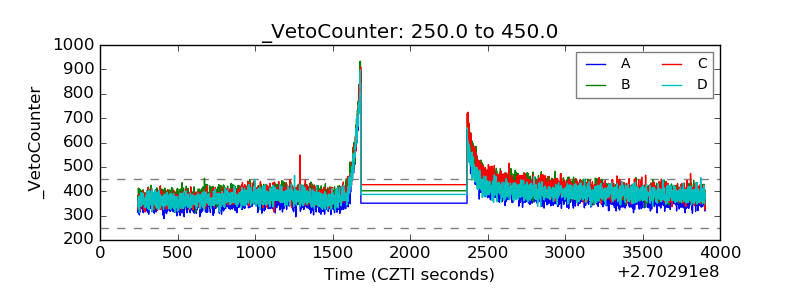 |