| Param | Original file | Final file |
|---|---|---|
| Filename | modeM0/AS1G08_037T01_9000002256_15281cztM0_level2.evt | modeM0/AS1G08_037T01_9000002256_15281cztM0_level2_quad_clean.evt |
| Size (bytes) | 439,902,720 | 102,038,400 |
| Size | 419.5 MB | 97.3 MB |
| Events in quadrant A | 3,143,402 | 680,372 |
| Events in quadrant B | 3,593,278 | 679,925 |
| Events in quadrant C | 3,141,945 | 663,802 |
| Events in quadrant D | 3,030,598 | 641,615 |
| Mode M9 | |||
|---|---|---|---|
| Quadrant | BADHDUFLAG | Total packets | Discarded packets |
| A | 0 | 11 | 0 |
| B | 0 | 11 | 0 |
| C | 0 | 11 | 0 |
| D | 0 | 11 | 0 |
| Mode SS | |||
|---|---|---|---|
| Quadrant | BADHDUFLAG | Total packets | Discarded packets |
| A | 0 | 124 | 0 |
| B | 0 | 124 | 0 |
| C | 0 | 124 | 0 |
| D | 0 | 124 | 0 |
| Mode M0 | |||
|---|---|---|---|
| Quadrant | BADHDUFLAG | Total packets | Discarded packets |
| A | 0 | 13238 | 2 |
| B | 0 | 14617 | 1 |
| C | 0 | 13019 | 1 |
| D | 0 | 13025 | 1 |
| Quadrant | Total seconds | Saturated seconds | Saturation percentage |
|---|---|---|---|
| A | 6080 | 71 | 1.167763% |
| B | 6080 | 132 | 2.171053% |
| C | 6080 | 54 | 0.888158% |
| D | 6080 | 70 | 1.151316% |
Noise dominated data is calculated using 1-second bins in cleaned event files. If a bin has >2000 counts, and if more than 50% of those come from <1% of pixels, then it is considered to be noise-dominated and hence unusable.
| Quadrant | # 1 sec bins | Bins with >0 counts | Bins with >2000 counts | High rate bins dominated by noise | Noise dominated (total time) | Noise dominated (detector-on time) | Marked lightcurve |
|---|---|---|---|---|---|---|---|
| A | 7196 | 6081 | 0 | 0 | 0.00% | 0.00% | 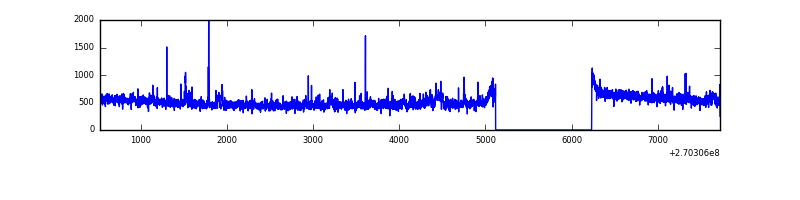 |
| B | 7196 | 6081 | 45 | 45 | 0.63% | 0.74% | 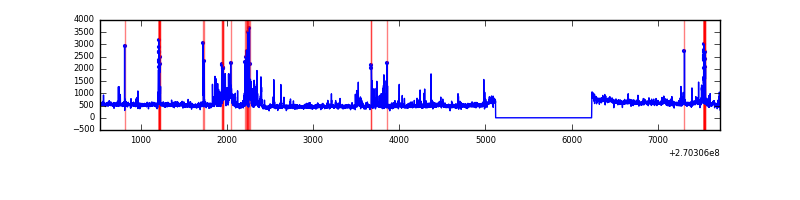 |
| C | 7196 | 6081 | 1 | 1 | 0.01% | 0.02% | 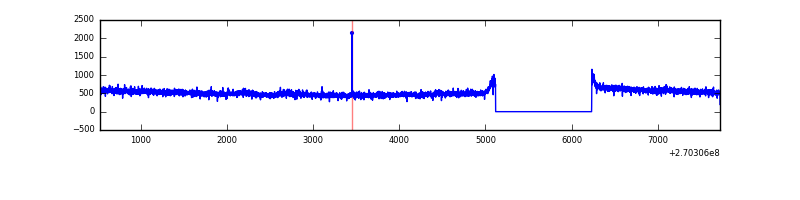 |
| D | 7196 | 6081 | 11 | 11 | 0.15% | 0.18% | 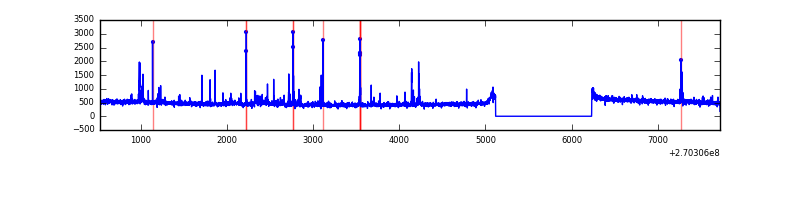 |
Top three noisy pixels from each quadrant. If the there are fewer than three noisy pixels in the level2.evt file, extra rows are filled as -1
| Pixel properties | Quadrant properties | ||||||
|---|---|---|---|---|---|---|---|
| Quadrant | DetID | PixID | Counts | Sigma | Mean | Median | Sigma |
| A | 12 | 189 | 69556 | 440.78 | 782 | 769 | 156.1 |
| A | 12 | 30 | 31391 | 196.22 | 782 | 769 | 156.1 |
| A | 9 | 143 | 25062 | 155.67 | 782 | 769 | 156.1 |
| B | 10 | 16 | 280637 | 1895.93 | 768 | 751 | 147.6 |
| B | 4 | 142 | 94191 | 632.96 | 768 | 751 | 147.6 |
| B | 0 | 205 | 52493 | 350.5 | 768 | 751 | 147.6 |
| C | 3 | 233 | 201680 | 1167.88 | 746 | 751 | 172.0 |
| C | 7 | 247 | 26800 | 151.41 | 746 | 751 | 172.0 |
| C | 13 | 61 | 5342 | 26.68 | 746 | 751 | 172.0 |
| D | 5 | 222 | 55193 | 295.94 | 756 | 735 | 184.0 |
| D | 2 | 33 | 32144 | 170.69 | 756 | 735 | 184.0 |
| D | 2 | 234 | 22587 | 118.75 | 756 | 735 | 184.0 |
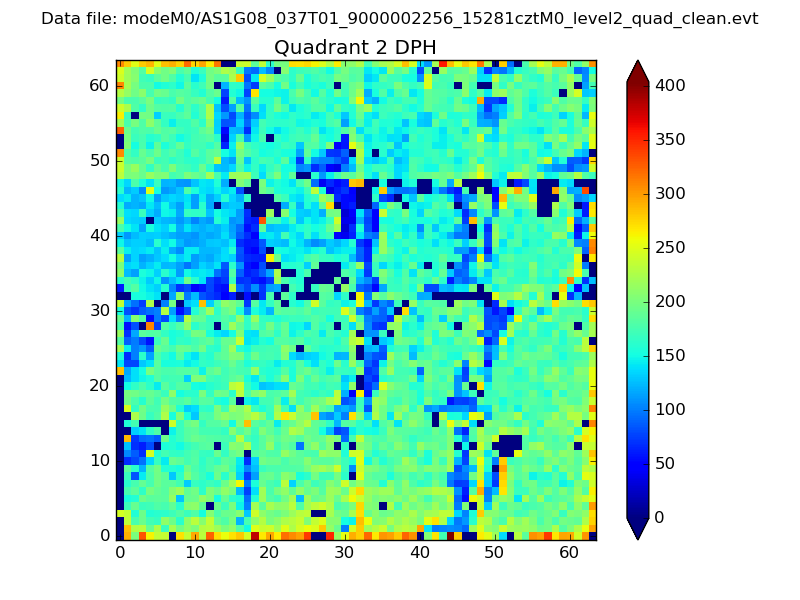
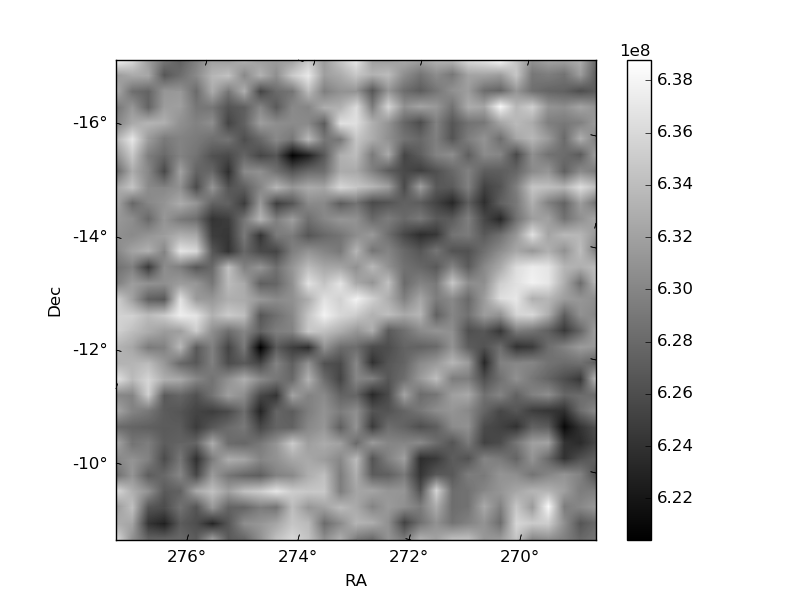
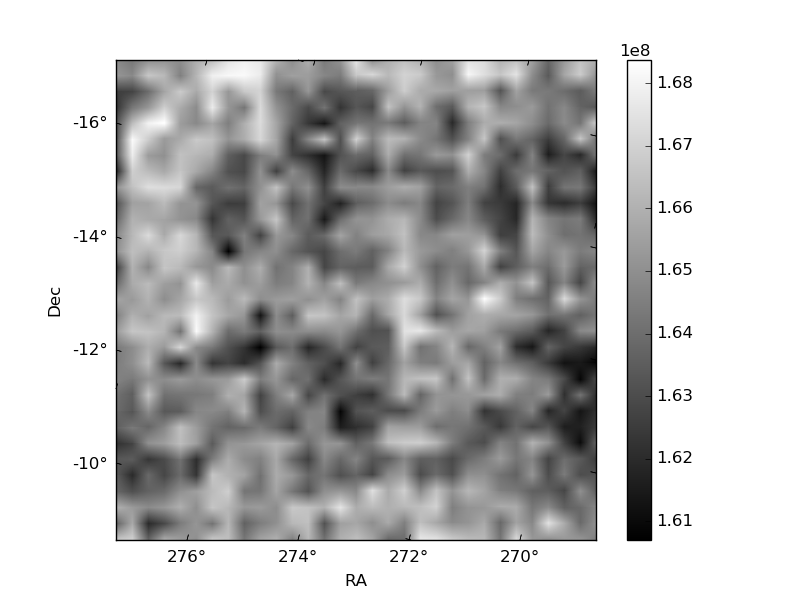
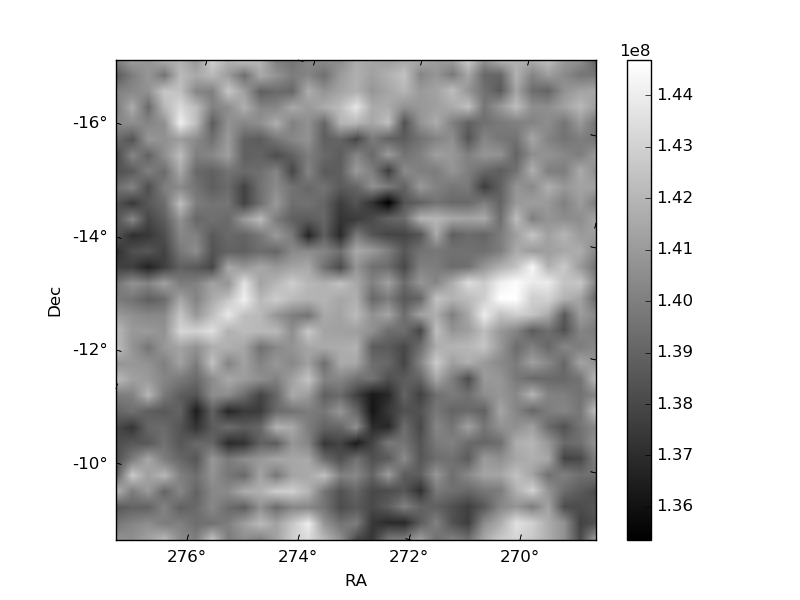
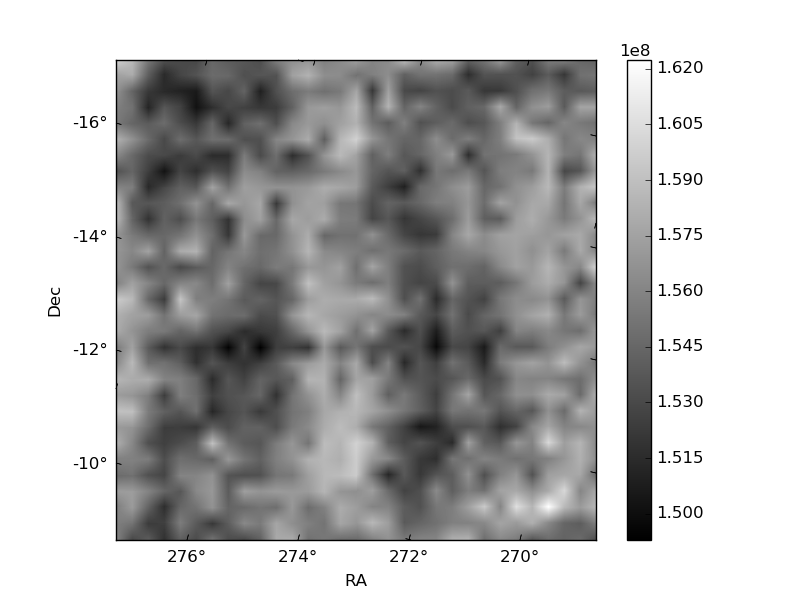
Histogram calculated using DETX and DETY for each event in the final _common_clean file
| Quadrant A | 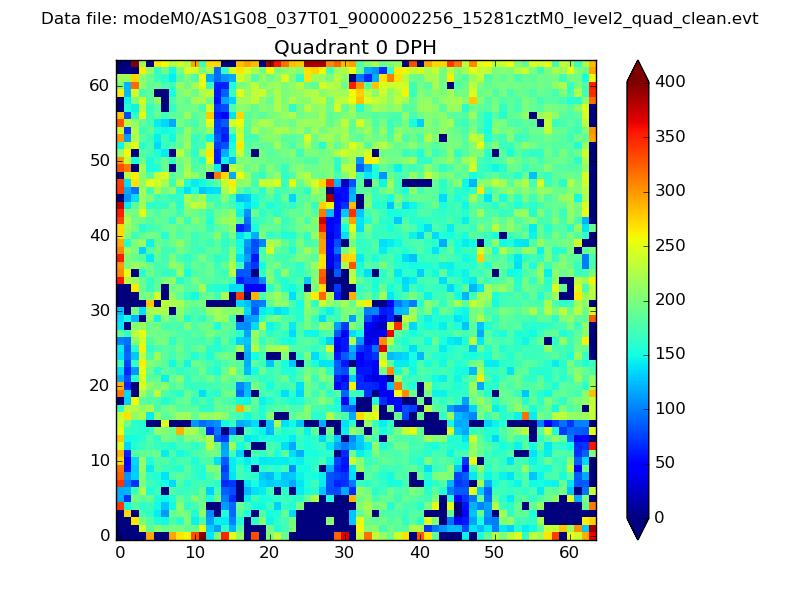 |
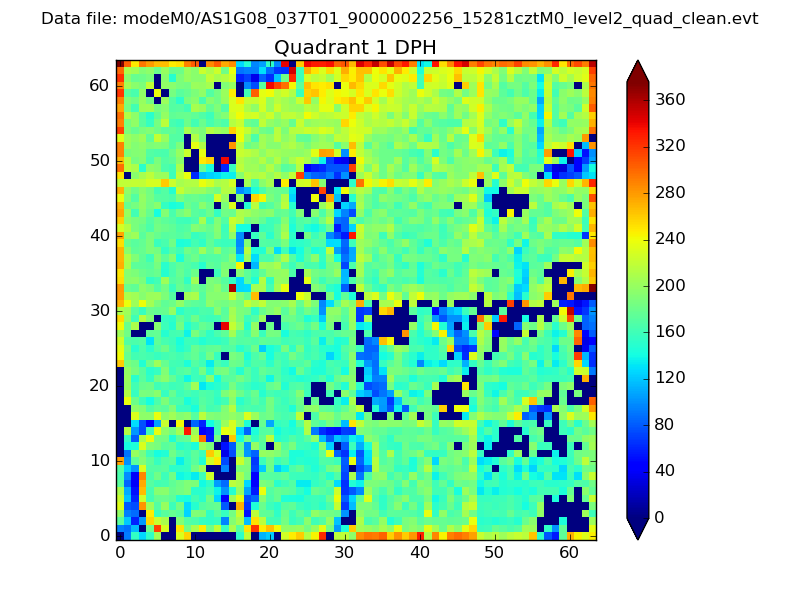 |
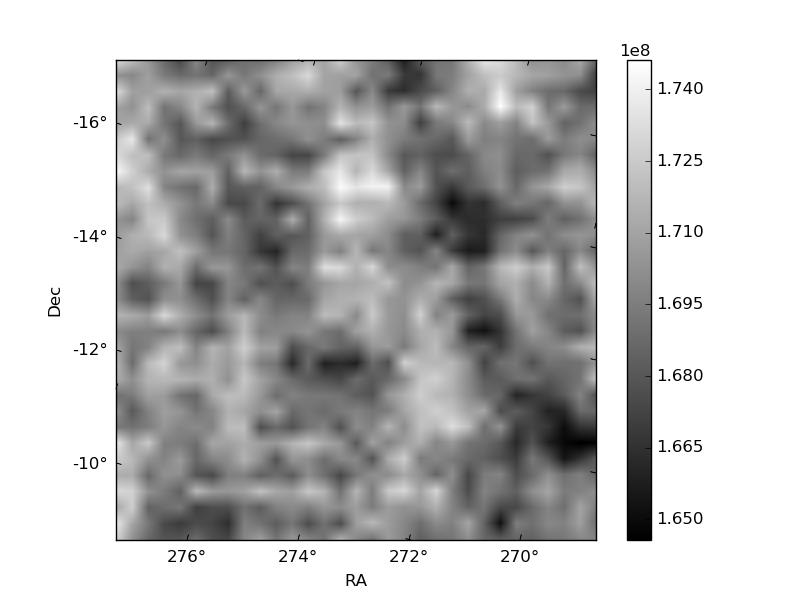
Quadrant B |
|---|---|---|---|
| Quadrant D | 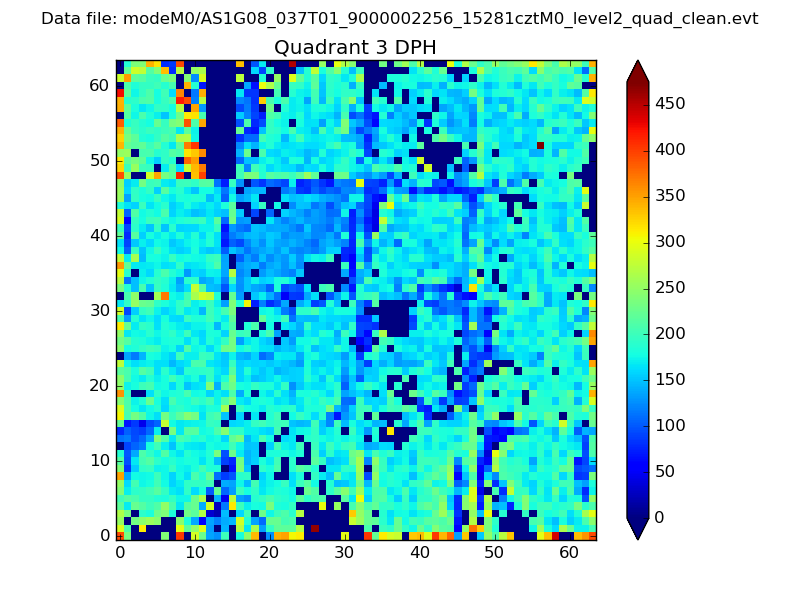 |
 |
Quadrant C |
| Plot type | Count rate plots | Images |
|---|---|---|
| Comparison with Poisson distribution Blue bars denote a histogram of data divided into 1 sec bins. Red curve is a Poisson curve with rate = median count rate of data. |
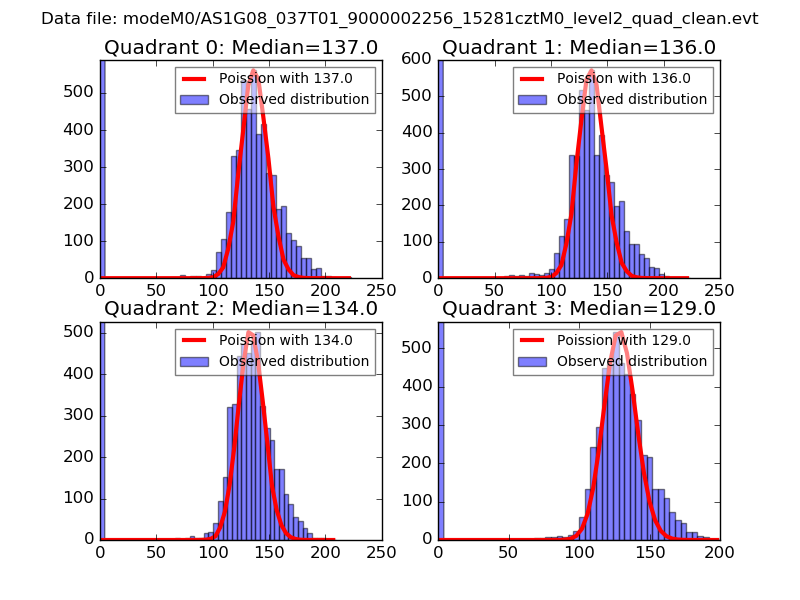 |
 |
| Quadrant-wise count rates Data is divided into 100 sec bins |
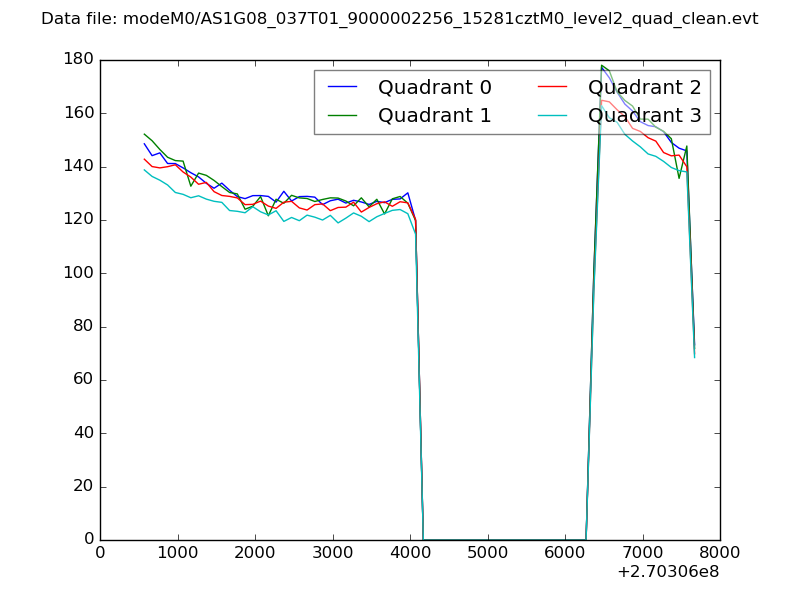 |
|
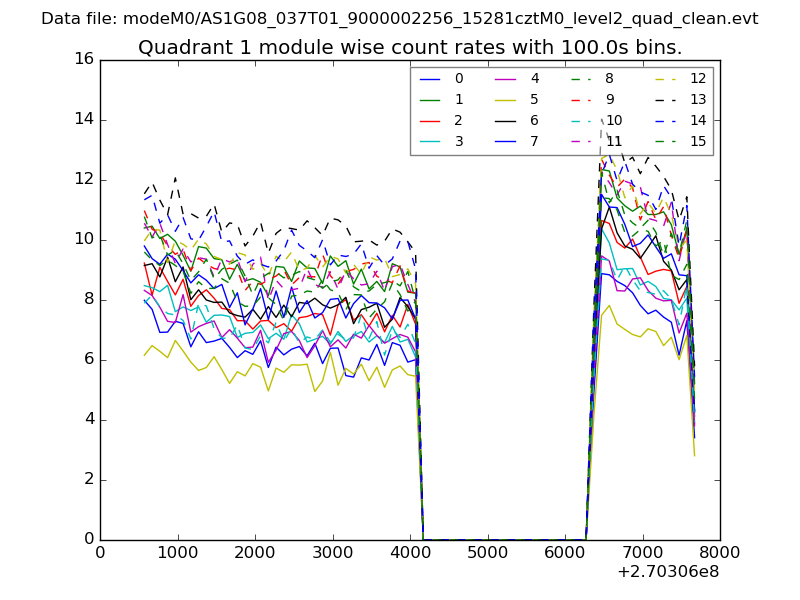
| Module-wise count rates for Quadrant A Data is divided into 100 sec bins |
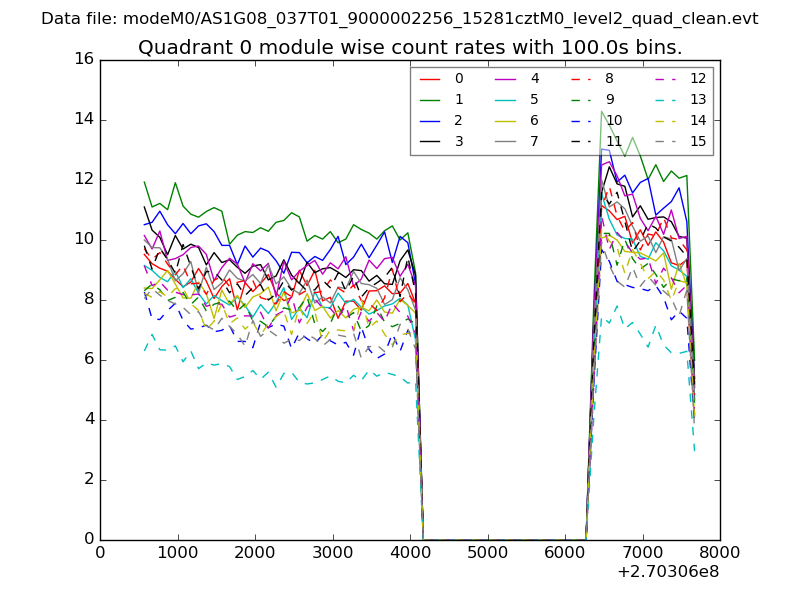 |
 |
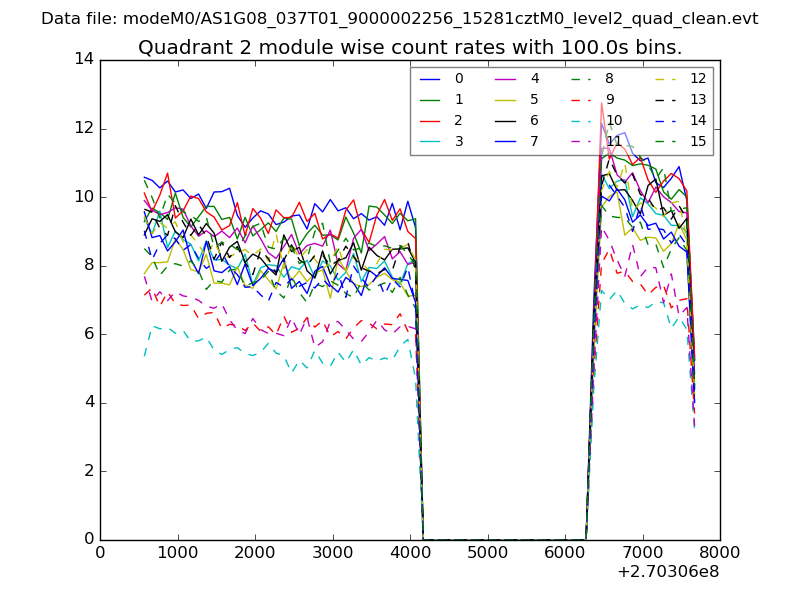
| Module-wise count rates for Quadrant B Data is divided into 100 sec bins |
 |
 |
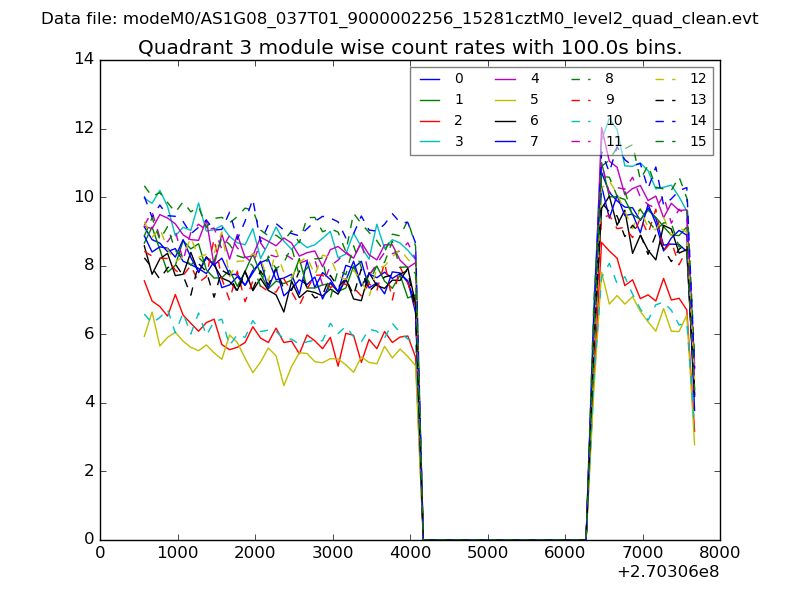
| Module-wise count rates for Quadrant C Data is divided into 100 sec bins |
 |
 |
| Module-wise count rates for Quadrant D Data is divided into 100 sec bins |
 |
 |
| Parameter | Plot |
|---|---|
| CZT HV Monitor | 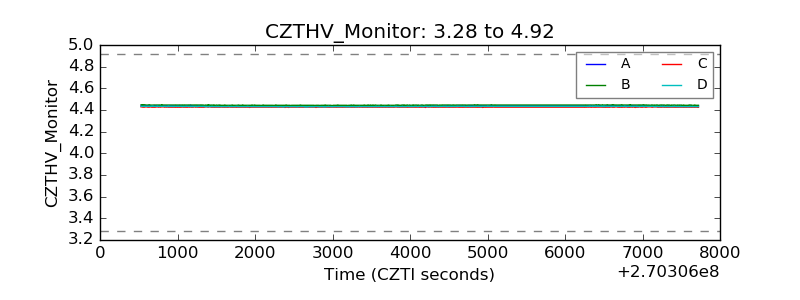 |
| D_VDD | 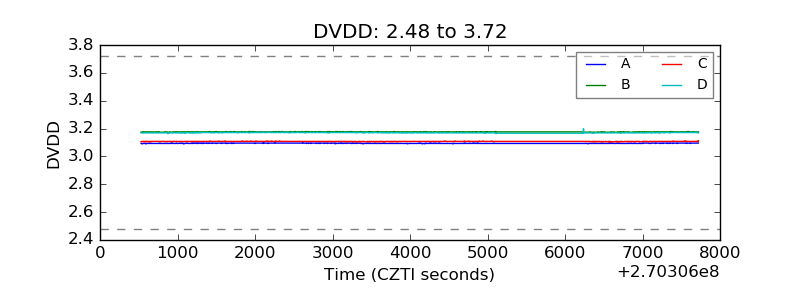 |
| Temperature 1 | 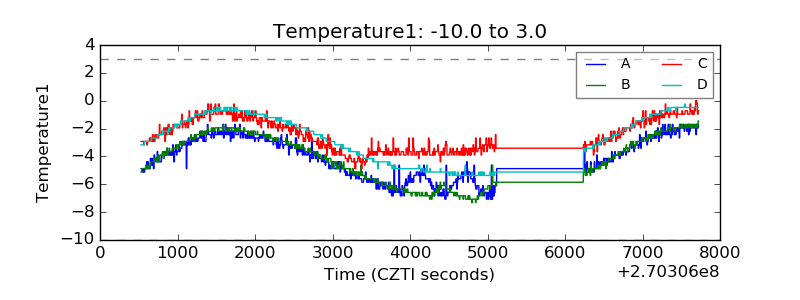 |
| Veto HV Monitor | 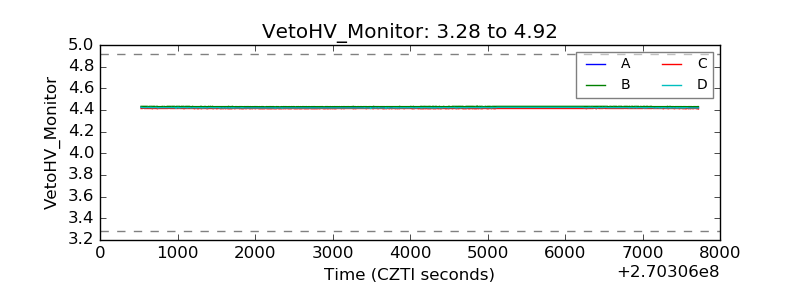 |
| Veto LLD | 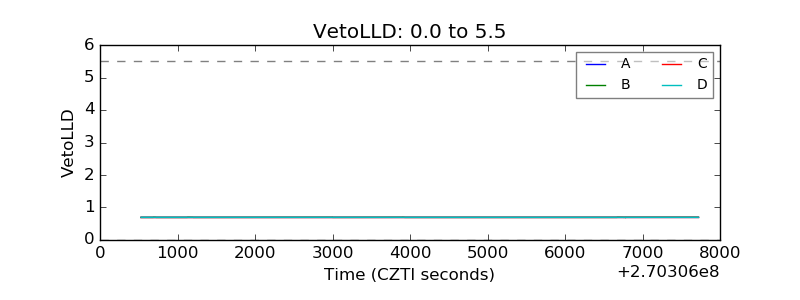 |
| Alpha Counter | 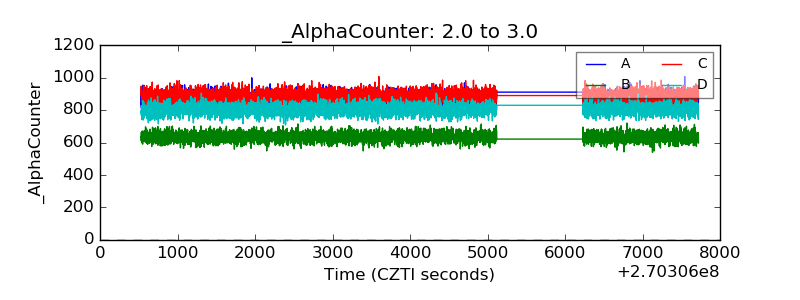 |
| _CPM_Rate | 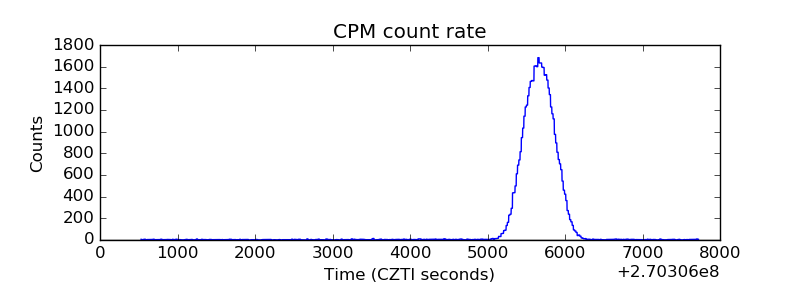 |
| CZT Counter | 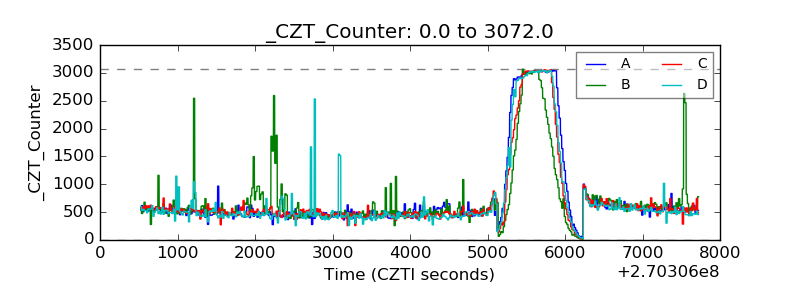 |
| +2.5 Volts monitor |  |
| +5 Volts monitor |  |
| _ROLL_ROT | 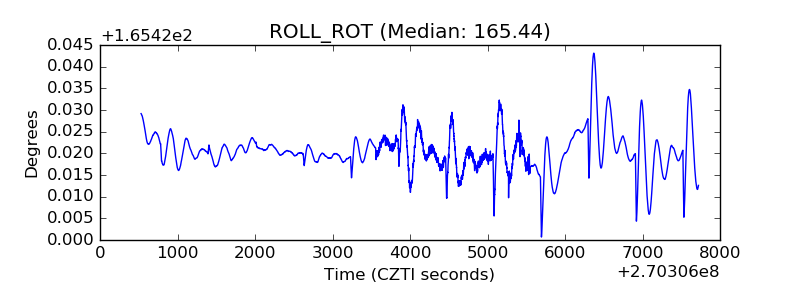 |
| _Roll_DEC | 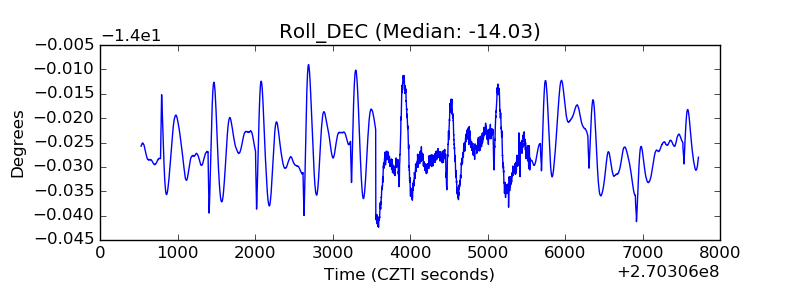 |
| _Roll_RA | 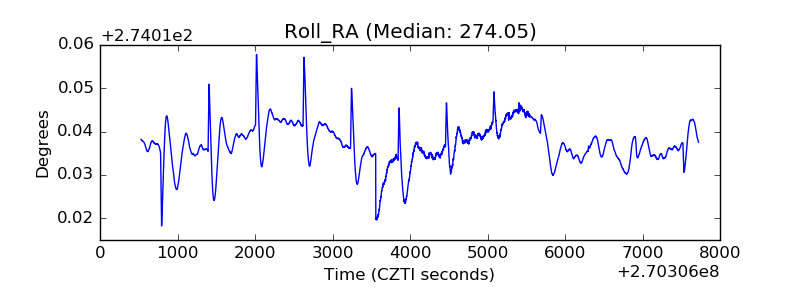 |
| Veto Counter | 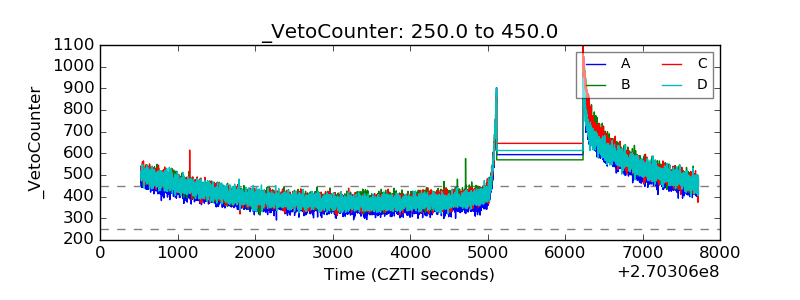 |