| Param | Original file | Final file |
|---|---|---|
| Filename | modeM0/AS1G08_037T01_9000002256_15283cztM0_level2.evt | modeM0/AS1G08_037T01_9000002256_15283cztM0_level2_quad_clean.evt |
| Size (bytes) | 466,084,800 | 108,777,600 |
| Size | 444.5 MB | 103.7 MB |
| Events in quadrant A | 3,265,050 | 736,617 |
| Events in quadrant B | 4,094,292 | 724,209 |
| Events in quadrant C | 3,246,341 | 712,165 |
| Events in quadrant D | 3,089,085 | 689,017 |
| Mode M9 | |||
|---|---|---|---|
| Quadrant | BADHDUFLAG | Total packets | Discarded packets |
| A | 0 | 12 | 0 |
| B | 0 | 12 | 0 |
| C | 0 | 12 | 0 |
| D | 0 | 12 | 0 |
| Mode SS | |||
|---|---|---|---|
| Quadrant | BADHDUFLAG | Total packets | Discarded packets |
| A | 0 | 126 | 0 |
| B | 0 | 126 | 0 |
| C | 0 | 126 | 0 |
| D | 0 | 126 | 0 |
| Mode M0 | |||
|---|---|---|---|
| Quadrant | BADHDUFLAG | Total packets | Discarded packets |
| A | 0 | 13664 | 2 |
| B | 0 | 16309 | 1 |
| C | 0 | 13356 | 1 |
| D | 0 | 13265 | 1 |
| Quadrant | Total seconds | Saturated seconds | Saturation percentage |
|---|---|---|---|
| A | 6195 | 101 | 1.630347% |
| B | 6195 | 298 | 4.810331% |
| C | 6195 | 72 | 1.162228% |
| D | 6195 | 73 | 1.178370% |
Noise dominated data is calculated using 1-second bins in cleaned event files. If a bin has >2000 counts, and if more than 50% of those come from <1% of pixels, then it is considered to be noise-dominated and hence unusable.
| Quadrant | # 1 sec bins | Bins with >0 counts | Bins with >2000 counts | High rate bins dominated by noise | Noise dominated (total time) | Noise dominated (detector-on time) | Marked lightcurve |
|---|---|---|---|---|---|---|---|
| A | 7396 | 6196 | 1 | 1 | 0.01% | 0.02% | 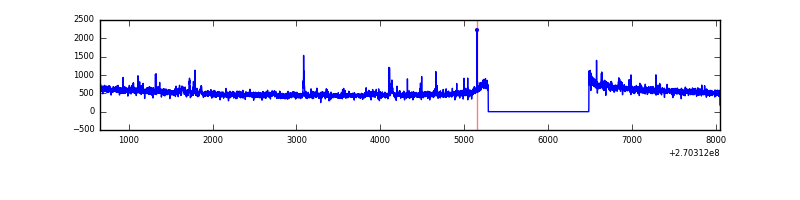 |
| B | 7396 | 6196 | 138 | 138 | 1.87% | 2.23% | 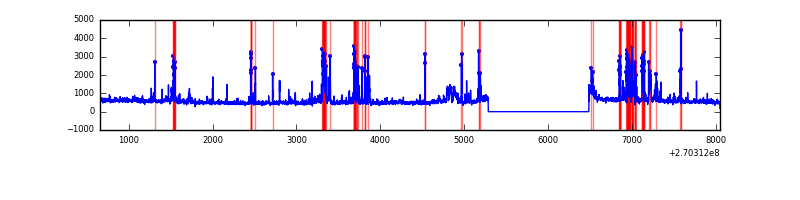 |
| C | 7396 | 6196 | 0 | 0 | 0.00% | 0.00% | 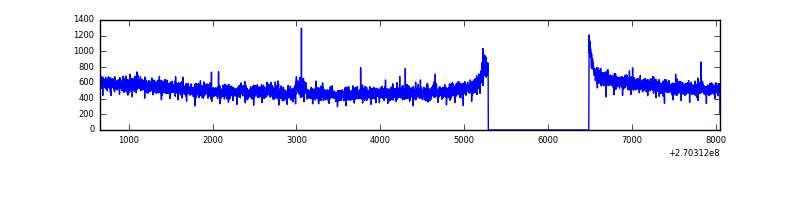 |
| D | 7396 | 6196 | 2 | 2 | 0.03% | 0.03% | 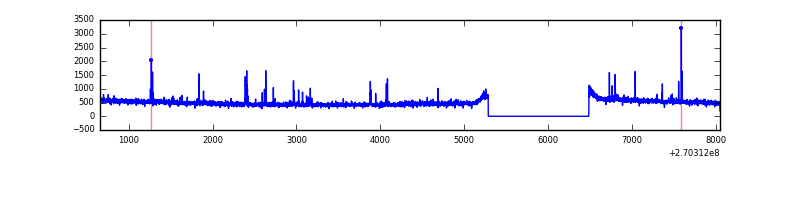 |
Top three noisy pixels from each quadrant. If the there are fewer than three noisy pixels in the level2.evt file, extra rows are filled as -1
| Pixel properties | Quadrant properties | ||||||
|---|---|---|---|---|---|---|---|
| Quadrant | DetID | PixID | Counts | Sigma | Mean | Median | Sigma |
| A | 12 | 189 | 94327 | 564.88 | 821 | 807 | 165.6 |
| A | 9 | 143 | 10570 | 58.97 | 821 | 807 | 165.6 |
| A | 0 | 226 | 7334 | 39.42 | 821 | 807 | 165.6 |
| B | 10 | 16 | 788573 | 5168.05 | 795 | 777 | 152.4 |
| B | 0 | 219 | 50763 | 327.91 | 795 | 777 | 152.4 |
| B | 3 | 209 | 36744 | 235.95 | 795 | 777 | 152.4 |
| C | 3 | 233 | 202885 | 1128.75 | 778 | 783 | 179.1 |
| C | 7 | 247 | 11119 | 57.73 | 778 | 783 | 179.1 |
| C | 13 | 61 | 5584 | 26.81 | 778 | 783 | 179.1 |
| D | 7 | 38 | 37785 | 194.29 | 790 | 768 | 190.5 |
| D | 2 | 234 | 23151 | 117.48 | 790 | 768 | 190.5 |
| D | 2 | 152 | 17160 | 86.04 | 790 | 768 | 190.5 |
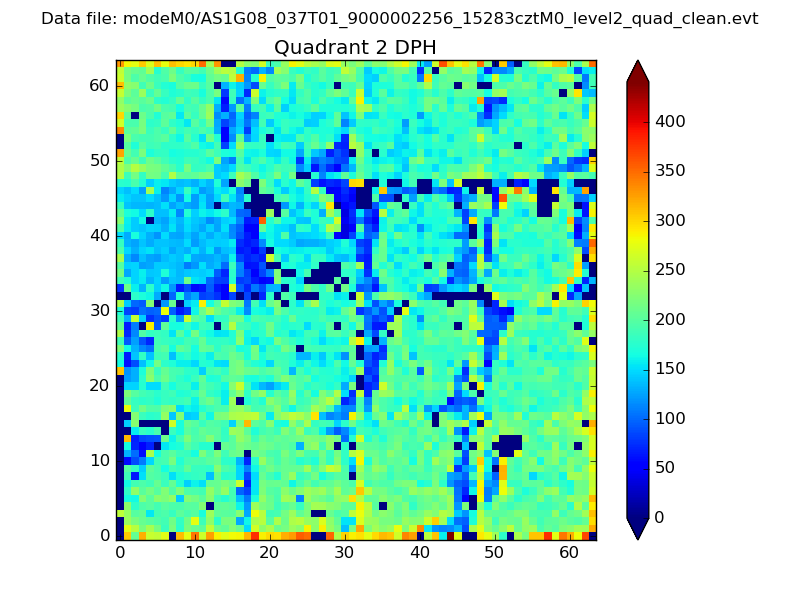
Histogram calculated using DETX and DETY for each event in the final _common_clean file
| Quadrant A | 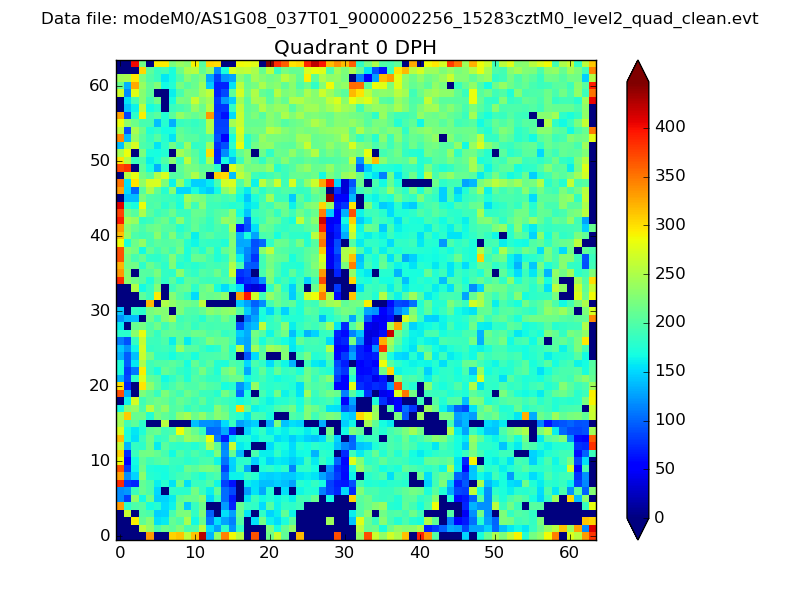 |
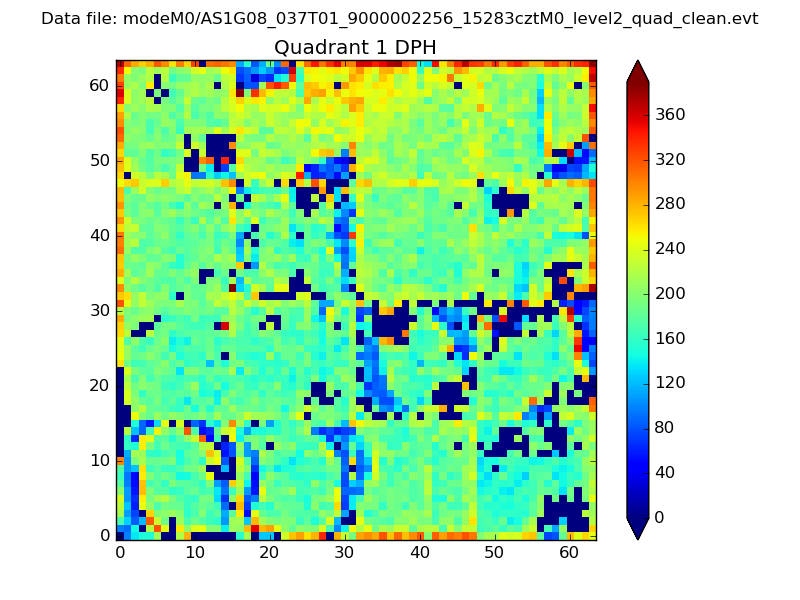 |
Quadrant B |
|---|---|---|---|
| Quadrant D | 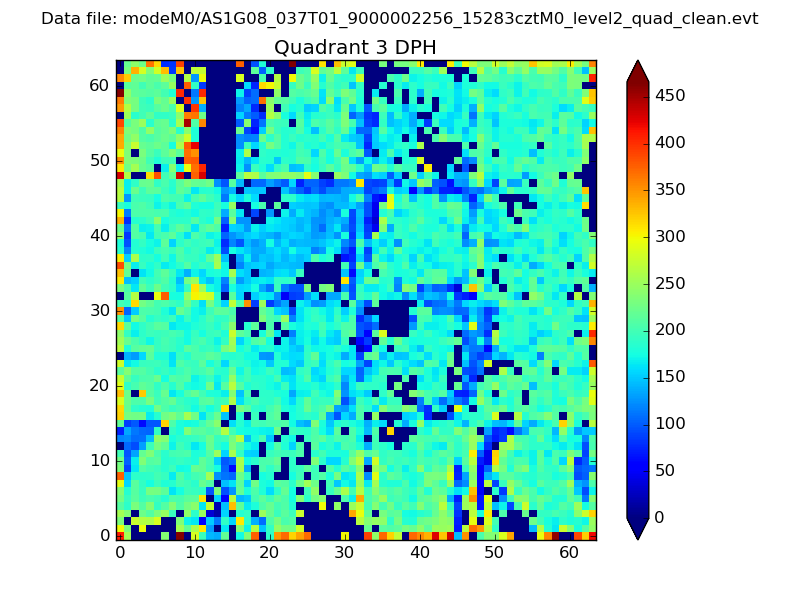 |
 |
Quadrant C |
| Plot type | Count rate plots | Images |
|---|---|---|
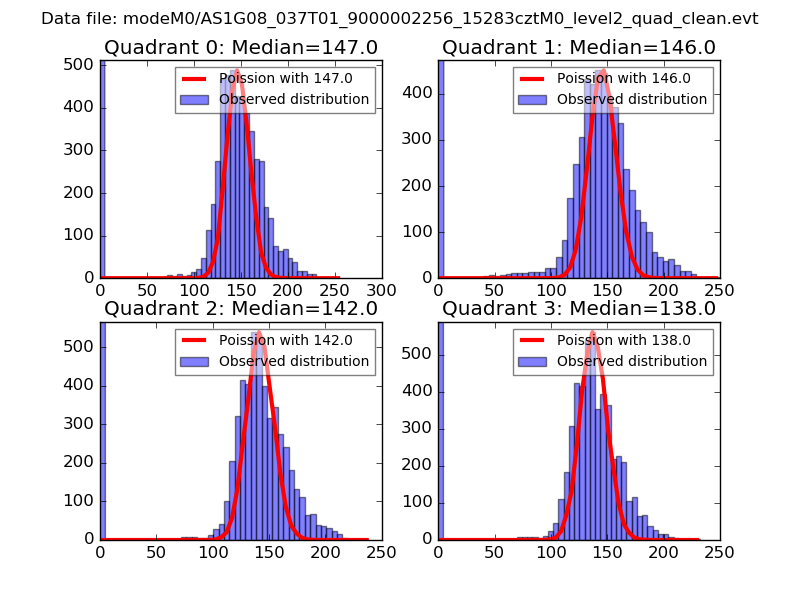
| Comparison with Poisson distribution Blue bars denote a histogram of data divided into 1 sec bins. Red curve is a Poisson curve with rate = median count rate of data. |
 |
 |
| Quadrant-wise count rates Data is divided into 100 sec bins |
 |
|
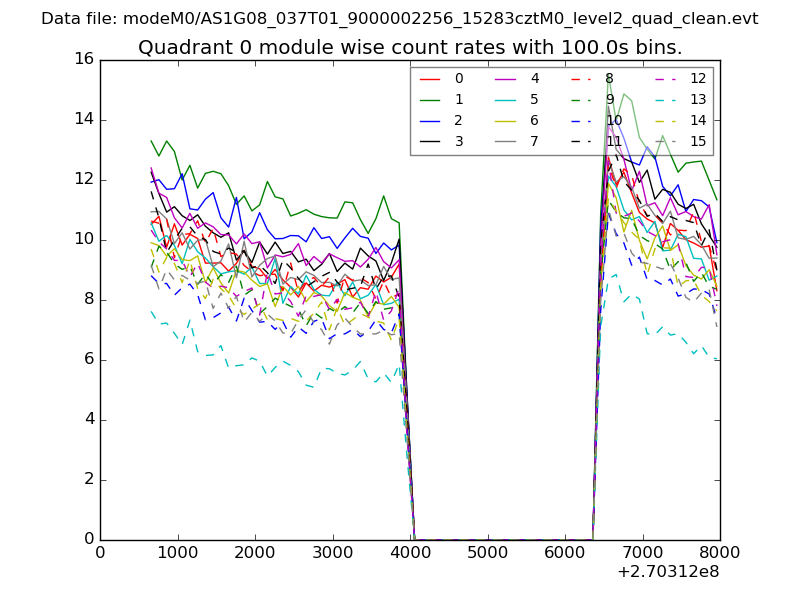
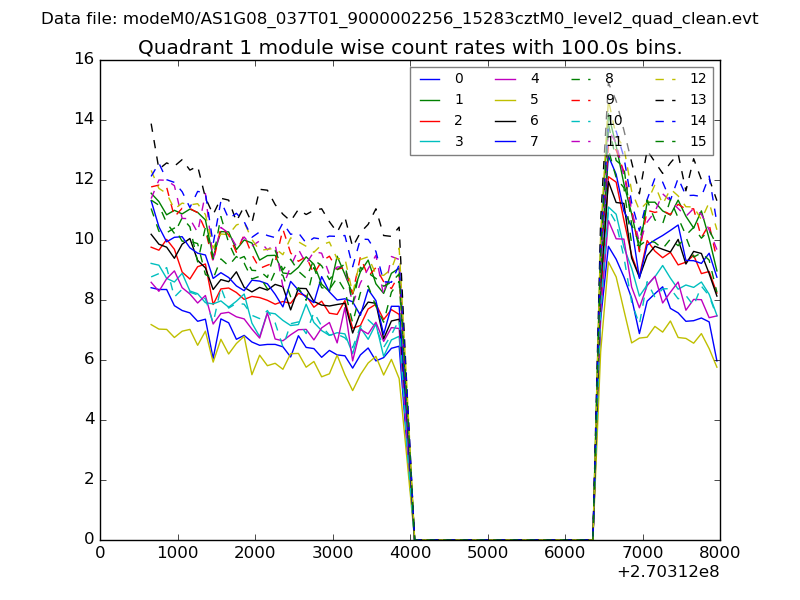
| Module-wise count rates for Quadrant A Data is divided into 100 sec bins |
 |
 |
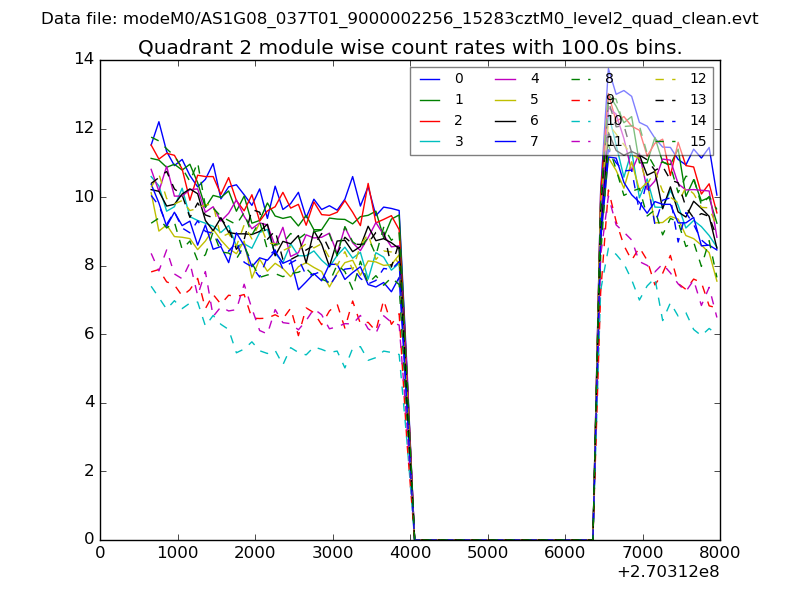
| Module-wise count rates for Quadrant B Data is divided into 100 sec bins |
 |
 |
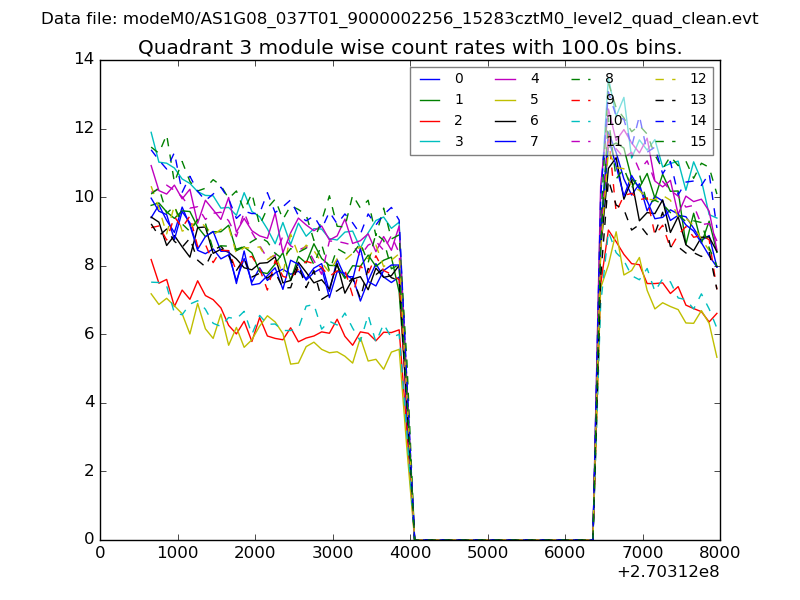
| Module-wise count rates for Quadrant C Data is divided into 100 sec bins |
 |
 |
| Module-wise count rates for Quadrant D Data is divided into 100 sec bins |
 |
 |
| Parameter | Plot |
|---|---|
| CZT HV Monitor | 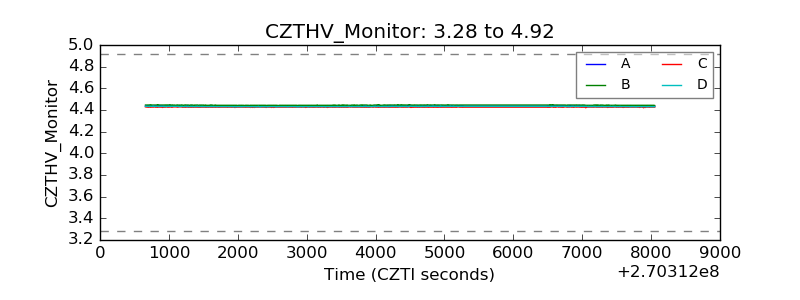 |
| D_VDD | 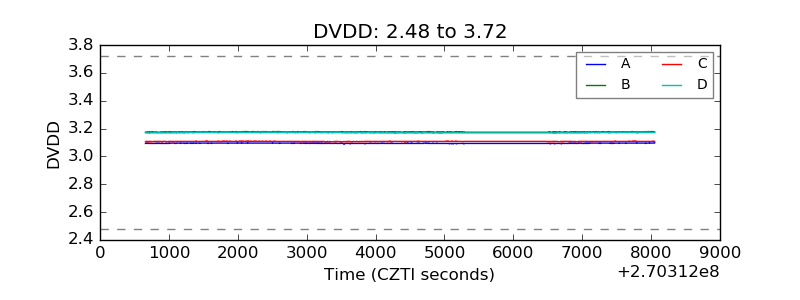 |
| Temperature 1 | 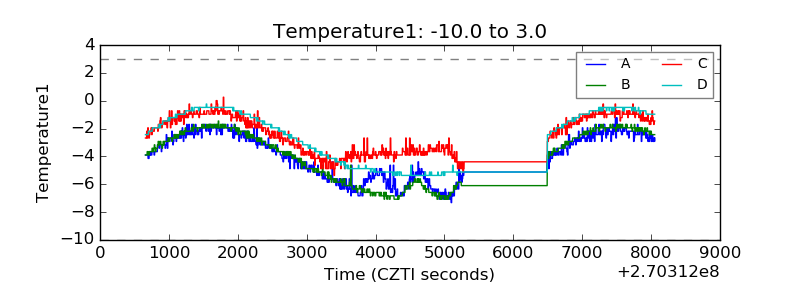 |
| Veto HV Monitor | 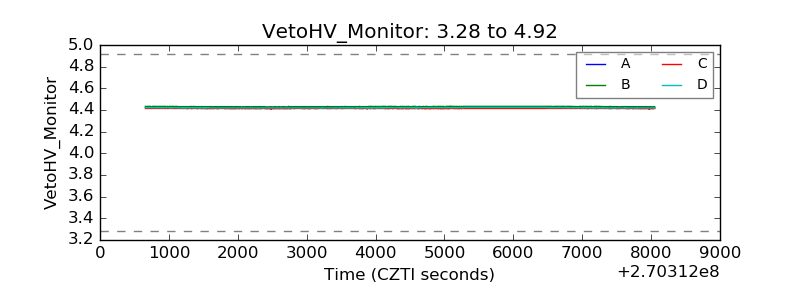 |
| Veto LLD | 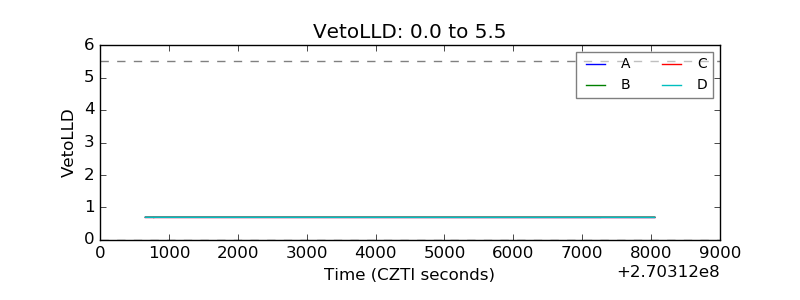 |
| Alpha Counter | 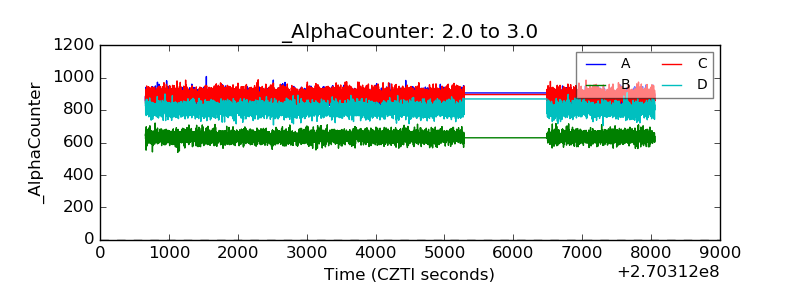 |
| _CPM_Rate |  |
| CZT Counter | 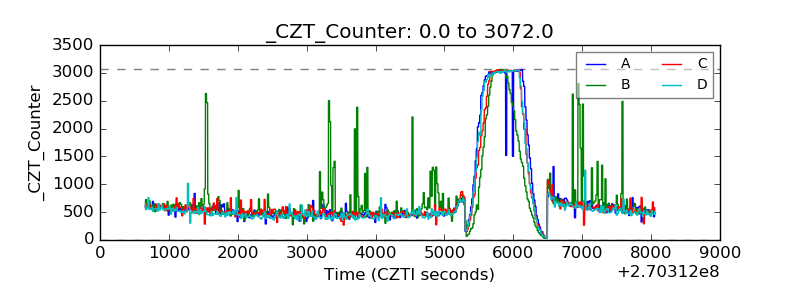 |
| +2.5 Volts monitor |  |
| +5 Volts monitor | 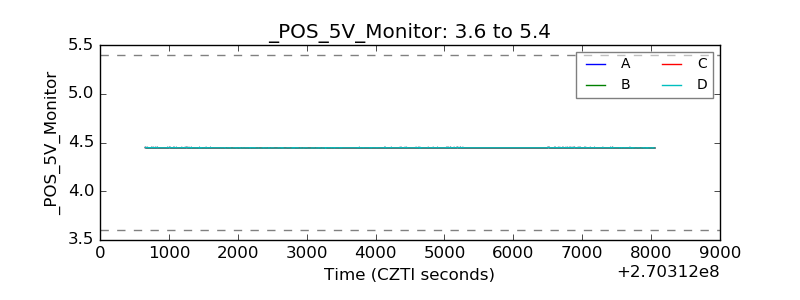 |
| _ROLL_ROT | 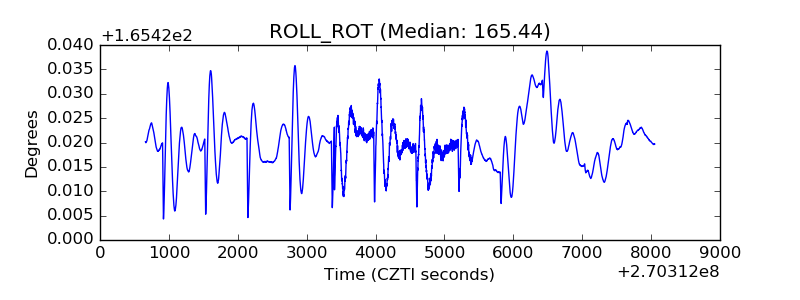 |
| _Roll_DEC | 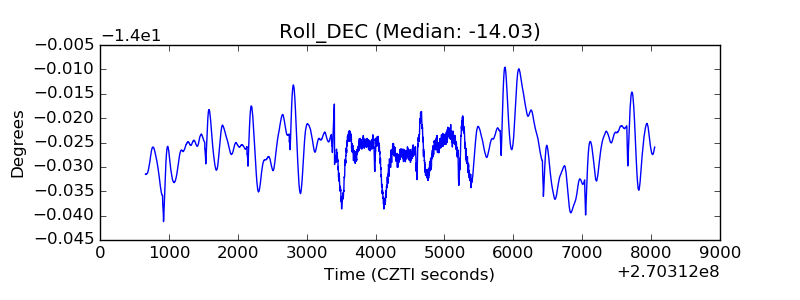 |
| _Roll_RA | 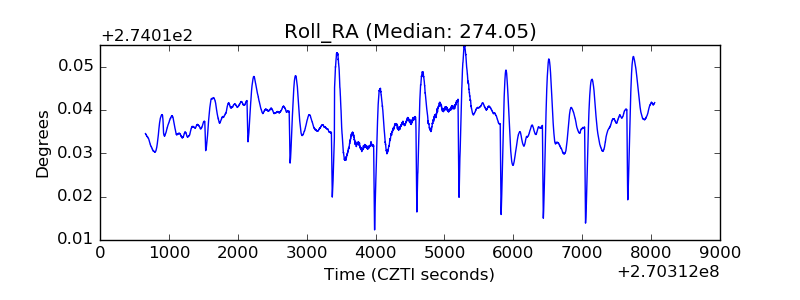 |
| Veto Counter | 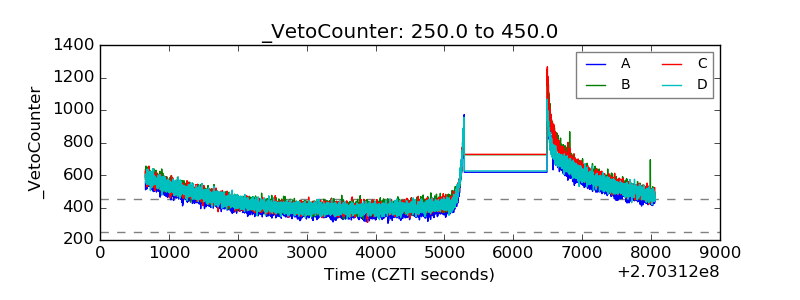 |