| Param | Original file | Final file |
|---|---|---|
| Filename | modeM0/AS1G08_037T01_9000002256_15284cztM0_level2.evt | modeM0/AS1G08_037T01_9000002256_15284cztM0_level2_quad_clean.evt |
| Size (bytes) | 488,836,800 | 102,790,080 |
| Size | 466.2 MB | 98.0 MB |
| Events in quadrant A | 3,210,096 | 694,980 |
| Events in quadrant B | 4,849,756 | 675,039 |
| Events in quadrant C | 3,234,260 | 669,807 |
| Events in quadrant D | 3,093,287 | 644,344 |
| Mode M9 | |||
|---|---|---|---|
| Quadrant | BADHDUFLAG | Total packets | Discarded packets |
| A | 0 | 13 | 0 |
| B | 0 | 13 | 0 |
| C | 0 | 13 | 0 |
| D | 0 | 13 | 0 |
| Mode SS | |||
|---|---|---|---|
| Quadrant | BADHDUFLAG | Total packets | Discarded packets |
| A | 0 | 124 | 0 |
| B | 0 | 124 | 0 |
| C | 0 | 124 | 0 |
| D | 0 | 124 | 0 |
| Mode M0 | |||
|---|---|---|---|
| Quadrant | BADHDUFLAG | Total packets | Discarded packets |
| A | 0 | 13399 | 2 |
| B | 0 | 18434 | 1 |
| C | 0 | 13361 | 1 |
| D | 0 | 13227 | 1 |
| Quadrant | Total seconds | Saturated seconds | Saturation percentage |
|---|---|---|---|
| A | 6146 | 93 | 1.513179% |
| B | 6146 | 639 | 10.397006% |
| C | 6146 | 61 | 0.992515% |
| D | 6146 | 86 | 1.399284% |
Noise dominated data is calculated using 1-second bins in cleaned event files. If a bin has >2000 counts, and if more than 50% of those come from <1% of pixels, then it is considered to be noise-dominated and hence unusable.
| Quadrant | # 1 sec bins | Bins with >0 counts | Bins with >2000 counts | High rate bins dominated by noise | Noise dominated (total time) | Noise dominated (detector-on time) | Marked lightcurve |
|---|---|---|---|---|---|---|---|
| A | 7432 | 6147 | 1 | 1 | 0.01% | 0.02% | 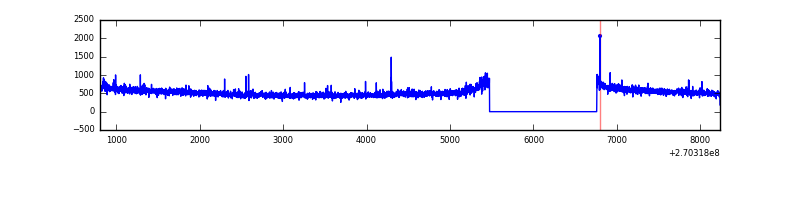 |
| B | 7432 | 6147 | 364 | 364 | 4.90% | 5.92% | 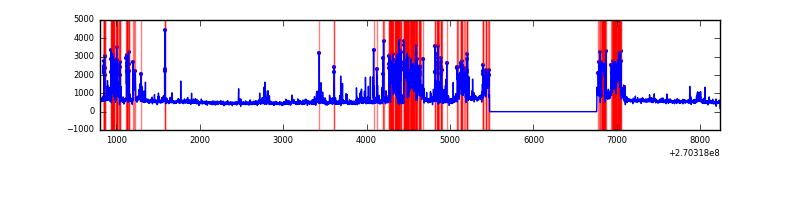 |
| C | 7432 | 6147 | 0 | 0 | 0.00% | 0.00% | 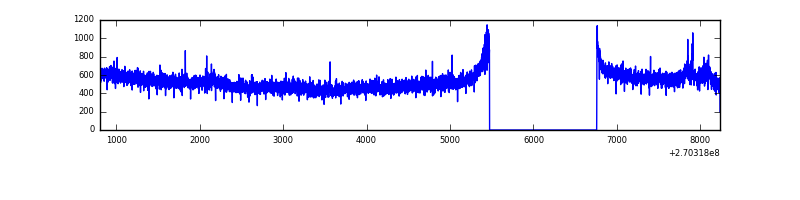 |
| D | 7432 | 6147 | 6 | 6 | 0.08% | 0.10% | 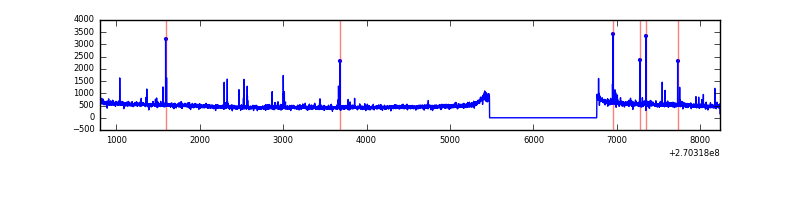 |
Top three noisy pixels from each quadrant. If the there are fewer than three noisy pixels in the level2.evt file, extra rows are filled as -1
| Pixel properties | Quadrant properties | ||||||
|---|---|---|---|---|---|---|---|
| Quadrant | DetID | PixID | Counts | Sigma | Mean | Median | Sigma |
| A | 12 | 189 | 51612 | 306.99 | 819 | 808 | 165.5 |
| A | 9 | 143 | 14301 | 81.53 | 819 | 808 | 165.5 |
| A | 0 | 226 | 7530 | 40.62 | 819 | 808 | 165.5 |
| B | 10 | 16 | 1452552 | 9933.26 | 771 | 755 | 146.2 |
| B | 0 | 85 | 185222 | 1262.13 | 771 | 755 | 146.2 |
| B | 0 | 219 | 49628 | 334.39 | 771 | 755 | 146.2 |
| C | 3 | 233 | 199341 | 1113.19 | 777 | 784 | 178.4 |
| C | 13 | 61 | 5658 | 27.33 | 777 | 784 | 178.4 |
| C | 4 | 238 | 3768 | 16.73 | 777 | 784 | 178.4 |
| D | 7 | 38 | 33767 | 169.84 | 788 | 764 | 194.3 |
| D | 2 | 33 | 24702 | 123.19 | 788 | 764 | 194.3 |
| D | 2 | 234 | 22630 | 112.53 | 788 | 764 | 194.3 |
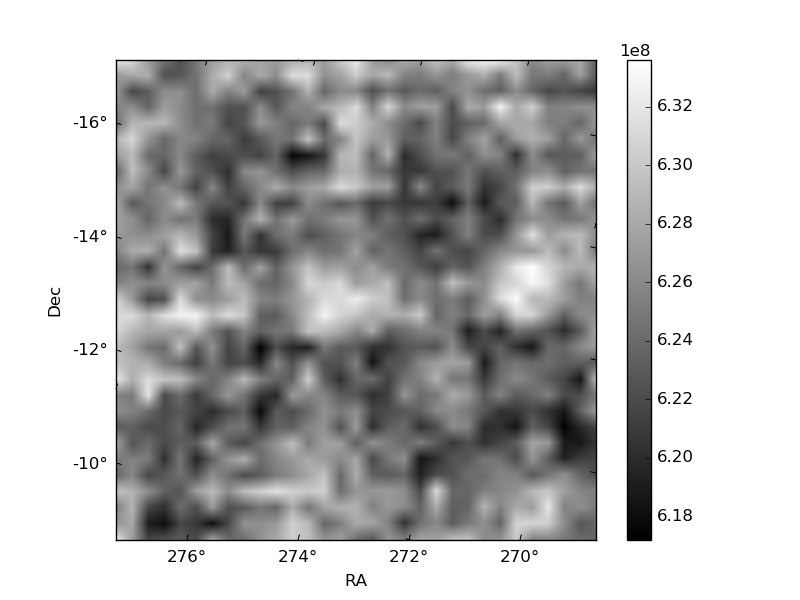
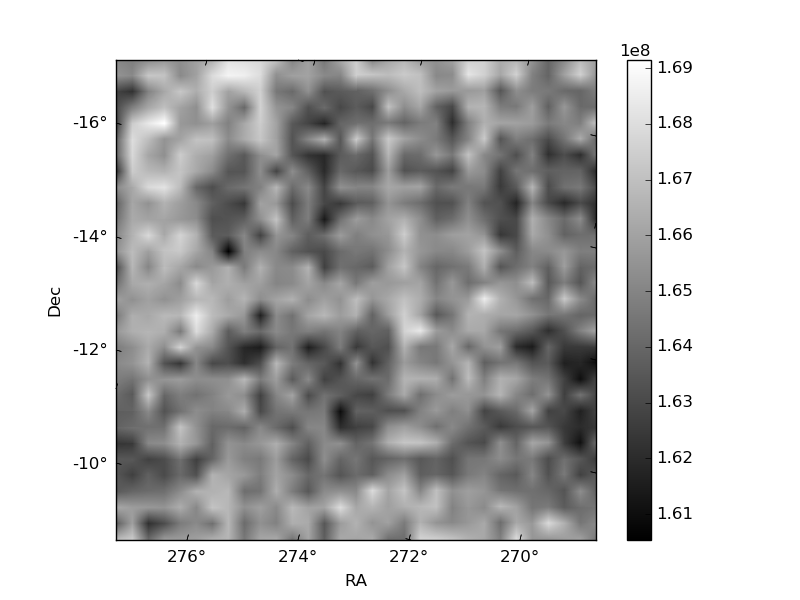
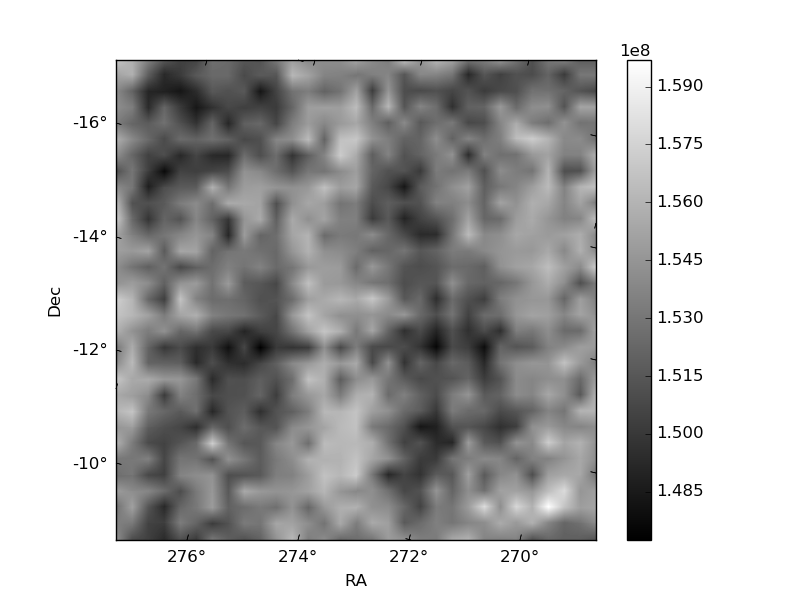
Histogram calculated using DETX and DETY for each event in the final _common_clean file
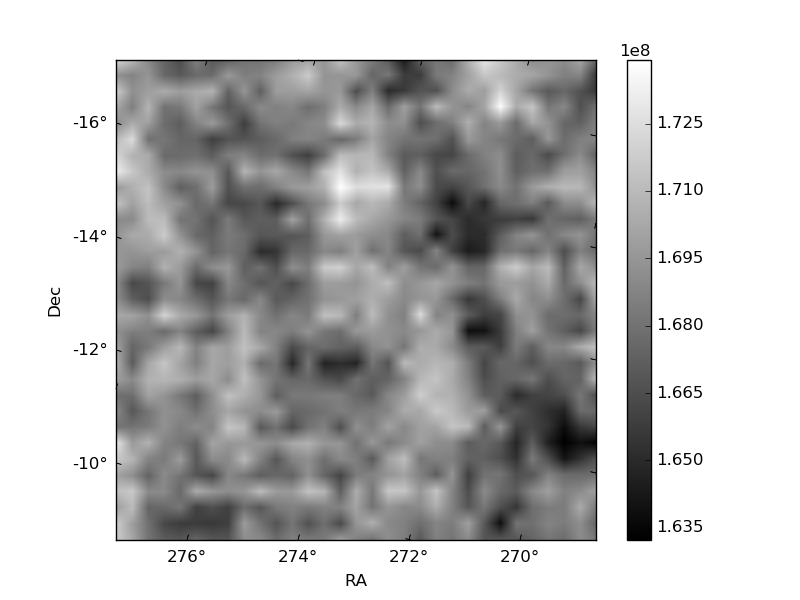
| Quadrant A | 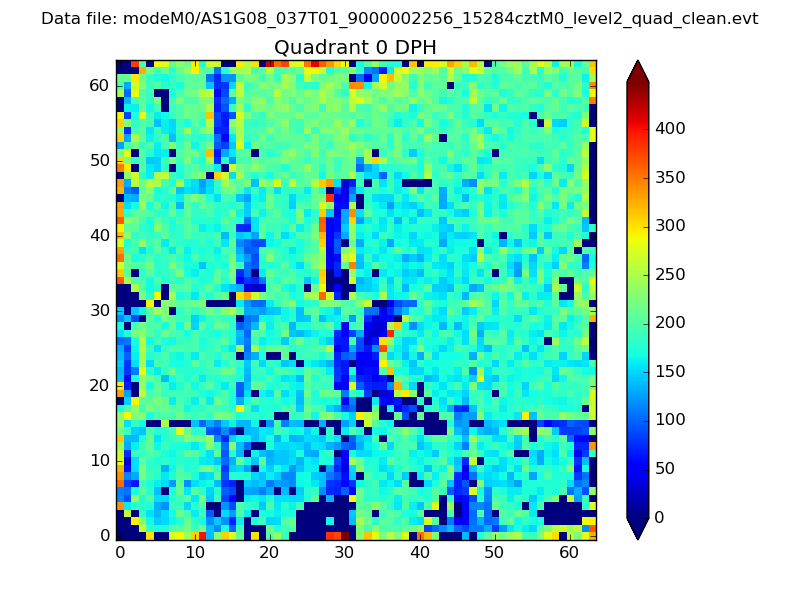 |
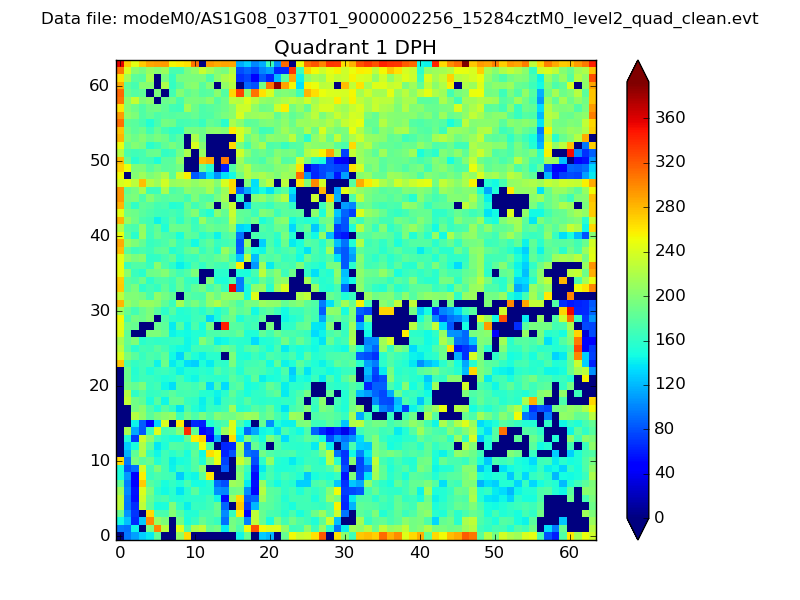 |
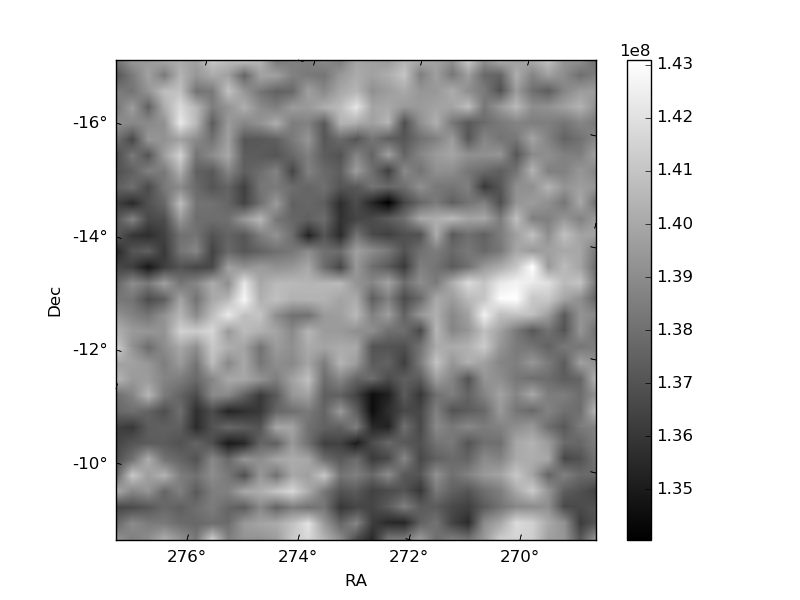
Quadrant B |
|---|---|---|---|
| Quadrant D | 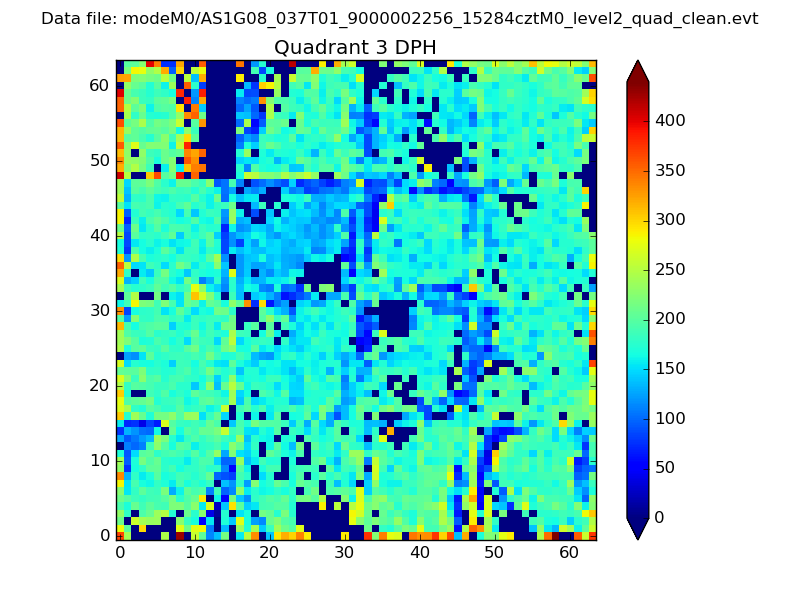 |
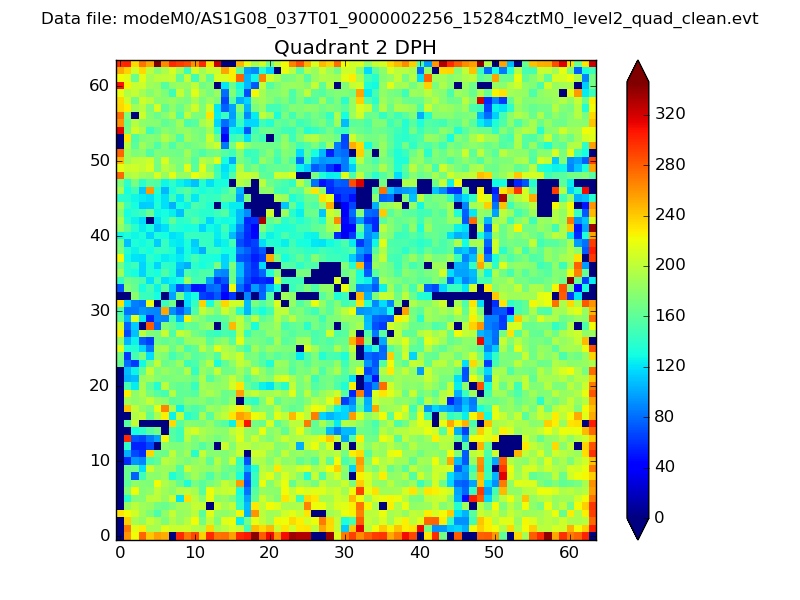 |
Quadrant C |
| Plot type | Count rate plots | Images |
|---|---|---|
| Comparison with Poisson distribution Blue bars denote a histogram of data divided into 1 sec bins. Red curve is a Poisson curve with rate = median count rate of data. |
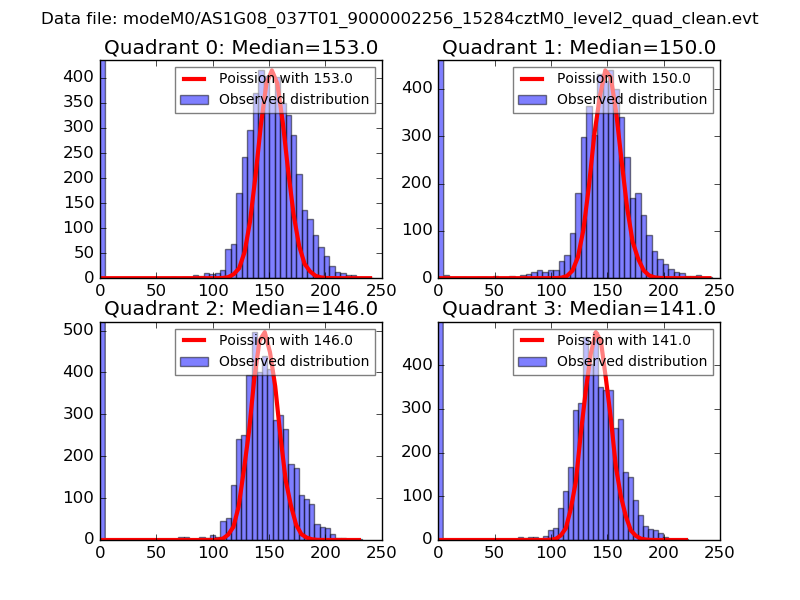 |
 |
| Quadrant-wise count rates Data is divided into 100 sec bins |
 |
|
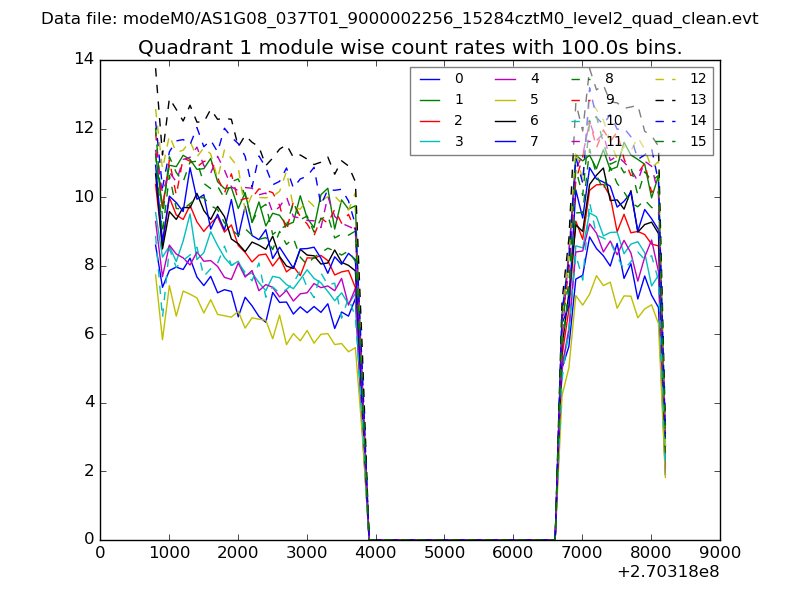
| Module-wise count rates for Quadrant A Data is divided into 100 sec bins |
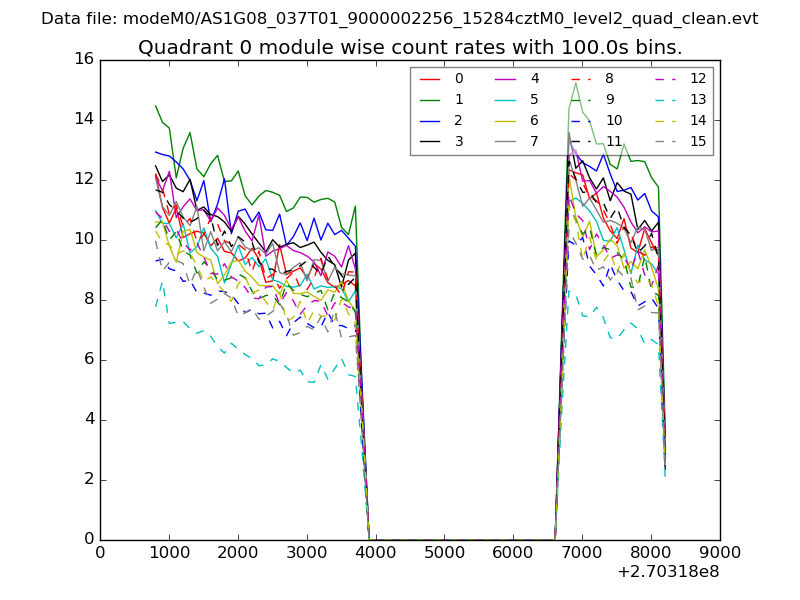 |
 |
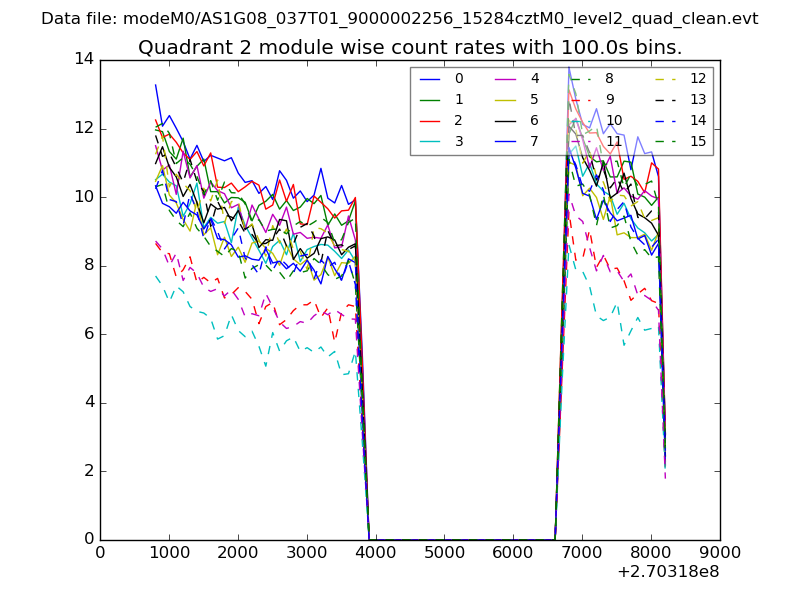
| Module-wise count rates for Quadrant B Data is divided into 100 sec bins |
 |
 |
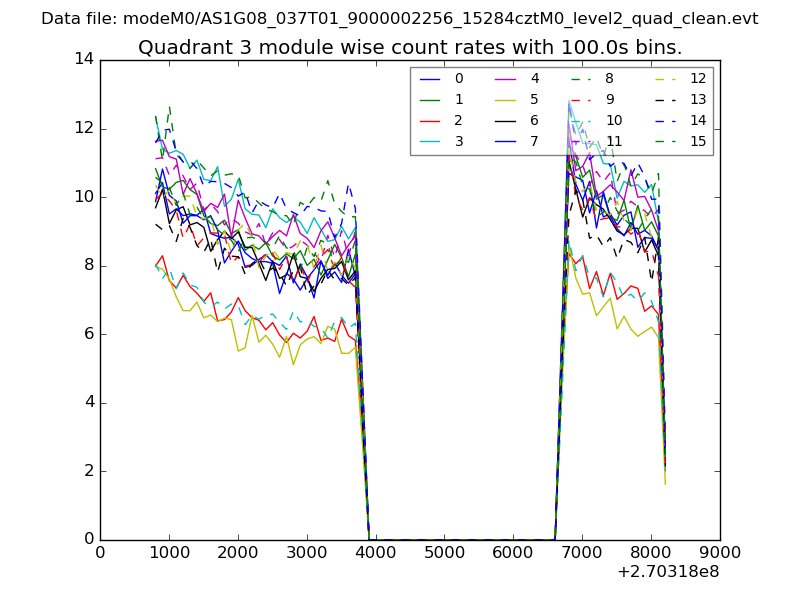
| Module-wise count rates for Quadrant C Data is divided into 100 sec bins |
 |
 |
| Module-wise count rates for Quadrant D Data is divided into 100 sec bins |
 |
 |
| Parameter | Plot |
|---|---|
| CZT HV Monitor | 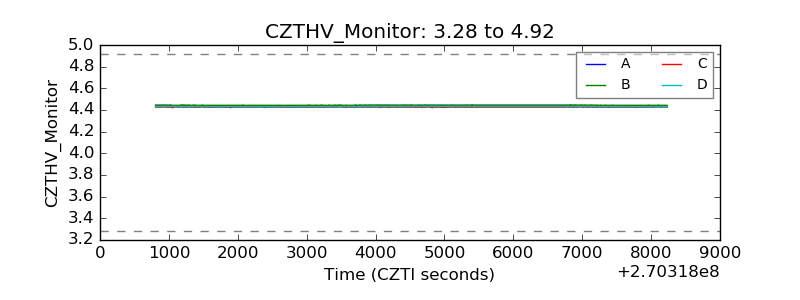 |
| D_VDD | 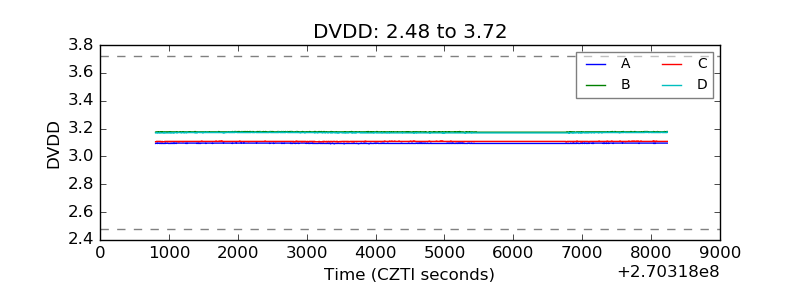 |
| Temperature 1 | 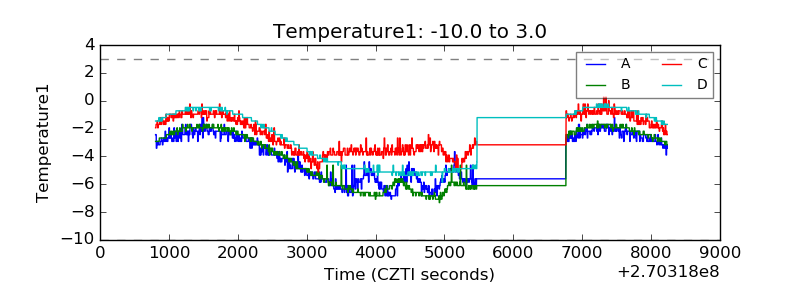 |
| Veto HV Monitor | 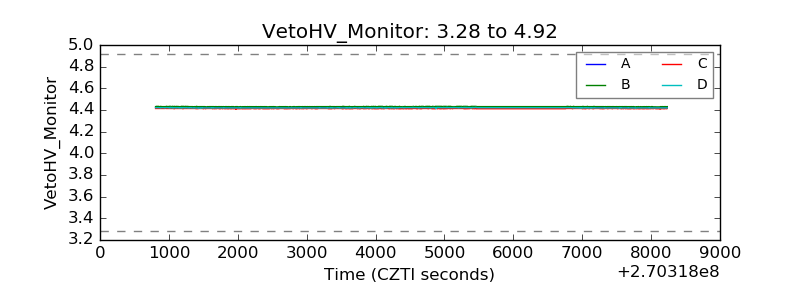 |
| Veto LLD | 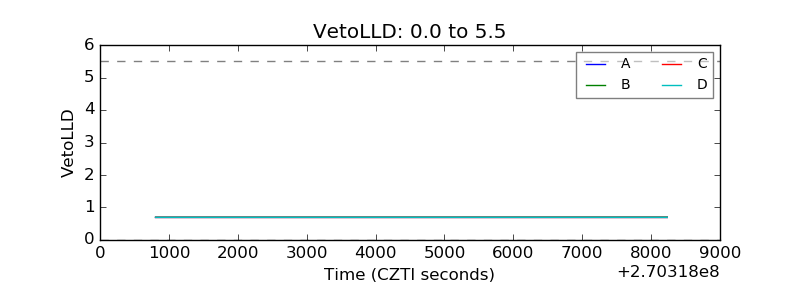 |
| Alpha Counter | 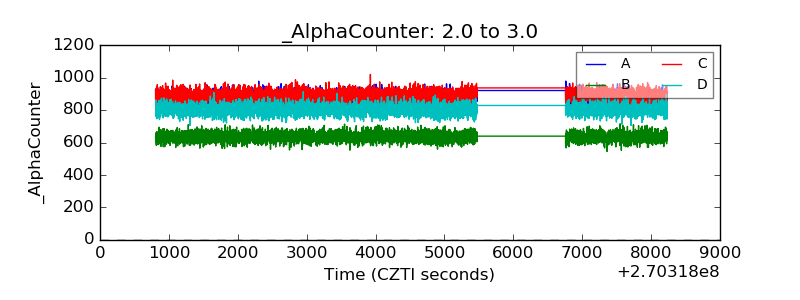 |
| _CPM_Rate |  |
| CZT Counter |  |
| +2.5 Volts monitor |  |
| +5 Volts monitor |  |
| _ROLL_ROT | 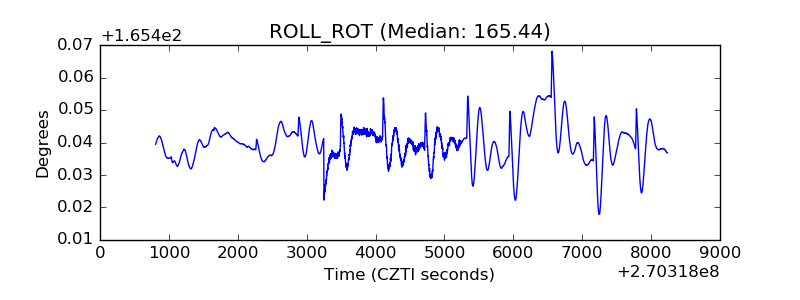 |
| _Roll_DEC | 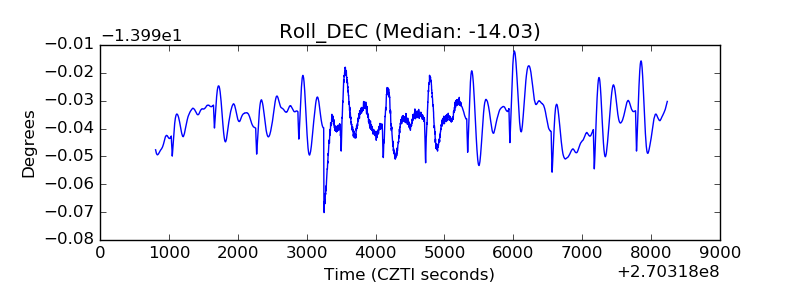 |
| _Roll_RA | 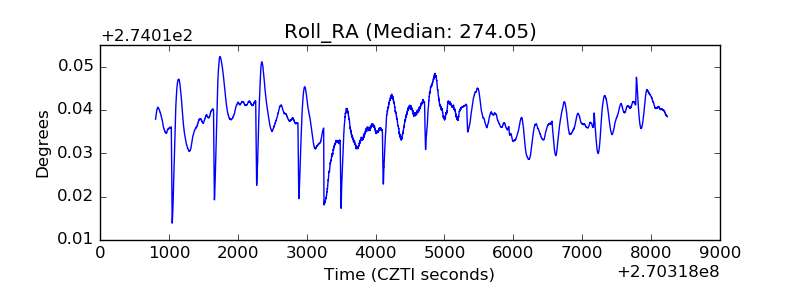 |
| Veto Counter | 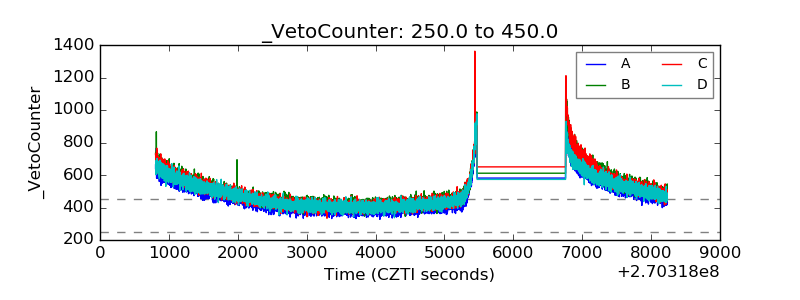 |