| Param | Original file | Final file |
|---|---|---|
| Filename | modeM0/AS1T02_073T01_9000002260cztM0_level2.fits | modeM0/AS1T02_073T01_9000002260cztM0_level2_quad_clean.evt |
| Size (bytes) | 1,992,153,600 | 1,800,656,640 |
| Size | 1.9 GB | 1.7 GB |
| Events in quadrant A | 12,156,378 | 10,561,070 |
| Events in quadrant B | 11,735,756 | 10,743,620 |
| Events in quadrant C | 12,079,316 | 10,177,212 |
| Events in quadrant D | 10,266,044 | 8,960,980 |
| Mode SS | |||
|---|---|---|---|
| Quadrant | BADHDUFLAG | Total packets | Discarded packets |
| A | 0 | 4190 | 0 |
| B | 0 | 4190 | 0 |
| C | 0 | 4190 | 0 |
| D | 0 | 4190 | 0 |
| Mode M0 | |||
|---|---|---|---|
| Quadrant | BADHDUFLAG | Total packets | Discarded packets |
| A | 0 | 439092 | 0 |
| B | 0 | 434781 | 0 |
| C | 0 | 441334 | 0 |
| D | 0 | 527786 | 0 |
| Mode M9 | |||
|---|---|---|---|
| Quadrant | BADHDUFLAG | Total packets | Discarded packets |
| A | 0 | 340 | 0 |
| B | 0 | 340 | 0 |
| C | 0 | 340 | 0 |
| D | 0 | 341 | 0 |
| Quadrant | Total seconds | Saturated seconds | Saturation percentage |
|---|---|---|---|
| A | 205716 | 4027 | 1.957553% |
| B | 205716 | 3042 | 1.478738% |
| C | 205716 | 2081 | 1.011589% |
| D | 205716 | 11468 | 5.574676% |
Noise dominated data is calculated using 1-second bins in cleaned event files. If a bin has >2000 counts, and if more than 50% of those come from <1% of pixels, then it is considered to be noise-dominated and hence unusable.
| Quadrant | # 1 sec bins | Bins with >0 counts | Bins with >2000 counts | High rate bins dominated by noise | Noise dominated (total time) | Noise dominated (detector-on time) | Marked lightcurve |
|---|---|---|---|---|---|---|---|
| A | 244642 | 205682 | 0 | 0 | 0.00% | 0.00% | 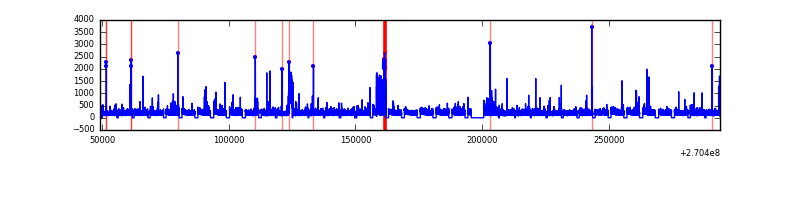 |
| B | 244642 | 205690 | 0 | 0 | 0.00% | 0.00% |  |
| C | 244642 | 205696 | 0 | 0 | 0.00% | 0.00% |  |
| D | 244642 | 205638 | 0 | 0 | 0.00% | 0.00% |  |
Top three noisy pixels from each quadrant. If the there are fewer than three noisy pixels in the level2.evt file, extra rows are filled as -1
| Pixel properties | Quadrant properties | ||||||
|---|---|---|---|---|---|---|---|
| Quadrant | DetID | PixID | Counts | Sigma | Mean | Median | Sigma |
| A | 0 | 29 | 11749 | 11.34 | 3162 | 2960 | 775.2 |
| A | 7 | 110 | 9568 | 8.52 | 3162 | 2960 | 775.2 |
| A | 15 | 236 | 9110 | 7.93 | 3162 | 2960 | 775.2 |
| B | 2 | 9 | 9518 | 10.83 | 3097 | 2951 | 606.1 |
| B | 2 | 8 | 7996 | 8.32 | 3097 | 2951 | 606.1 |
| B | 5 | 128 | 7623 | 7.71 | 3097 | 2951 | 606.1 |
| C | 1 | 80 | 9110 | 7.55 | 3187 | 2970 | 813.6 |
| C | 1 | 81 | 9034 | 7.45 | 3187 | 2970 | 813.6 |
| C | 12 | 241 | 8343 | 6.6 | 3187 | 2970 | 813.6 |
| D | 6 | 231 | 7332 | 5.95 | 2933 | 2668 | 783.5 |
| D | 3 | 14 | 7254 | 5.85 | 2933 | 2668 | 783.5 |
| D | 10 | 189 | 7103 | 5.66 | 2933 | 2668 | 783.5 |
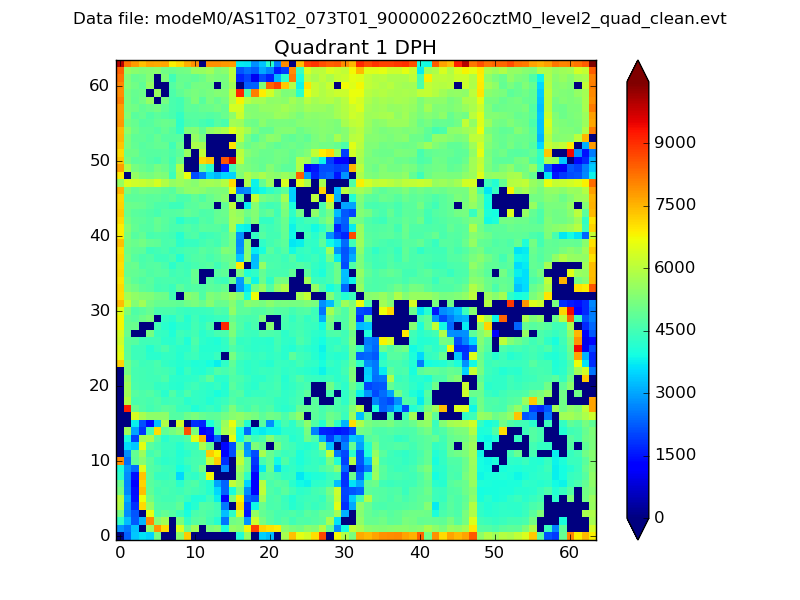
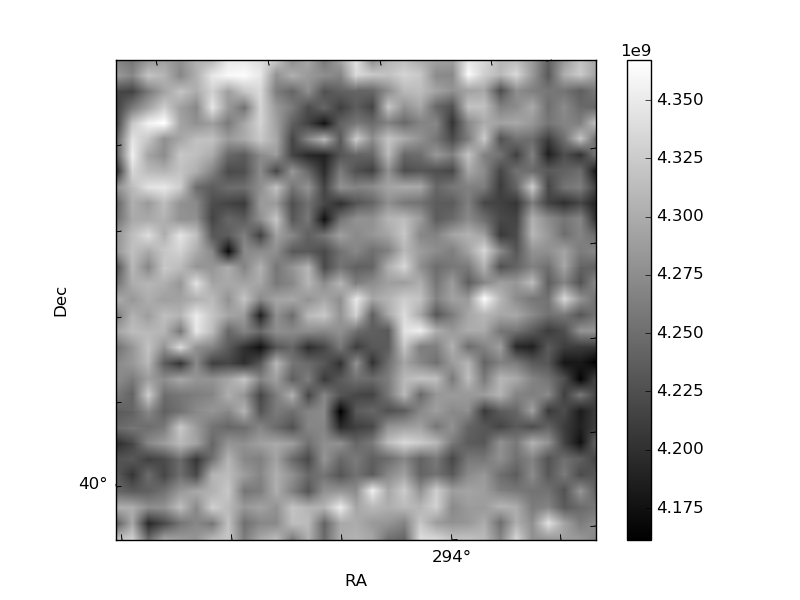
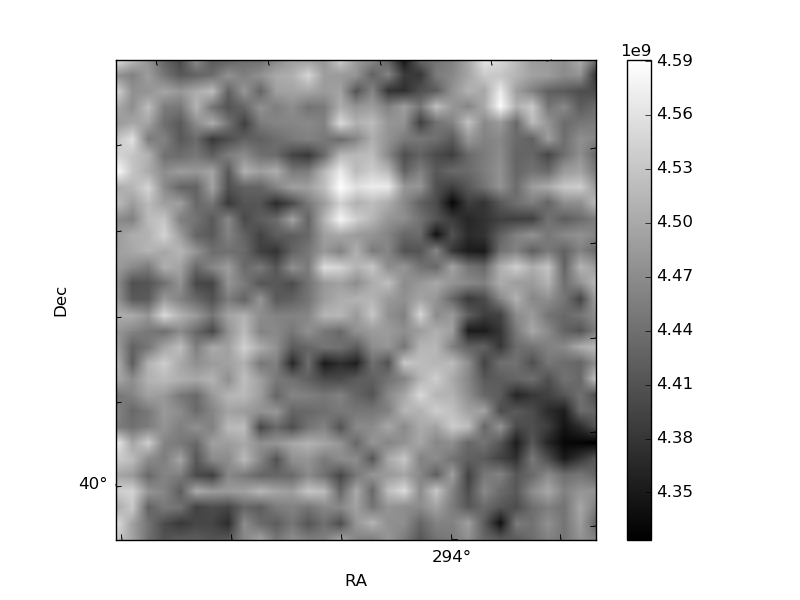
Histogram calculated using DETX and DETY for each event in the final _common_clean file
| Quadrant A |  |
 |
Quadrant B |
|---|---|---|---|
| Quadrant D | 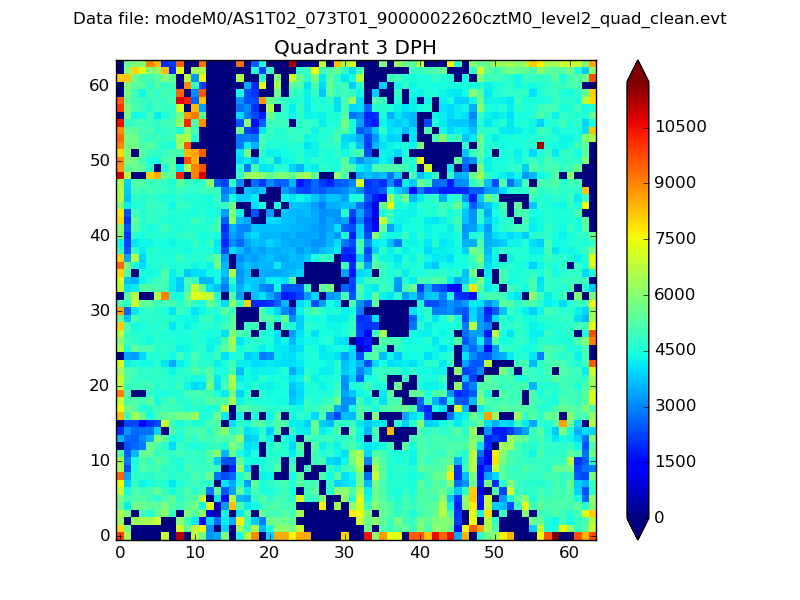 |
 |
Quadrant C |
| Plot type | Count rate plots | Images |
|---|---|---|
| Comparison with Poisson distribution Blue bars denote a histogram of data divided into 1 sec bins. Red curve is a Poisson curve with rate = median count rate of data. |
 |
 |
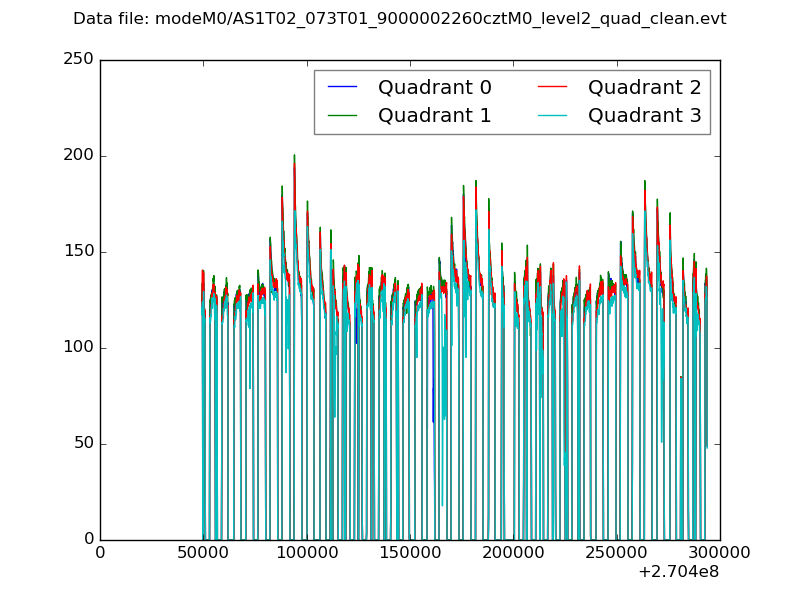
| Quadrant-wise count rates Data is divided into 100 sec bins |
 |
|
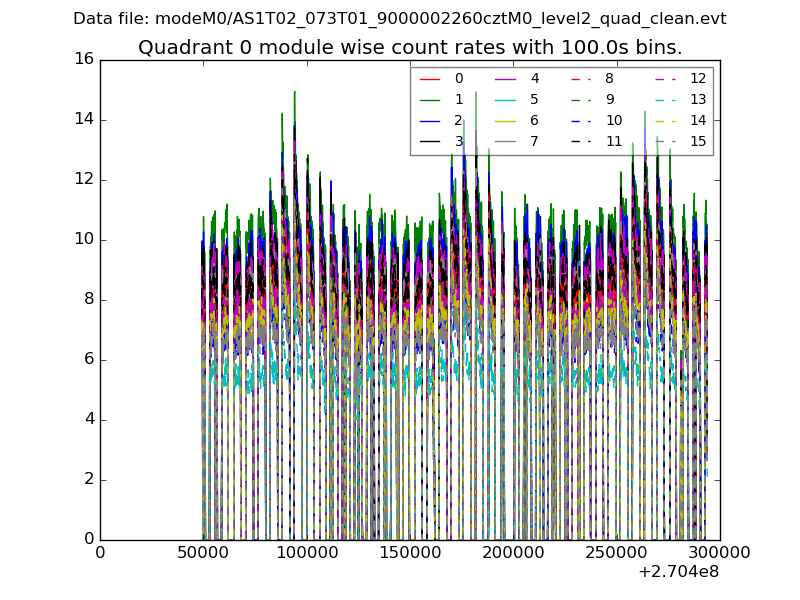
| Module-wise count rates for Quadrant A Data is divided into 100 sec bins |
 |
 |
| Module-wise count rates for Quadrant B Data is divided into 100 sec bins |
 |
 |
| Module-wise count rates for Quadrant C Data is divided into 100 sec bins |
 |
 |
| Module-wise count rates for Quadrant D Data is divided into 100 sec bins |
 |
 |
| Parameter | Plot |
|---|---|
| CZT HV Monitor |  |
| D_VDD | 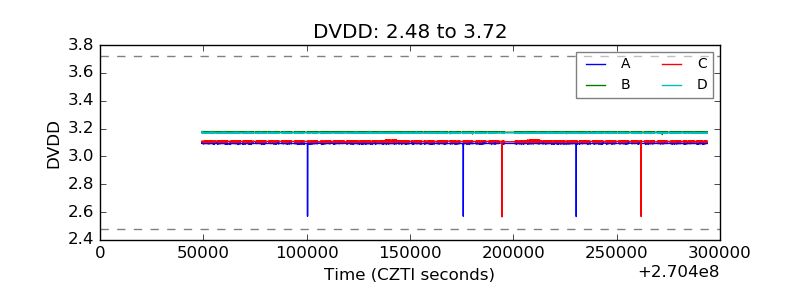 |
| Temperature 1 | 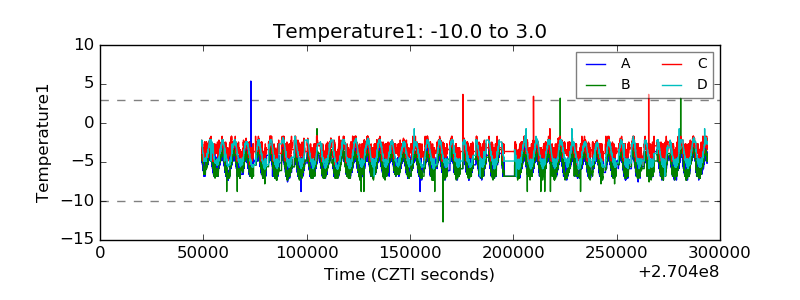 |
| Veto HV Monitor |  |
| Veto LLD |  |
| Alpha Counter | 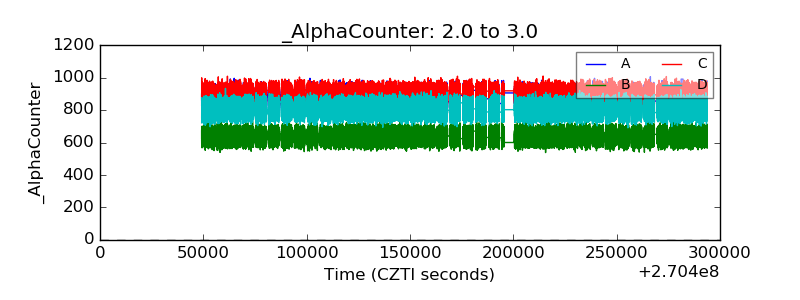 |
| _CPM_Rate |  |
| CZT Counter |  |
| +2.5 Volts monitor |  |
| +5 Volts monitor | 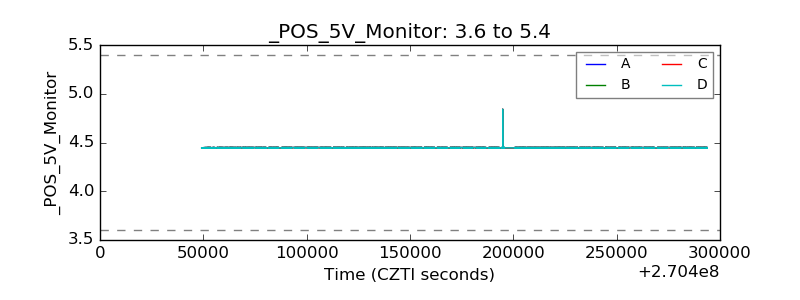 |
| _ROLL_ROT |  |
| _Roll_DEC |  |
| _Roll_RA | 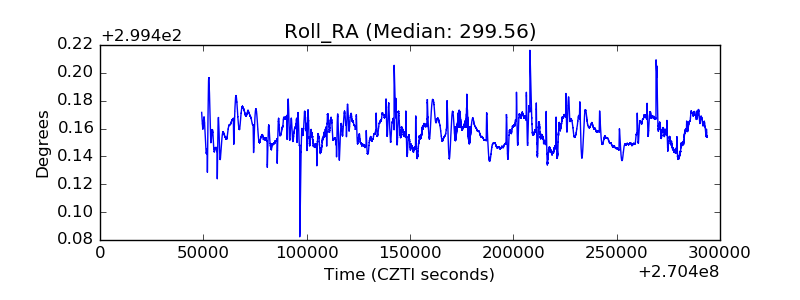 |
| Veto Counter |  |