| Param | Original file | Final file |
|---|---|---|
| Filename | modeM0/AS1T02_073T01_9000002260_15305cztM0_level2.evt | modeM0/AS1T02_073T01_9000002260_15305cztM0_level2_quad_clean.evt |
| Size (bytes) | 141,747,840 | 28,120,320 |
| Size | 135.2 MB | 26.8 MB |
| Events in quadrant A | 999,339 | 173,928 |
| Events in quadrant B | 1,092,393 | 176,037 |
| Events in quadrant C | 1,058,103 | 177,292 |
| Events in quadrant D | 996,468 | 170,444 |
| Mode SS | |||
|---|---|---|---|
| Quadrant | BADHDUFLAG | Total packets | Discarded packets |
| A | 0 | 44 | 0 |
| B | 0 | 44 | 0 |
| C | 0 | 44 | 0 |
| D | 0 | 44 | 0 |
| Mode M0 | |||
|---|---|---|---|
| Quadrant | BADHDUFLAG | Total packets | Discarded packets |
| A | 0 | 4490 | 2 |
| B | 0 | 4679 | 1 |
| C | 0 | 4534 | 1 |
| D | 0 | 4586 | 1 |
| Mode M9 | |||
|---|---|---|---|
| Quadrant | BADHDUFLAG | Total packets | Discarded packets |
| A | 0 | 3 | 0 |
| B | 0 | 3 | 0 |
| C | 0 | 3 | 0 |
| D | 0 | 3 | 0 |
| Quadrant | Total seconds | Saturated seconds | Saturation percentage |
|---|---|---|---|
| A | 2116 | 133 | 6.285444% |
| B | 2116 | 148 | 6.994329% |
| C | 2116 | 95 | 4.489603% |
| D | 2116 | 108 | 5.103970% |
Noise dominated data is calculated using 1-second bins in cleaned event files. If a bin has >2000 counts, and if more than 50% of those come from <1% of pixels, then it is considered to be noise-dominated and hence unusable.
| Quadrant | # 1 sec bins | Bins with >0 counts | Bins with >2000 counts | High rate bins dominated by noise | Noise dominated (total time) | Noise dominated (detector-on time) | Marked lightcurve |
|---|---|---|---|---|---|---|---|
| A | 2432 | 2117 | 0 | 0 | 0.00% | 0.00% | 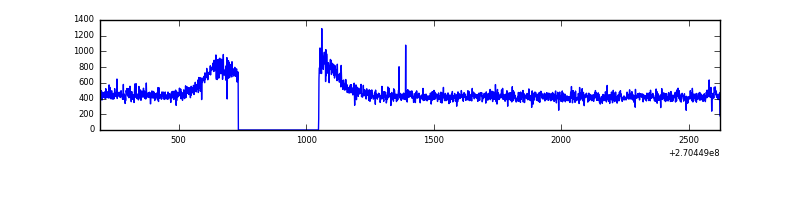 |
| B | 2432 | 2117 | 1 | 1 | 0.04% | 0.05% | 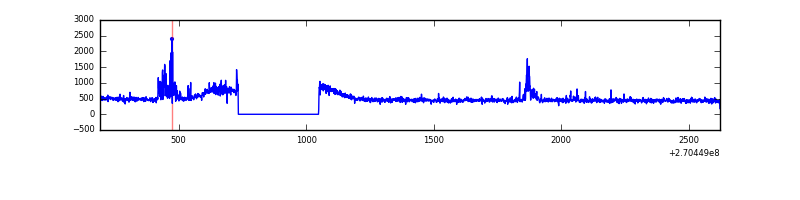 |
| C | 2432 | 2117 | 0 | 0 | 0.00% | 0.00% | 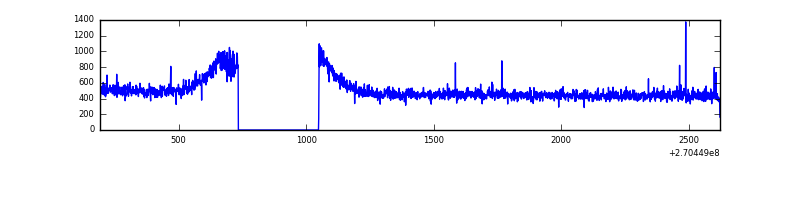 |
| D | 2432 | 2117 | 6 | 6 | 0.25% | 0.28% | 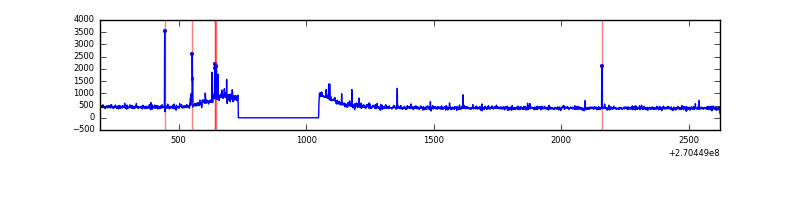 |
Top three noisy pixels from each quadrant. If the there are fewer than three noisy pixels in the level2.evt file, extra rows are filled as -1
| Pixel properties | Quadrant properties | ||||||
|---|---|---|---|---|---|---|---|
| Quadrant | DetID | PixID | Counts | Sigma | Mean | Median | Sigma |
| A | 9 | 143 | 2447 | 39.86 | 258 | 250 | 55.1 |
| A | 0 | 226 | 2359 | 38.27 | 258 | 250 | 55.1 |
| A | 7 | 32 | 1982 | 31.43 | 258 | 250 | 55.1 |
| B | 0 | 197 | 33003 | 613.97 | 260 | 253 | 53.3 |
| B | 10 | 16 | 23385 | 433.66 | 260 | 253 | 53.3 |
| B | 0 | 189 | 8931 | 162.69 | 260 | 253 | 53.3 |
| C | 3 | 233 | 57567 | 941.58 | 254 | 254 | 60.9 |
| C | 4 | 254 | 10409 | 166.83 | 254 | 254 | 60.9 |
| C | 13 | 61 | 1879 | 26.7 | 254 | 254 | 60.9 |
| D | 7 | 38 | 31563 | 499.09 | 251 | 242 | 62.8 |
| D | 2 | 234 | 8032 | 124.13 | 251 | 242 | 62.8 |
| D | 13 | 172 | 7357 | 113.38 | 251 | 242 | 62.8 |
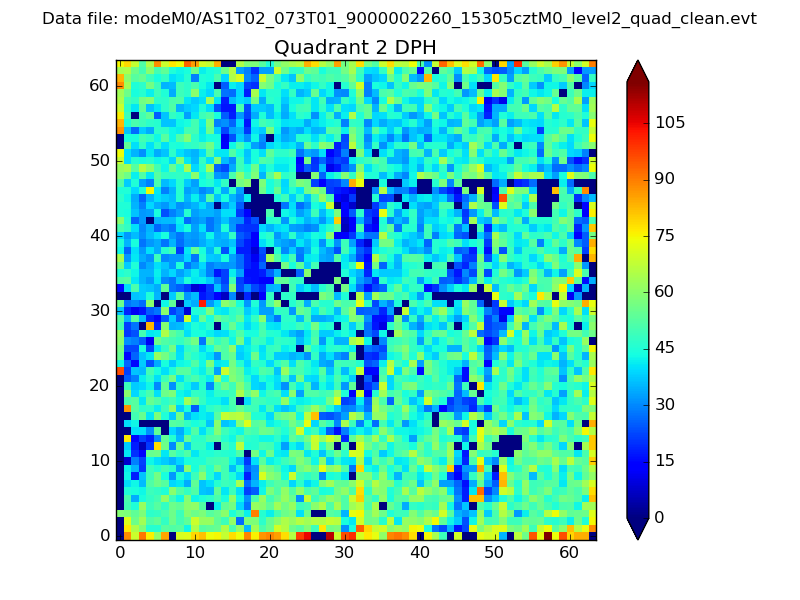
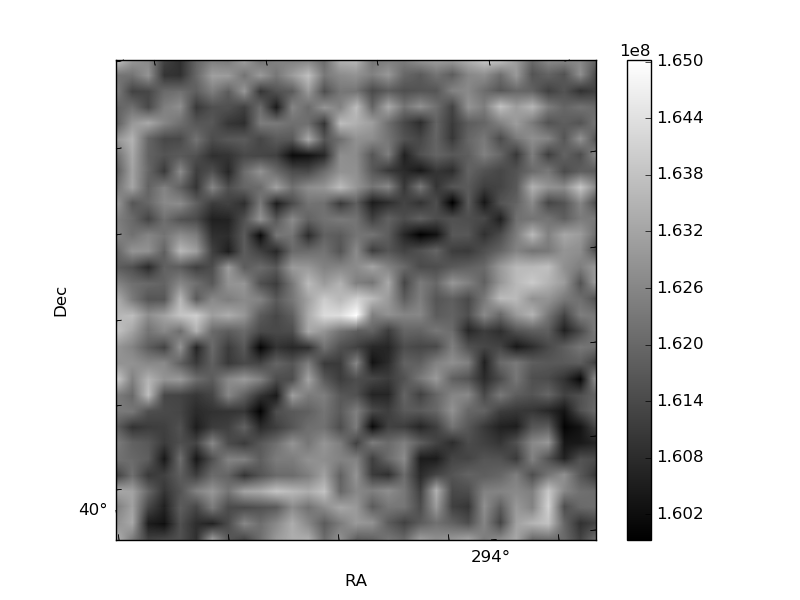
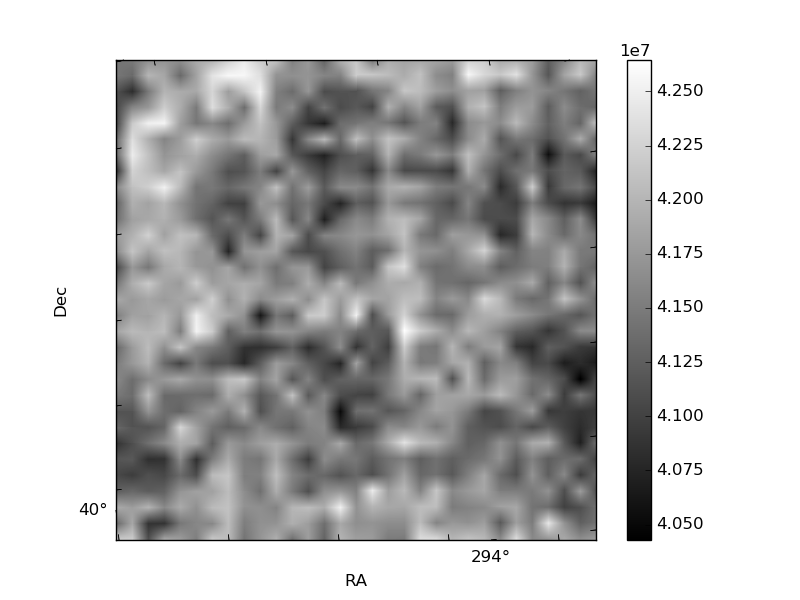
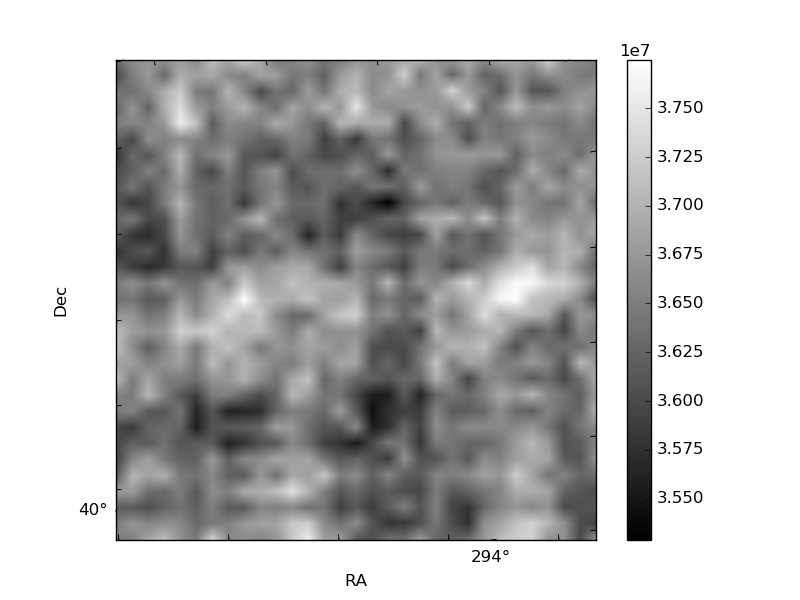
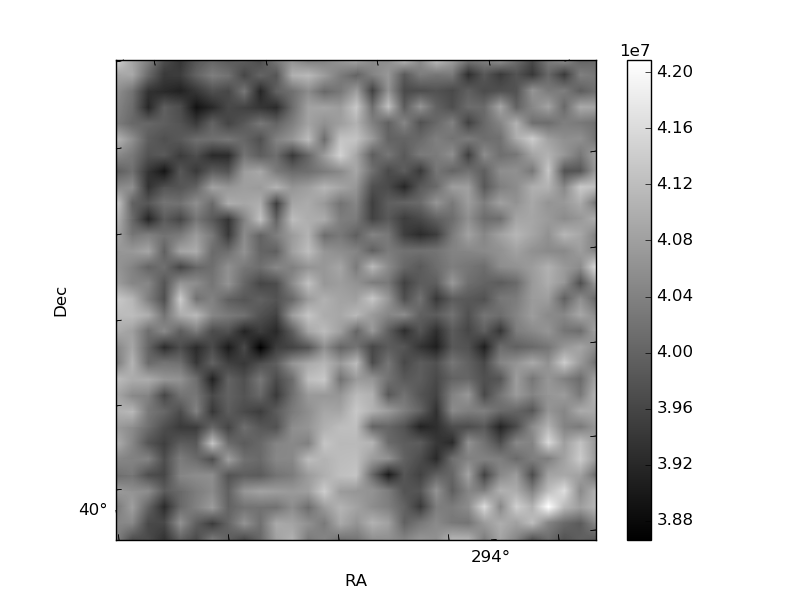
Histogram calculated using DETX and DETY for each event in the final _common_clean file
| Quadrant A | 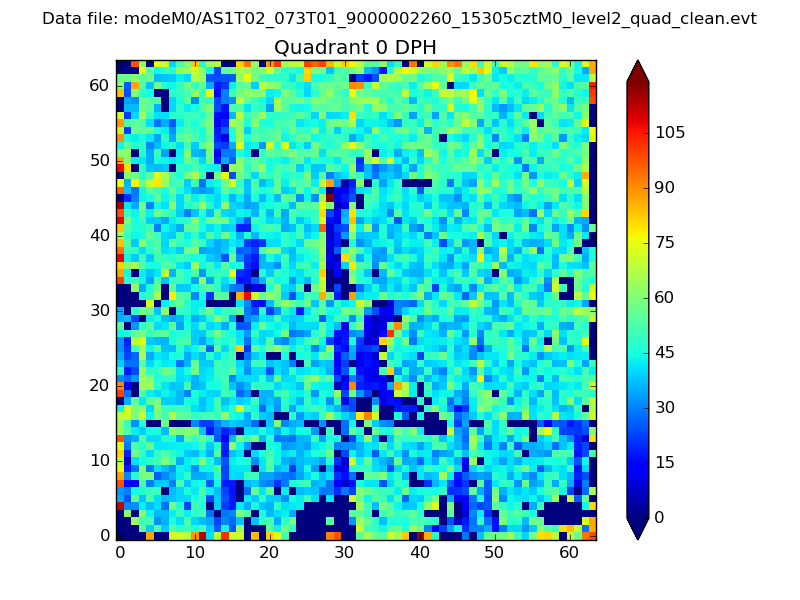 |
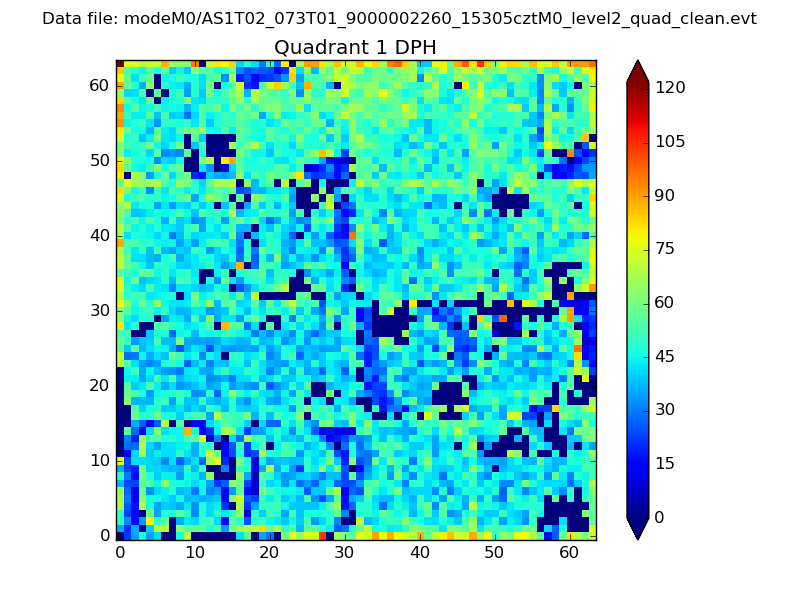 |
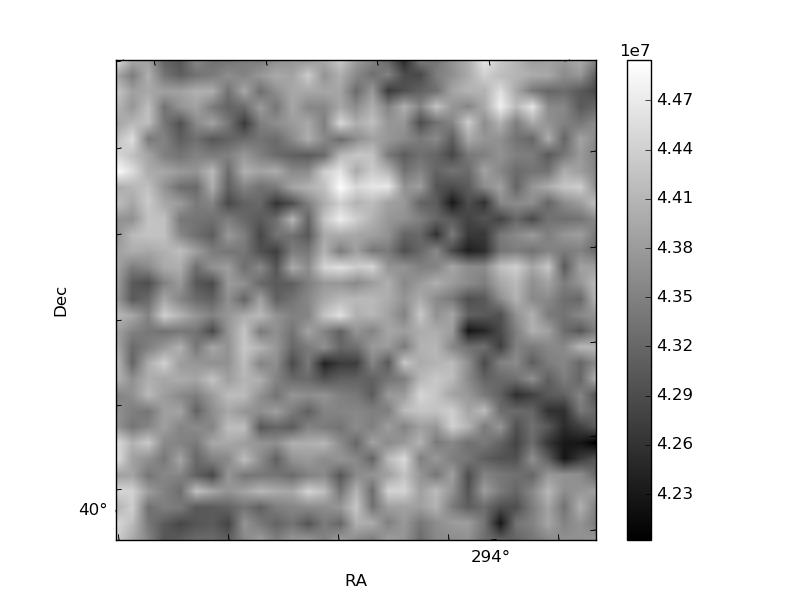
Quadrant B |
|---|---|---|---|
| Quadrant D | 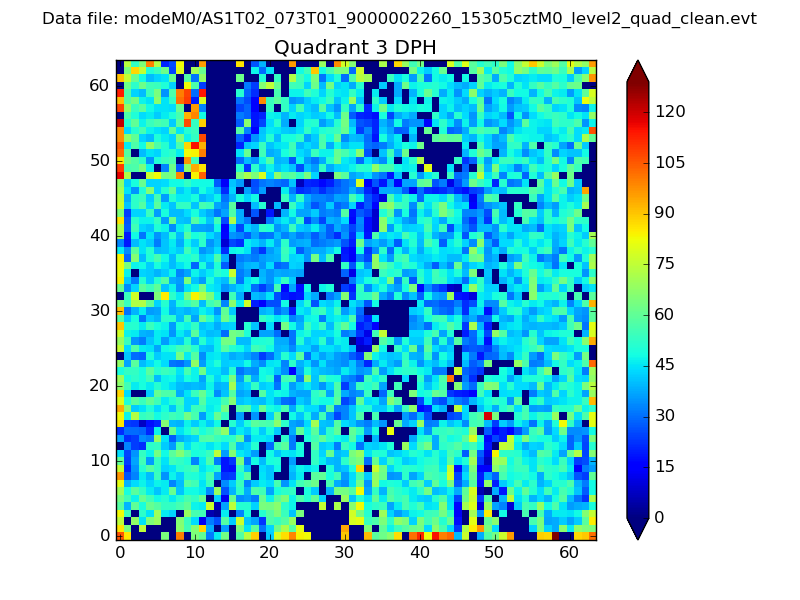 |
 |
Quadrant C |
| Plot type | Count rate plots | Images |
|---|---|---|
| Comparison with Poisson distribution Blue bars denote a histogram of data divided into 1 sec bins. Red curve is a Poisson curve with rate = median count rate of data. |
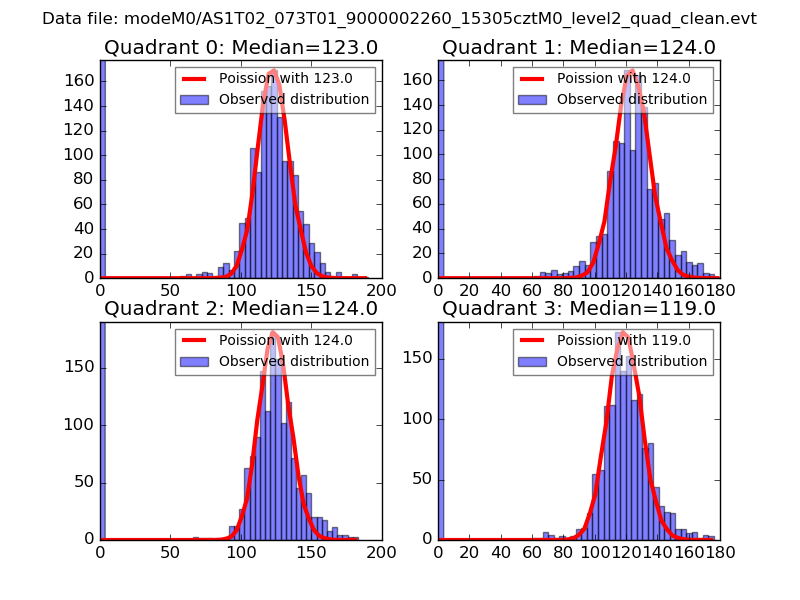 |
 |
| Quadrant-wise count rates Data is divided into 100 sec bins |
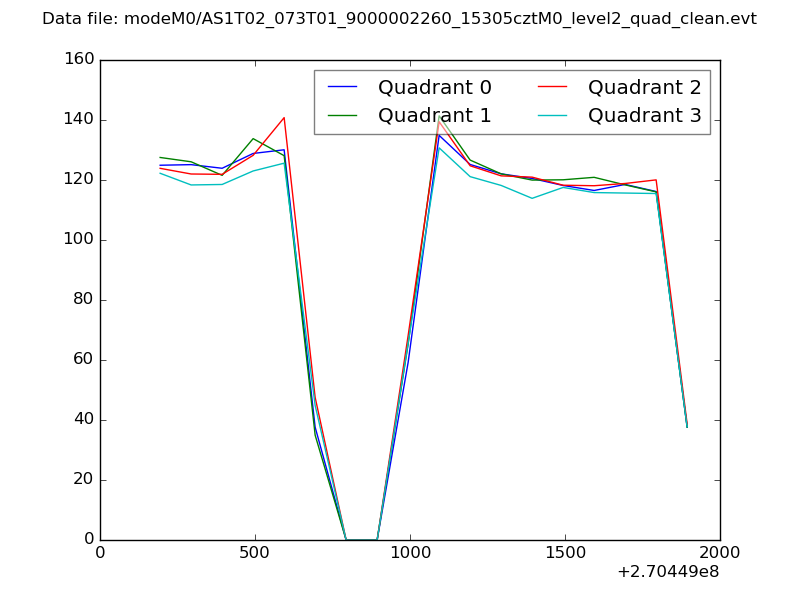 |
|
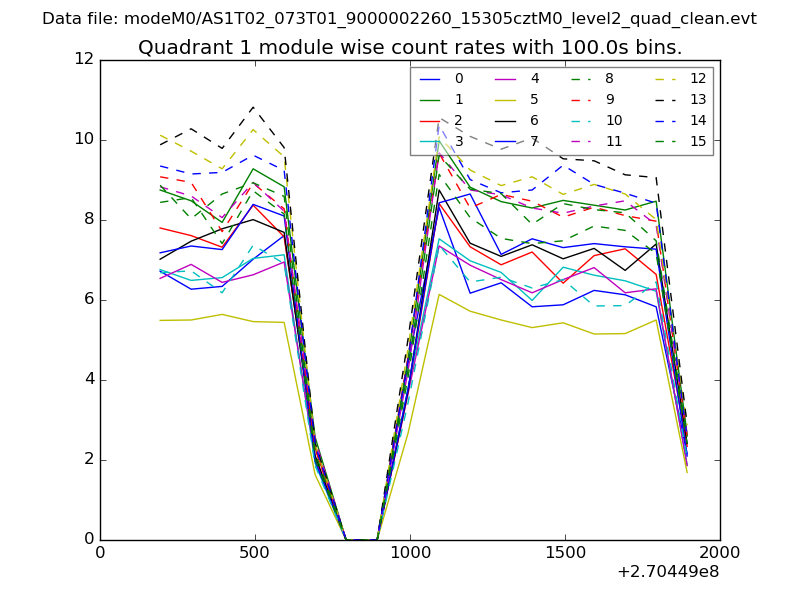
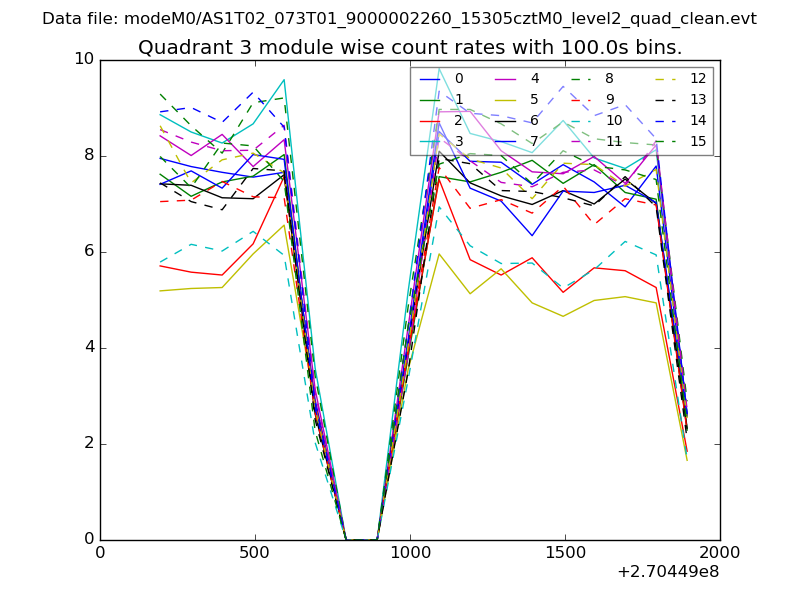
| Module-wise count rates for Quadrant A Data is divided into 100 sec bins |
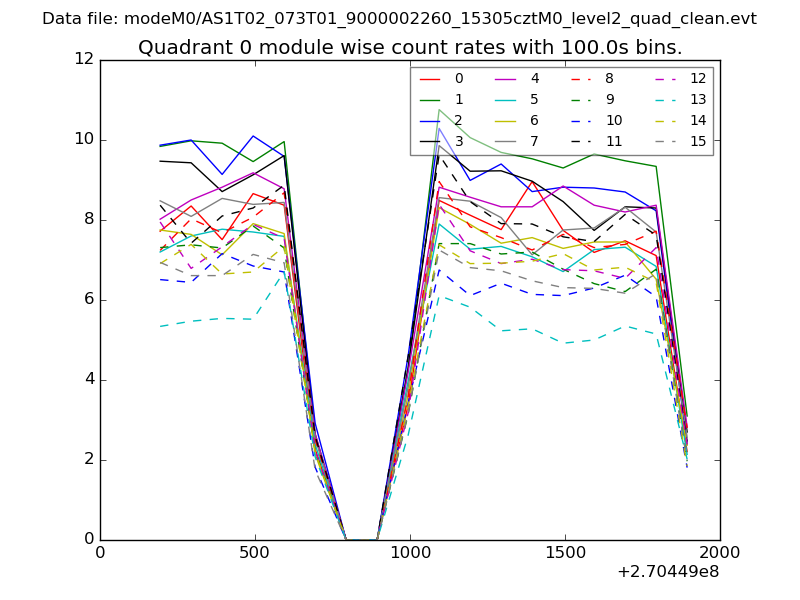 |
 |
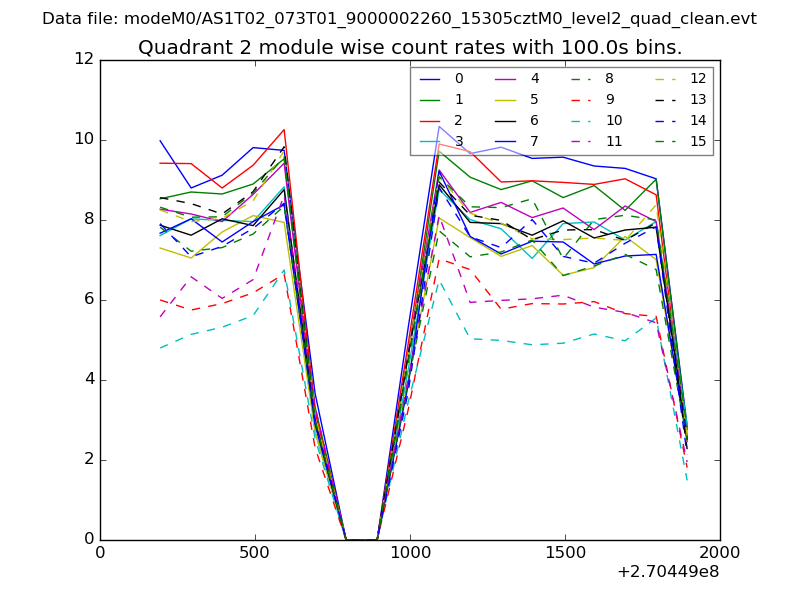
| Module-wise count rates for Quadrant B Data is divided into 100 sec bins |
 |
 |
| Module-wise count rates for Quadrant C Data is divided into 100 sec bins |
 |
 |
| Module-wise count rates for Quadrant D Data is divided into 100 sec bins |
 |
 |
| Parameter | Plot |
|---|---|
| CZT HV Monitor | 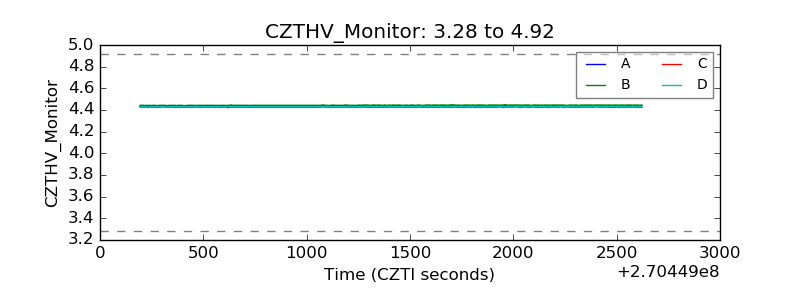 |
| D_VDD | 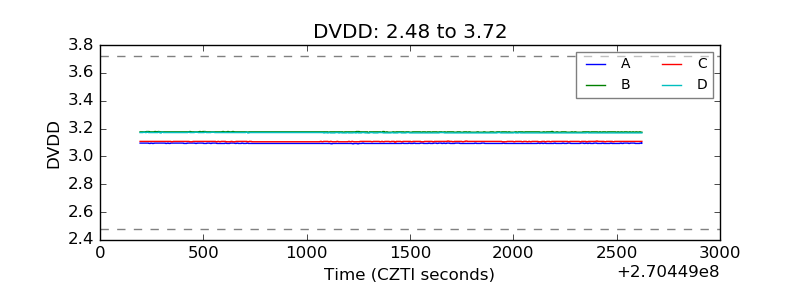 |
| Temperature 1 | 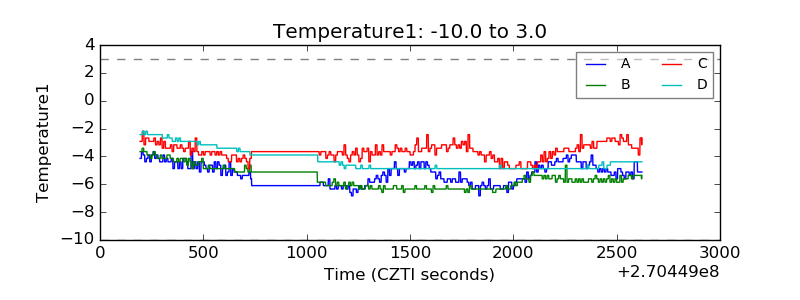 |
| Veto HV Monitor | 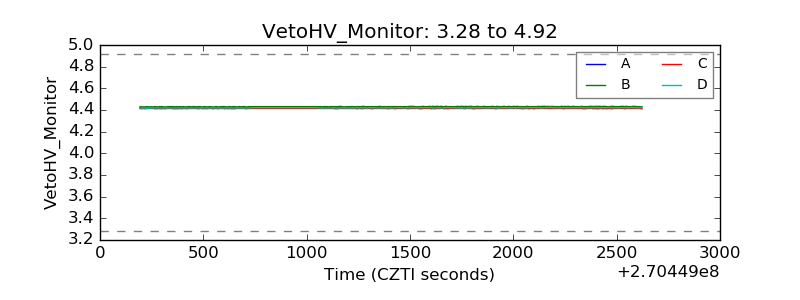 |
| Veto LLD | 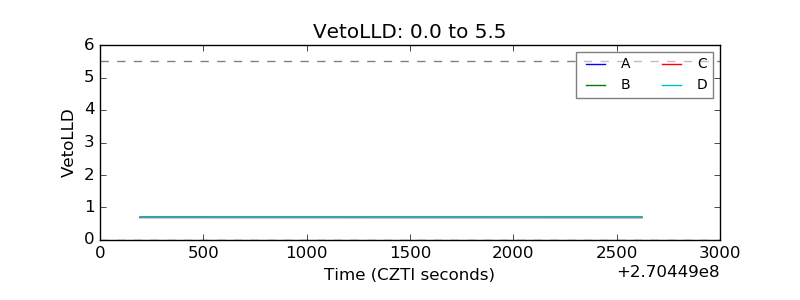 |
| Alpha Counter | 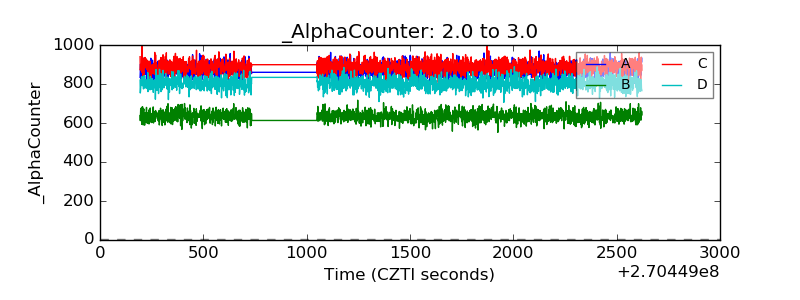 |
| _CPM_Rate | 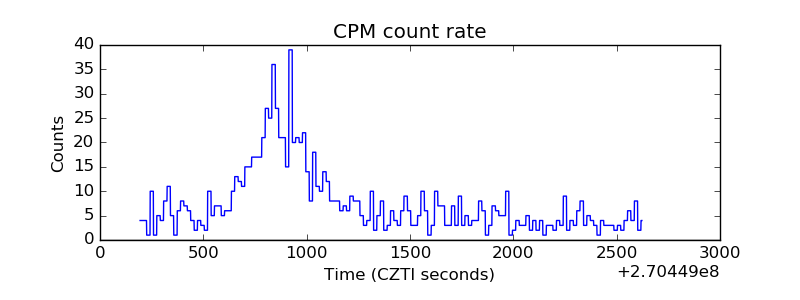 |
| CZT Counter | 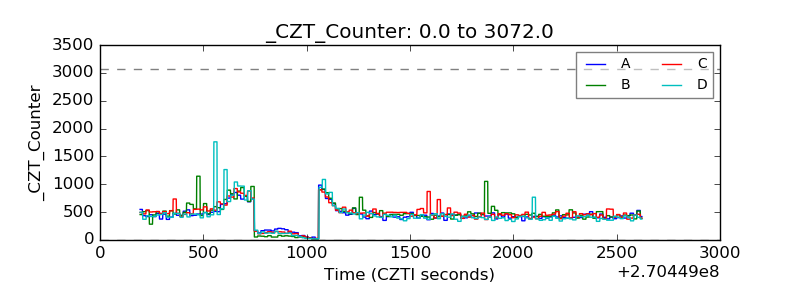 |
| +2.5 Volts monitor |  |
| +5 Volts monitor | 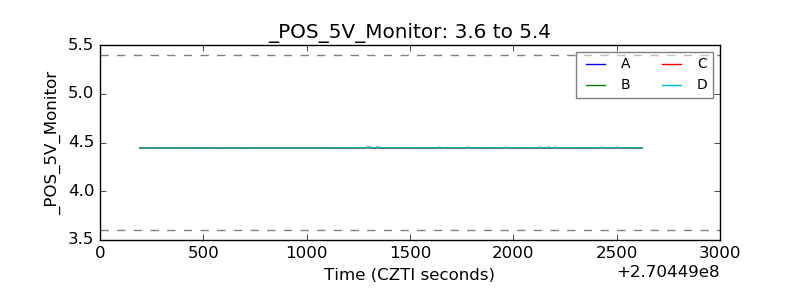 |
| _ROLL_ROT | 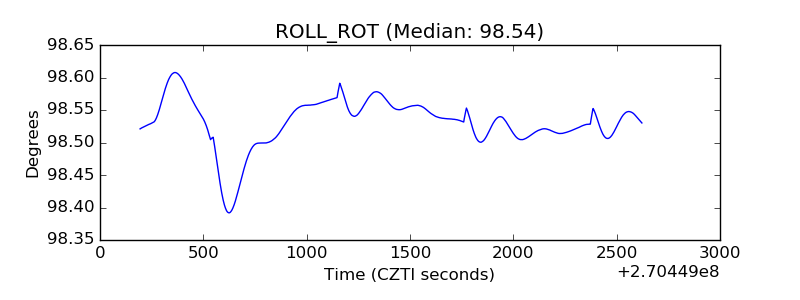 |
| _Roll_DEC | 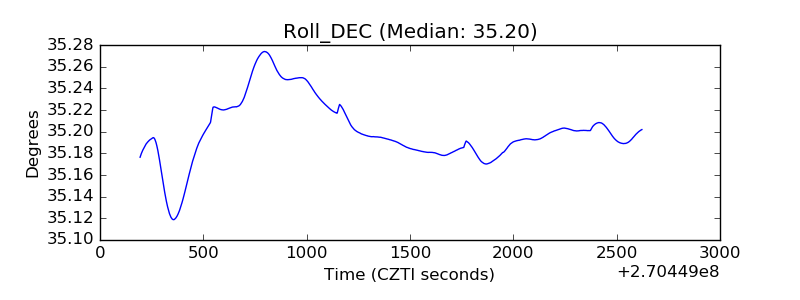 |
| _Roll_RA | 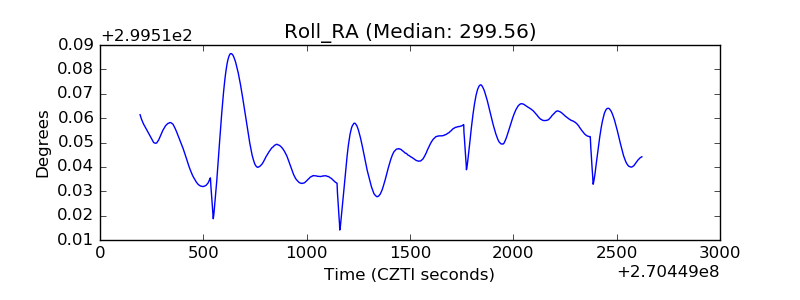 |
| Veto Counter | 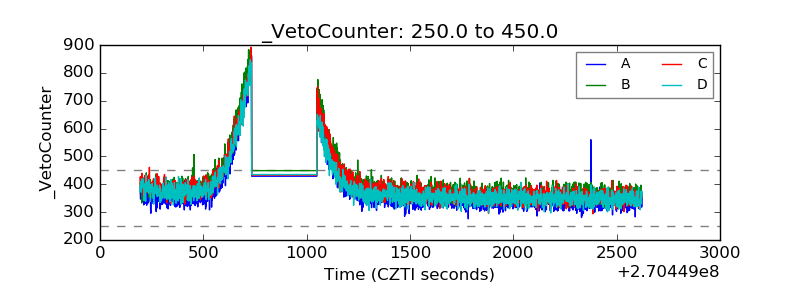 |