| Param | Original file | Final file |
|---|---|---|
| Filename | modeM0/AS1T02_073T01_9000002260_15307cztM0_level2.evt | modeM0/AS1T02_073T01_9000002260_15307cztM0_level2_quad_clean.evt |
| Size (bytes) | 813,732,480 | 139,242,240 |
| Size | 776.0 MB | 132.8 MB |
| Events in quadrant A | 5,847,982 | 846,998 |
| Events in quadrant B | 5,995,533 | 855,725 |
| Events in quadrant C | 6,110,999 | 832,908 |
| Events in quadrant D | 5,831,550 | 806,196 |
| Mode SS | |||
|---|---|---|---|
| Quadrant | BADHDUFLAG | Total packets | Discarded packets |
| A | 0 | 256 | 0 |
| B | 0 | 256 | 0 |
| C | 0 | 256 | 0 |
| D | 0 | 256 | 0 |
| Mode M0 | |||
|---|---|---|---|
| Quadrant | BADHDUFLAG | Total packets | Discarded packets |
| A | 0 | 25786 | 3 |
| B | 0 | 25985 | 2 |
| C | 0 | 26105 | 2 |
| D | 0 | 26506 | 2 |
| Mode M9 | |||
|---|---|---|---|
| Quadrant | BADHDUFLAG | Total packets | Discarded packets |
| A | 0 | 13 | 0 |
| B | 0 | 13 | 0 |
| C | 0 | 13 | 0 |
| D | 0 | 13 | 0 |
| Quadrant | Total seconds | Saturated seconds | Saturation percentage |
|---|---|---|---|
| A | 12663 | 128 | 1.010819% |
| B | 12663 | 156 | 1.231936% |
| C | 12663 | 108 | 0.852878% |
| D | 12663 | 137 | 1.081892% |
Noise dominated data is calculated using 1-second bins in cleaned event files. If a bin has >2000 counts, and if more than 50% of those come from <1% of pixels, then it is considered to be noise-dominated and hence unusable.
| Quadrant | # 1 sec bins | Bins with >0 counts | Bins with >2000 counts | High rate bins dominated by noise | Noise dominated (total time) | Noise dominated (detector-on time) | Marked lightcurve |
|---|---|---|---|---|---|---|---|
| A | 13899 | 12664 | 6 | 6 | 0.04% | 0.05% | 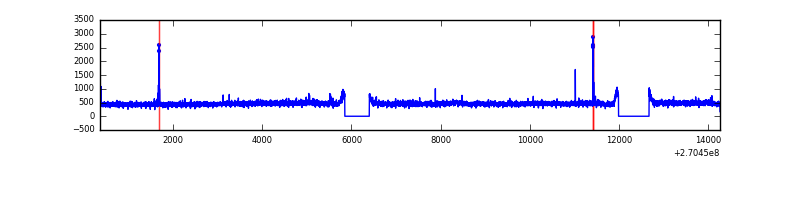 |
| B | 13899 | 12664 | 6 | 6 | 0.04% | 0.05% | 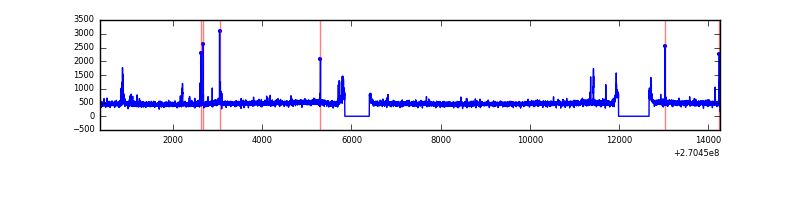 |
| C | 13899 | 12664 | 7 | 7 | 0.05% | 0.06% | 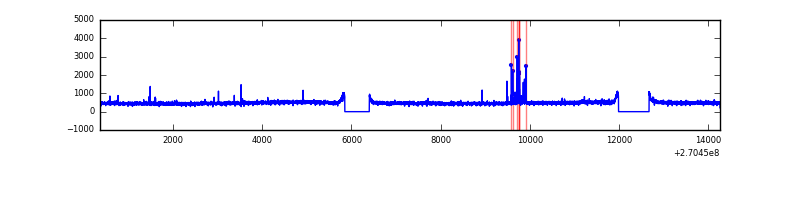 |
| D | 13899 | 12664 | 41 | 41 | 0.29% | 0.32% | 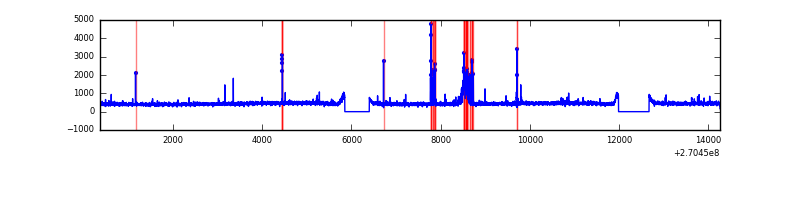 |
Top three noisy pixels from each quadrant. If the there are fewer than three noisy pixels in the level2.evt file, extra rows are filled as -1
| Pixel properties | Quadrant properties | ||||||
|---|---|---|---|---|---|---|---|
| Quadrant | DetID | PixID | Counts | Sigma | Mean | Median | Sigma |
| A | 13 | 252 | 36220 | 114.68 | 1498 | 1463 | 303.1 |
| A | 4 | 2 | 21777 | 67.03 | 1498 | 1463 | 303.1 |
| A | 7 | 32 | 18583 | 56.49 | 1498 | 1463 | 303.1 |
| B | 10 | 16 | 44178 | 147.31 | 1499 | 1461 | 290.0 |
| B | 0 | 189 | 39939 | 132.69 | 1499 | 1461 | 290.0 |
| B | 12 | 111 | 35504 | 117.4 | 1499 | 1461 | 290.0 |
| C | 3 | 233 | 354439 | 1053.57 | 1450 | 1458 | 335.0 |
| C | 4 | 254 | 105537 | 310.65 | 1450 | 1458 | 335.0 |
| C | 13 | 61 | 10449 | 26.84 | 1450 | 1458 | 335.0 |
| D | 2 | 33 | 246912 | 687.94 | 1452 | 1406 | 356.9 |
| D | 10 | 70 | 52531 | 143.26 | 1452 | 1406 | 356.9 |
| D | 2 | 234 | 48276 | 131.34 | 1452 | 1406 | 356.9 |
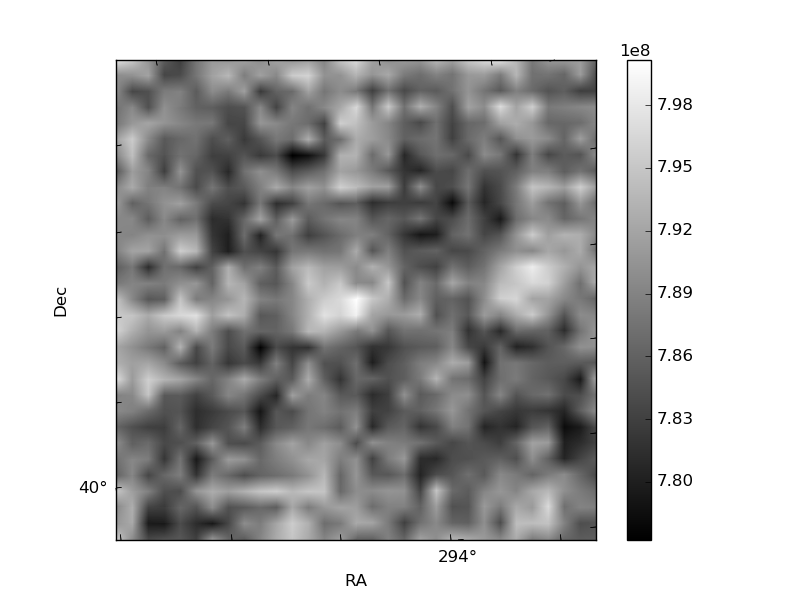
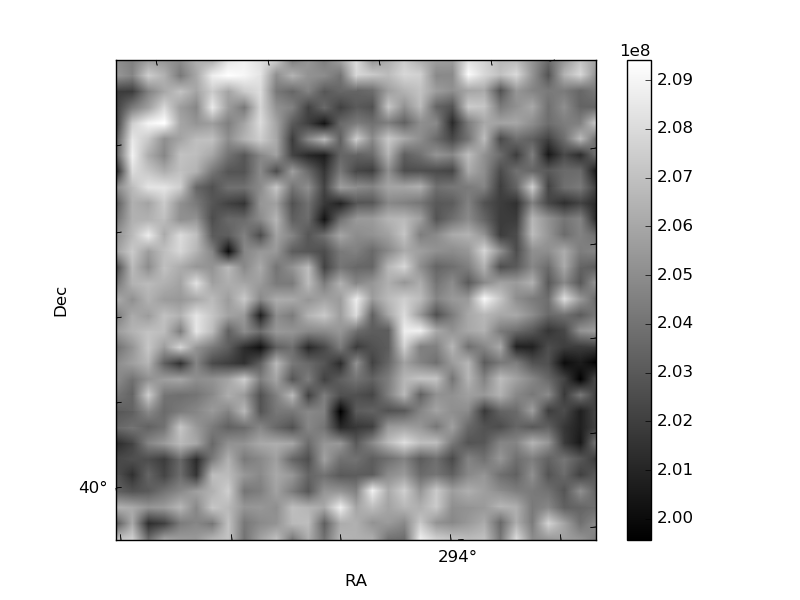
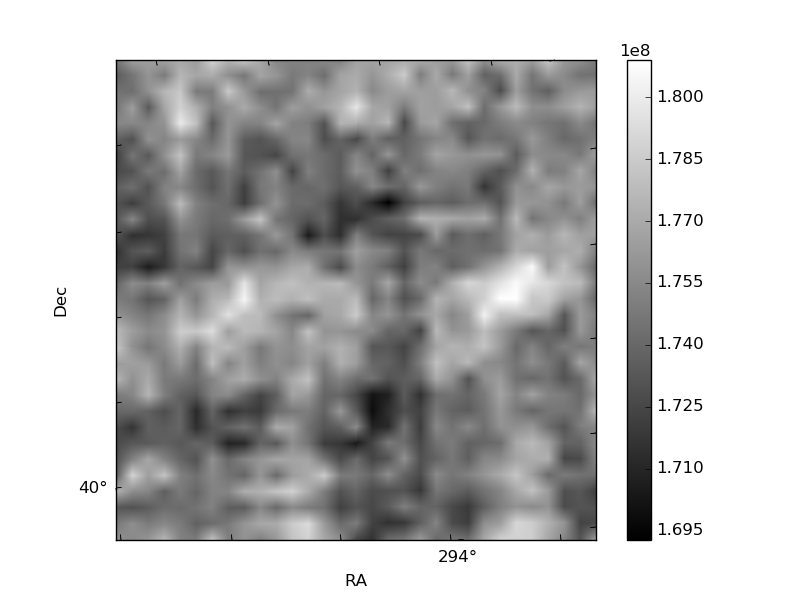
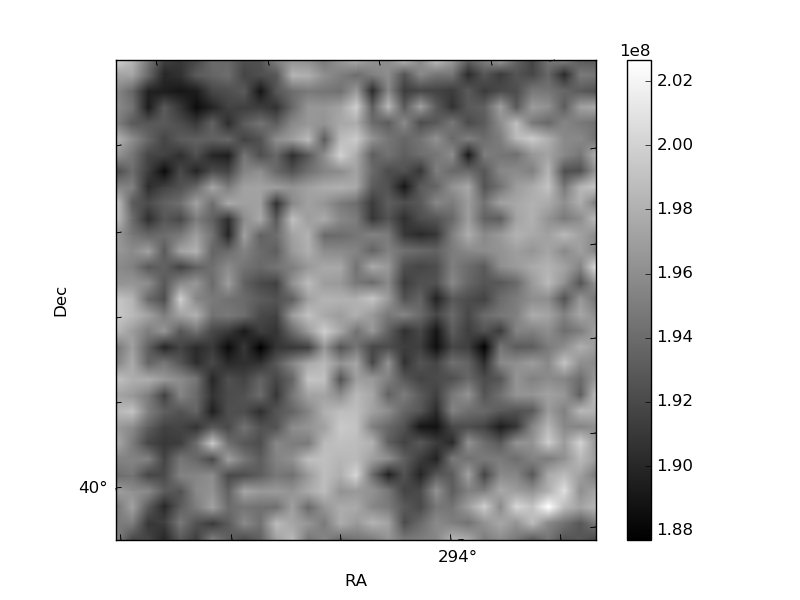
Histogram calculated using DETX and DETY for each event in the final _common_clean file
| Quadrant A | 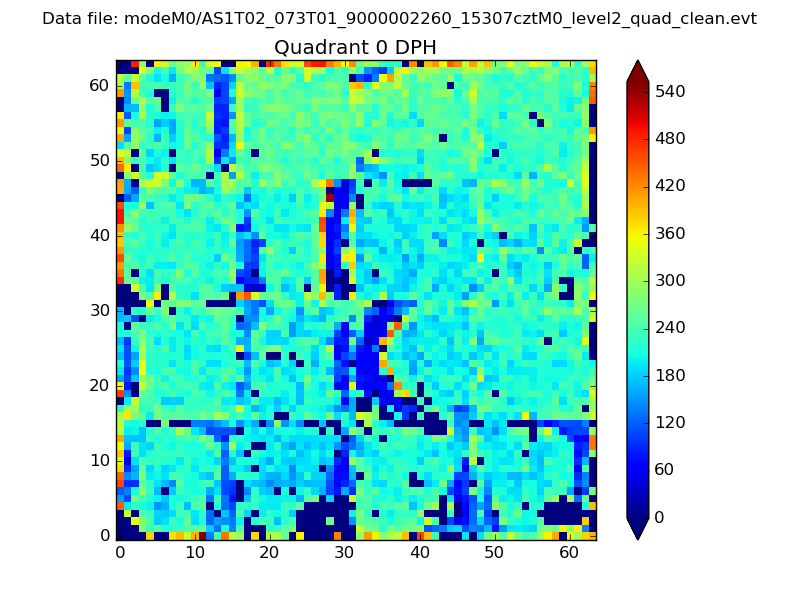 |
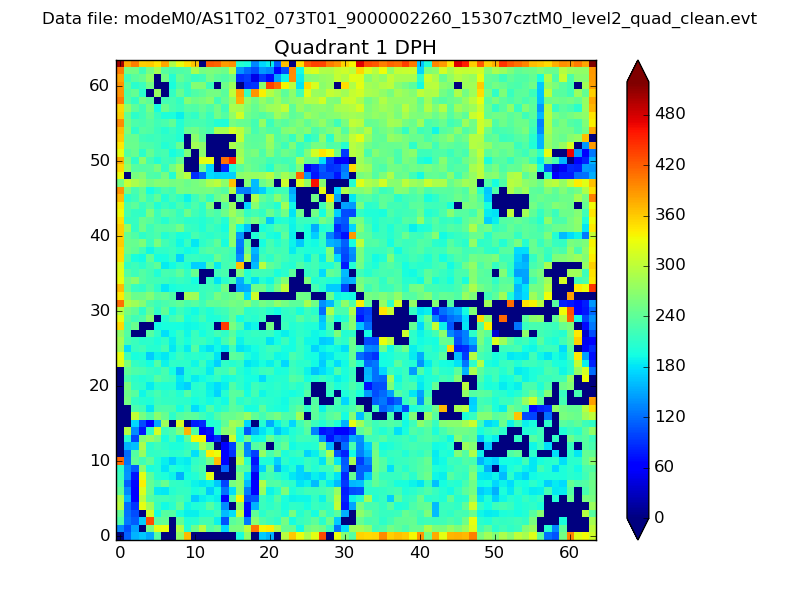 |
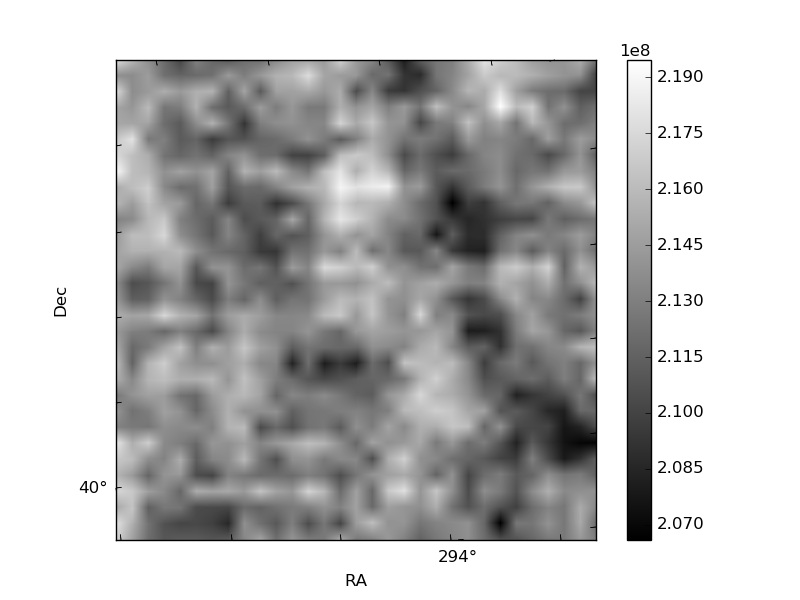
Quadrant B |
|---|---|---|---|
| Quadrant D | 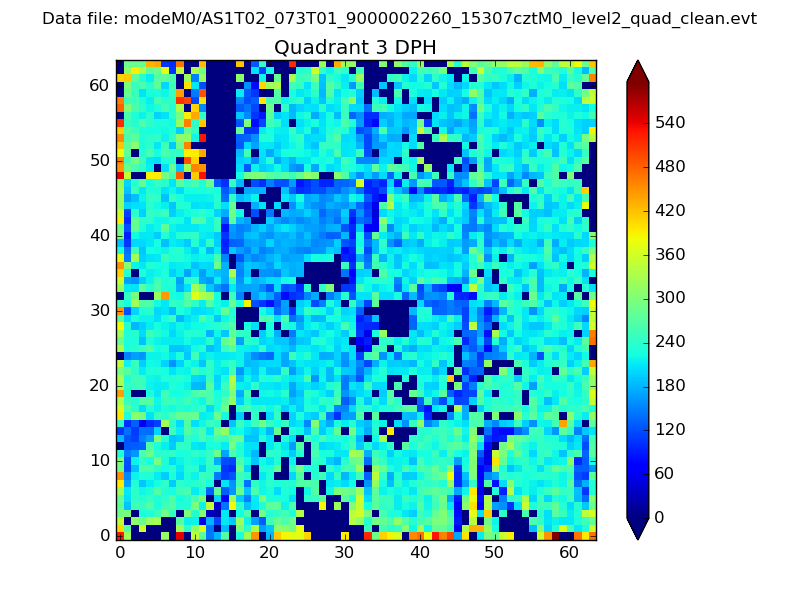 |
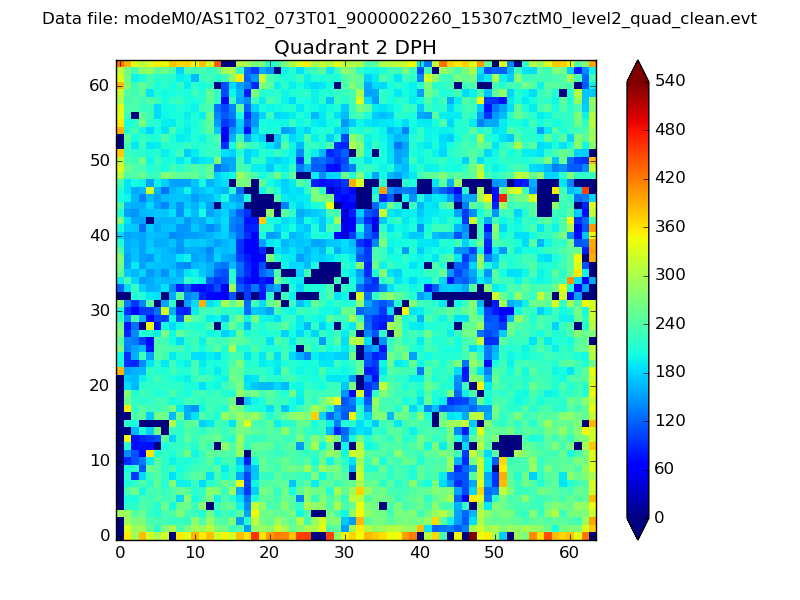 |
Quadrant C |
| Plot type | Count rate plots | Images |
|---|---|---|
| Comparison with Poisson distribution Blue bars denote a histogram of data divided into 1 sec bins. Red curve is a Poisson curve with rate = median count rate of data. |
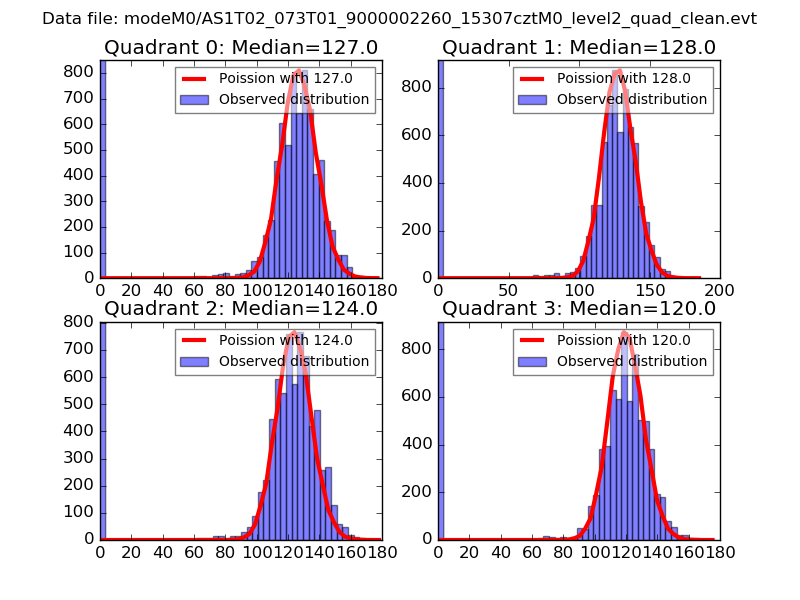 |
 |
| Quadrant-wise count rates Data is divided into 100 sec bins |
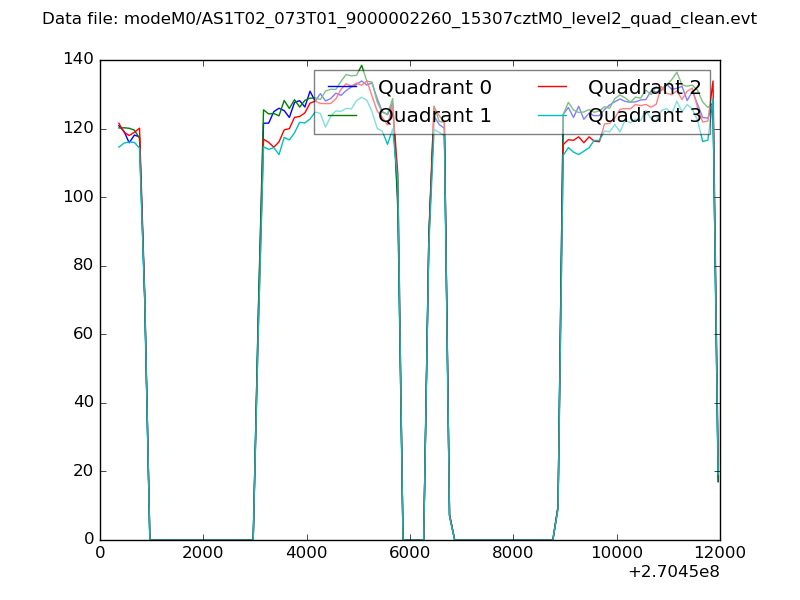 |
|
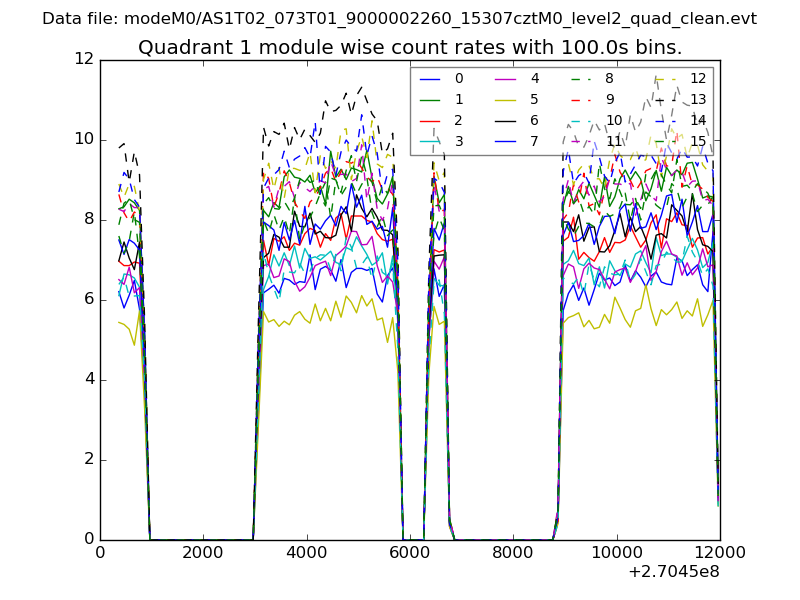
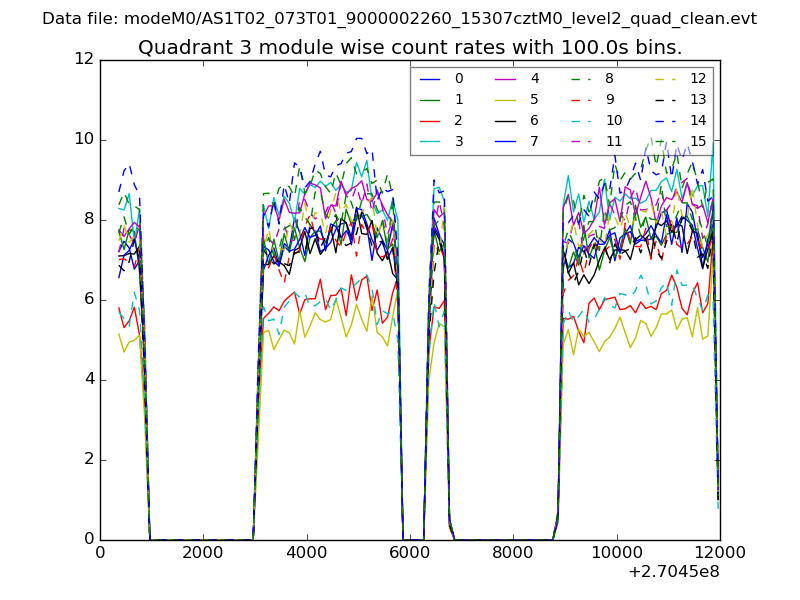
| Module-wise count rates for Quadrant A Data is divided into 100 sec bins |
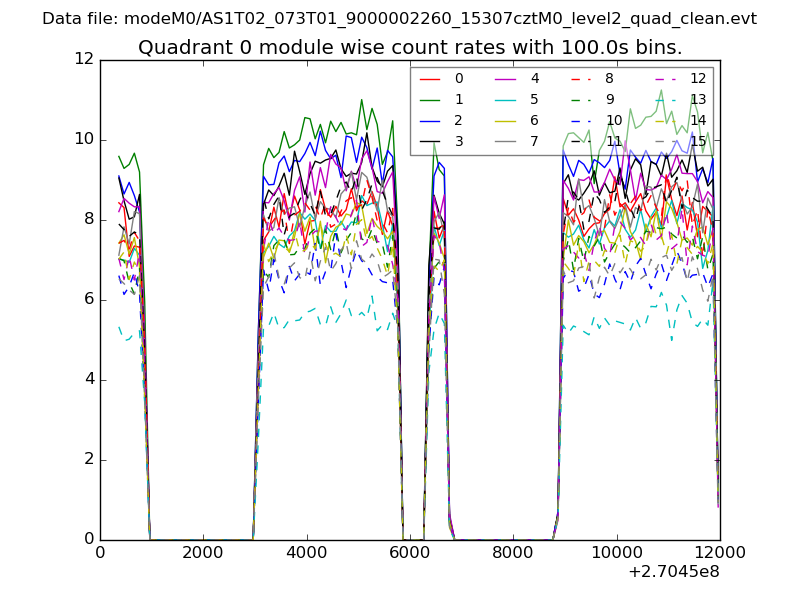 |
 |
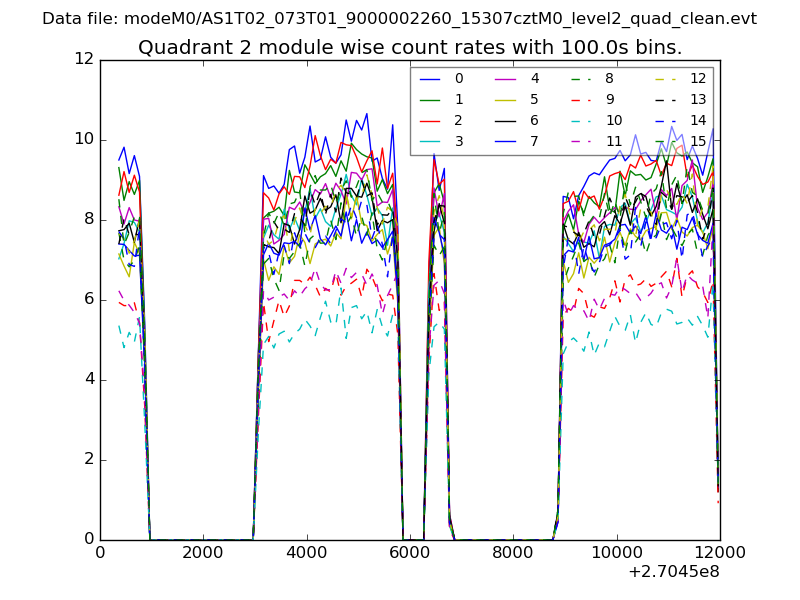
| Module-wise count rates for Quadrant B Data is divided into 100 sec bins |
 |
 |
| Module-wise count rates for Quadrant C Data is divided into 100 sec bins |
 |
 |
| Module-wise count rates for Quadrant D Data is divided into 100 sec bins |
 |
 |
| Parameter | Plot |
|---|---|
| CZT HV Monitor | 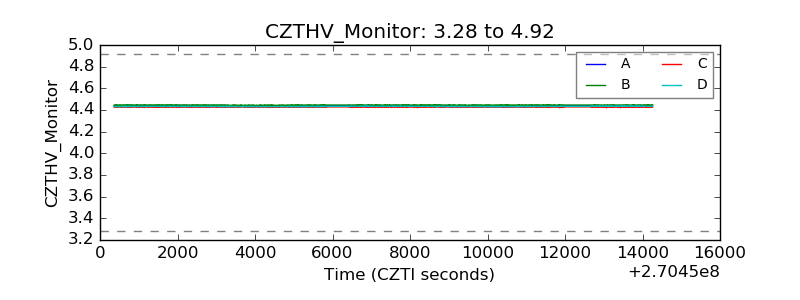 |
| D_VDD | 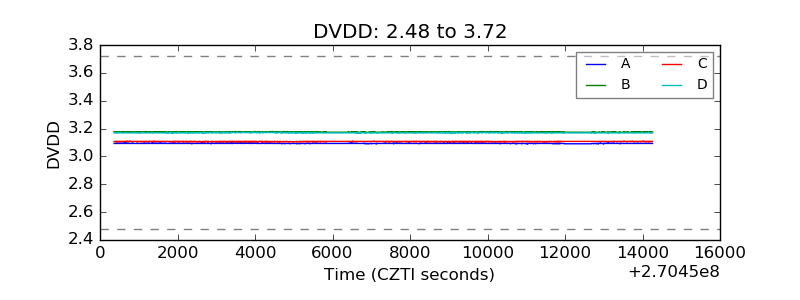 |
| Temperature 1 | 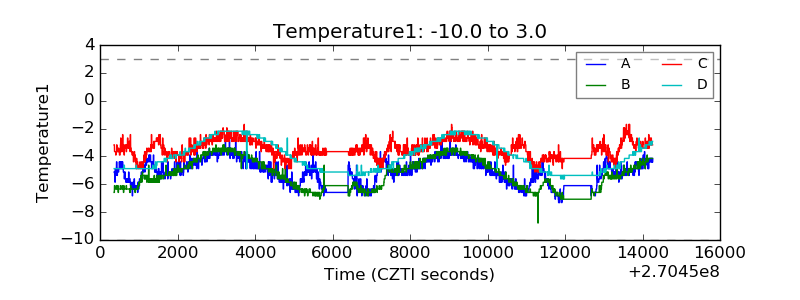 |
| Veto HV Monitor |  |
| Veto LLD | 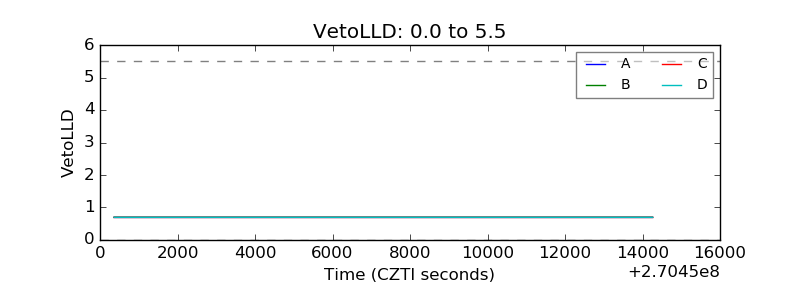 |
| Alpha Counter | 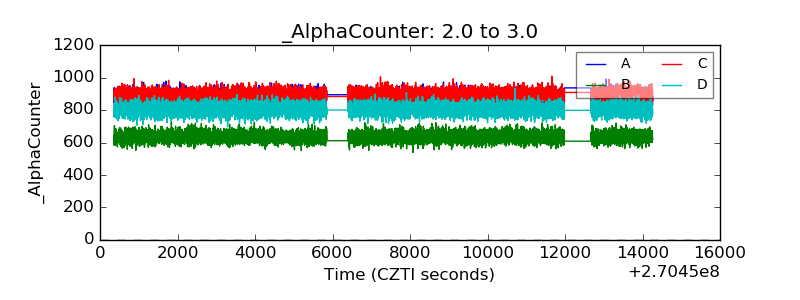 |
| _CPM_Rate | 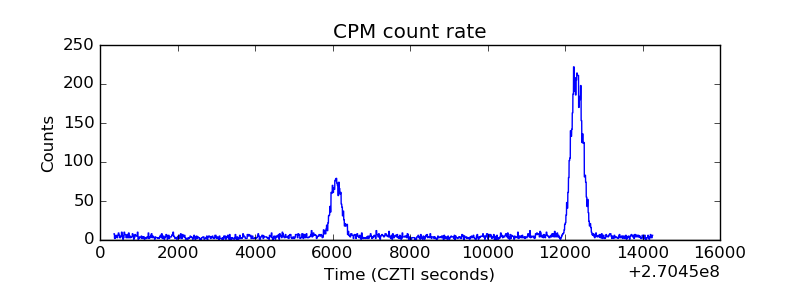 |
| CZT Counter | 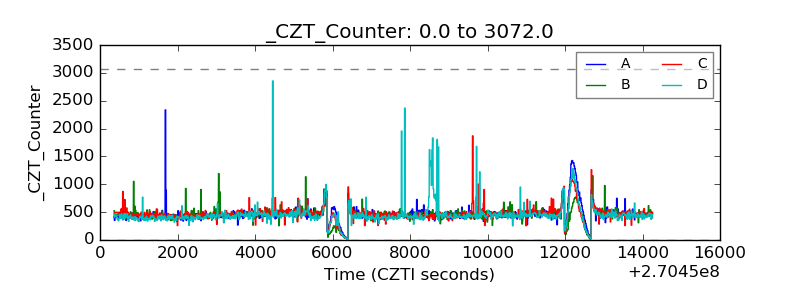 |
| +2.5 Volts monitor |  |
| +5 Volts monitor |  |
| _ROLL_ROT | 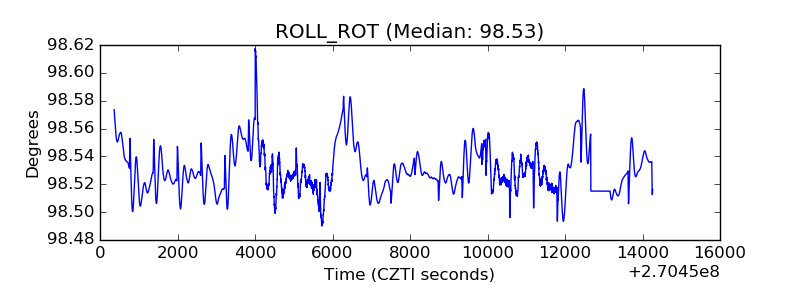 |
| _Roll_DEC | 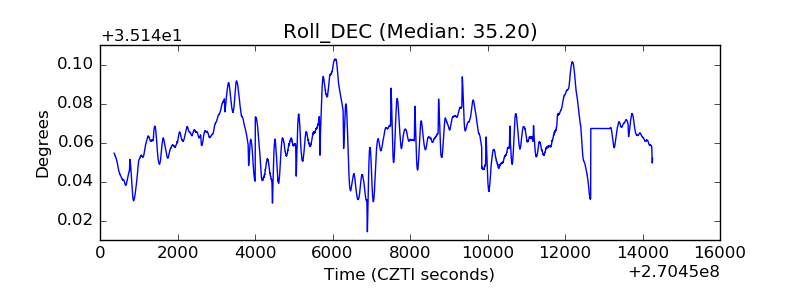 |
| _Roll_RA | 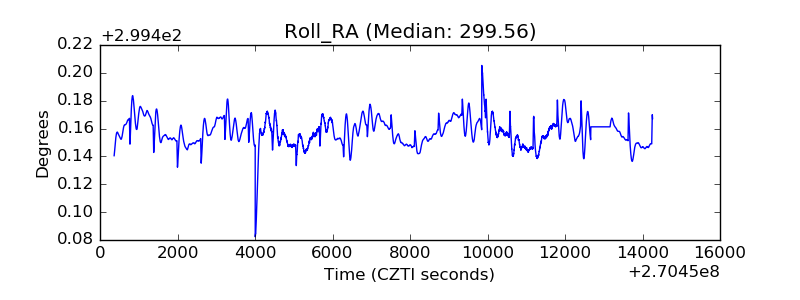 |
| Veto Counter | 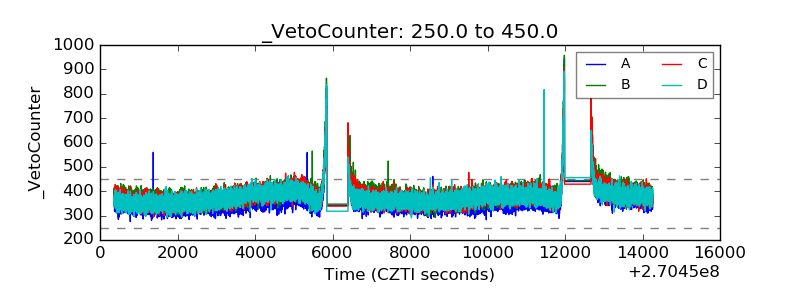 |