| Param | Original file | Final file |
|---|---|---|
| Filename | modeM0/AS1T02_073T01_9000002260_15310cztM0_level2.evt | modeM0/AS1T02_073T01_9000002260_15310cztM0_level2_quad_clean.evt |
| Size (bytes) | 460,422,720 | 86,817,600 |
| Size | 439.1 MB | 82.8 MB |
| Events in quadrant A | 3,235,220 | 554,704 |
| Events in quadrant B | 3,335,273 | 559,040 |
| Events in quadrant C | 3,332,823 | 544,335 |
| Events in quadrant D | 3,603,902 | 522,555 |
| Mode SS | |||
|---|---|---|---|
| Quadrant | BADHDUFLAG | Total packets | Discarded packets |
| A | 0 | 132 | 0 |
| B | 0 | 132 | 0 |
| C | 0 | 132 | 0 |
| D | 0 | 132 | 0 |
| Mode M0 | |||
|---|---|---|---|
| Quadrant | BADHDUFLAG | Total packets | Discarded packets |
| A | 0 | 13789 | 3 |
| B | 0 | 14054 | 2 |
| C | 0 | 13977 | 2 |
| D | 0 | 14966 | 2 |
| Mode M9 | |||
|---|---|---|---|
| Quadrant | BADHDUFLAG | Total packets | Discarded packets |
| A | 0 | 15 | 0 |
| B | 0 | 15 | 0 |
| C | 0 | 15 | 0 |
| D | 0 | 16 | 0 |
| Quadrant | Total seconds | Saturated seconds | Saturation percentage |
|---|---|---|---|
| A | 6424 | 83 | 1.292030% |
| B | 6424 | 90 | 1.400996% |
| C | 6424 | 72 | 1.120797% |
| D | 6424 | 116 | 1.805729% |
Noise dominated data is calculated using 1-second bins in cleaned event files. If a bin has >2000 counts, and if more than 50% of those come from <1% of pixels, then it is considered to be noise-dominated and hence unusable.
| Quadrant | # 1 sec bins | Bins with >0 counts | Bins with >2000 counts | High rate bins dominated by noise | Noise dominated (total time) | Noise dominated (detector-on time) | Marked lightcurve |
|---|---|---|---|---|---|---|---|
| A | 7570 | 6425 | 1 | 1 | 0.01% | 0.02% | 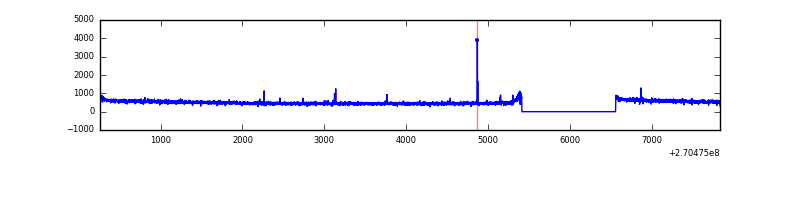 |
| B | 7570 | 6425 | 3 | 3 | 0.04% | 0.05% | 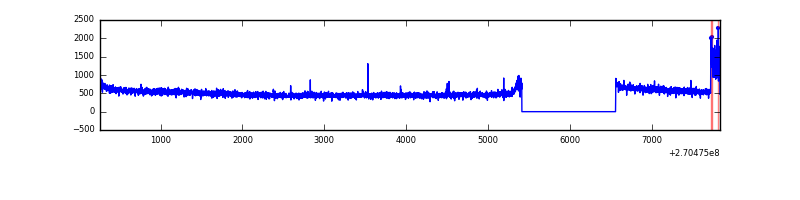 |
| C | 7570 | 6425 | 0 | 0 | 0.00% | 0.00% | 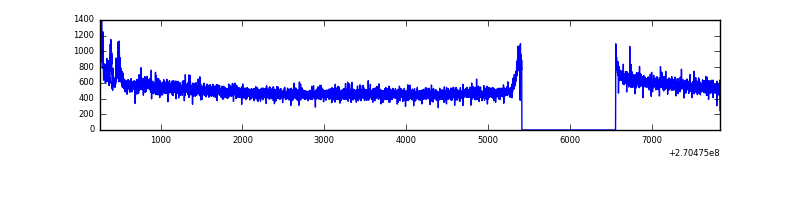 |
| D | 7570 | 6425 | 56 | 56 | 0.74% | 0.87% | 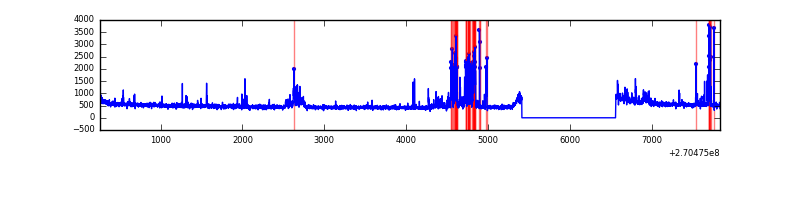 |
Top three noisy pixels from each quadrant. If the there are fewer than three noisy pixels in the level2.evt file, extra rows are filled as -1
| Pixel properties | Quadrant properties | ||||||
|---|---|---|---|---|---|---|---|
| Quadrant | DetID | PixID | Counts | Sigma | Mean | Median | Sigma |
| A | 9 | 143 | 14866 | 83.77 | 836 | 818 | 167.7 |
| A | 0 | 226 | 7447 | 39.53 | 836 | 818 | 167.7 |
| A | 15 | 239 | 6762 | 35.44 | 836 | 818 | 167.7 |
| B | 10 | 16 | 99678 | 627.69 | 826 | 806 | 157.5 |
| B | 12 | 111 | 18906 | 114.91 | 826 | 806 | 157.5 |
| B | 11 | 111 | 16140 | 97.35 | 826 | 806 | 157.5 |
| C | 3 | 233 | 171674 | 922.47 | 807 | 812 | 185.2 |
| C | 7 | 247 | 17672 | 91.02 | 807 | 812 | 185.2 |
| C | 13 | 61 | 5619 | 25.95 | 807 | 812 | 185.2 |
| D | 13 | 122 | 317518 | 1608.09 | 809 | 785 | 197.0 |
| D | 2 | 33 | 203603 | 1029.73 | 809 | 785 | 197.0 |
| D | 2 | 234 | 23825 | 116.98 | 809 | 785 | 197.0 |
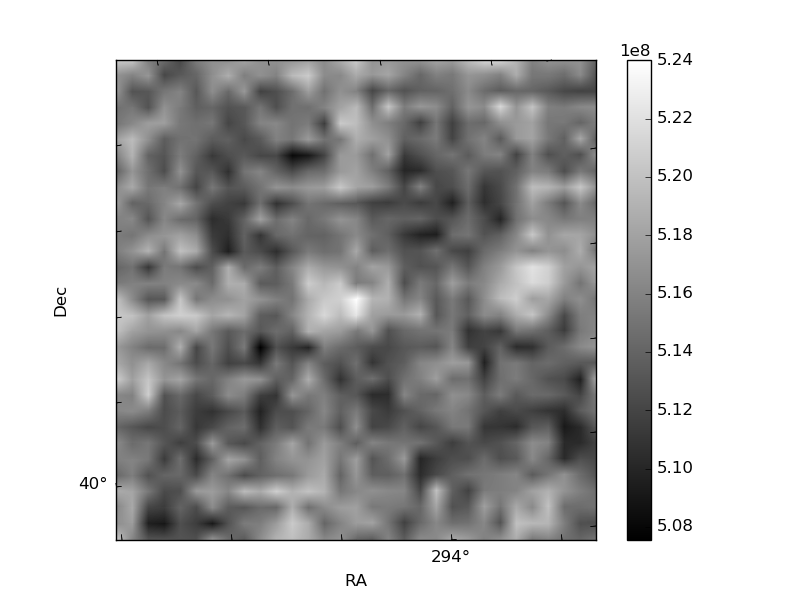
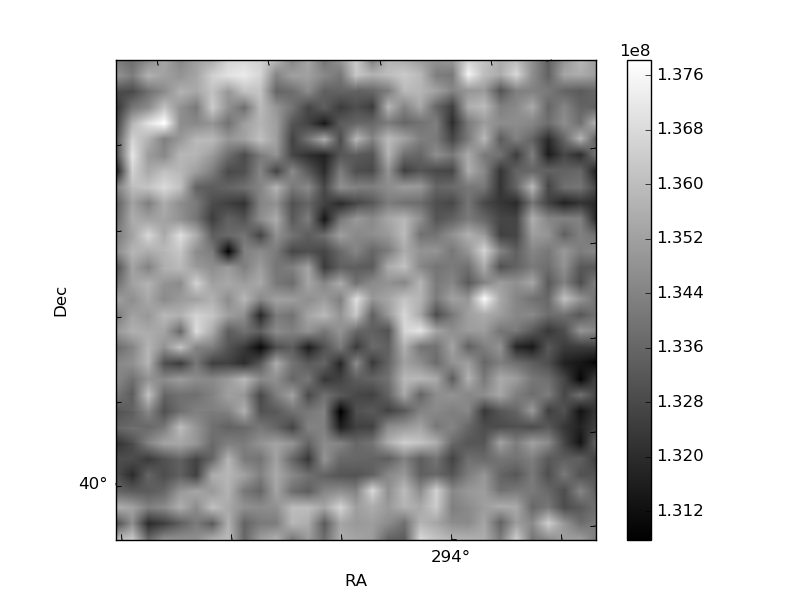
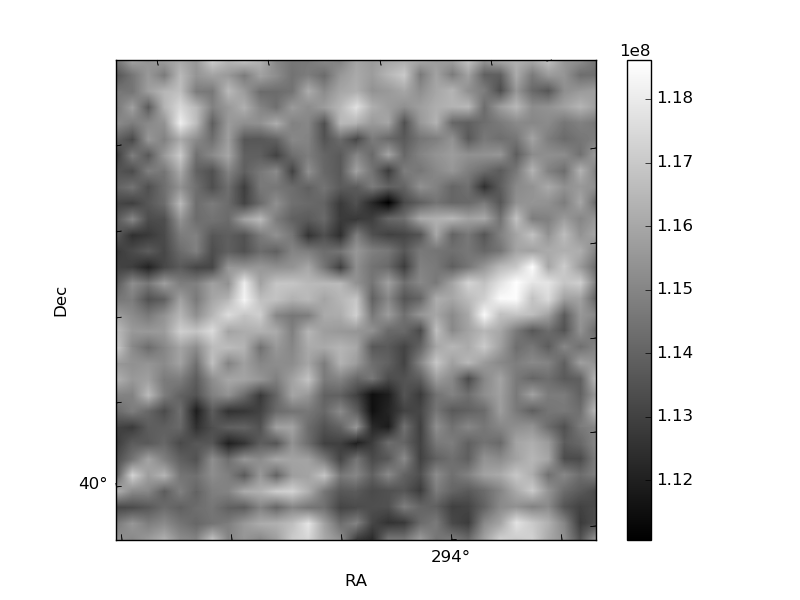
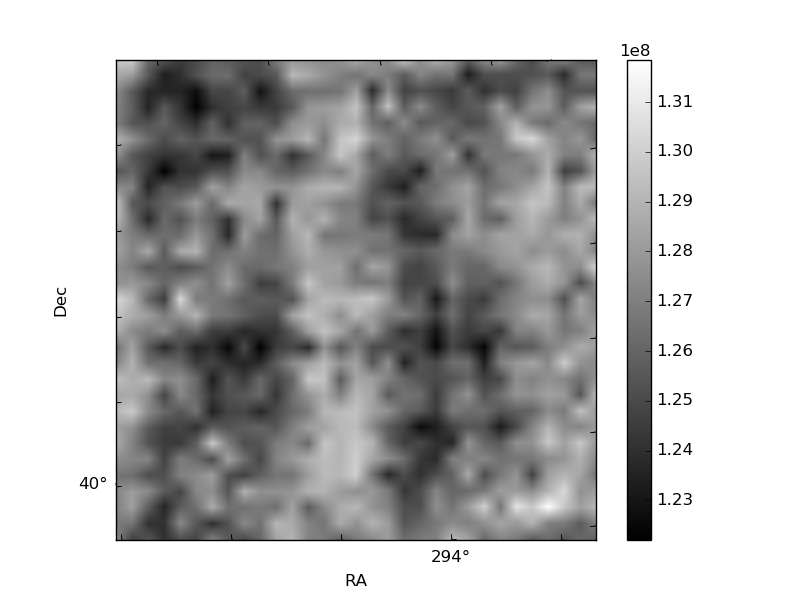
Histogram calculated using DETX and DETY for each event in the final _common_clean file
| Quadrant A | 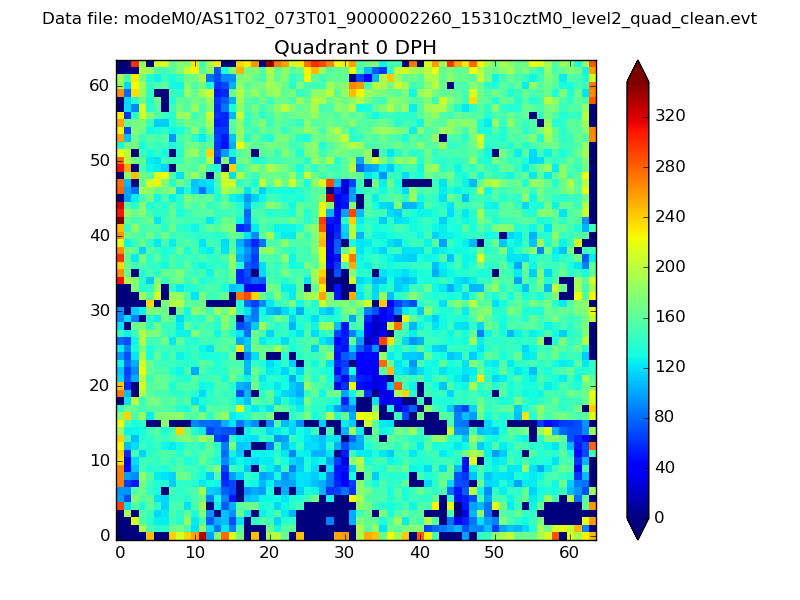 |
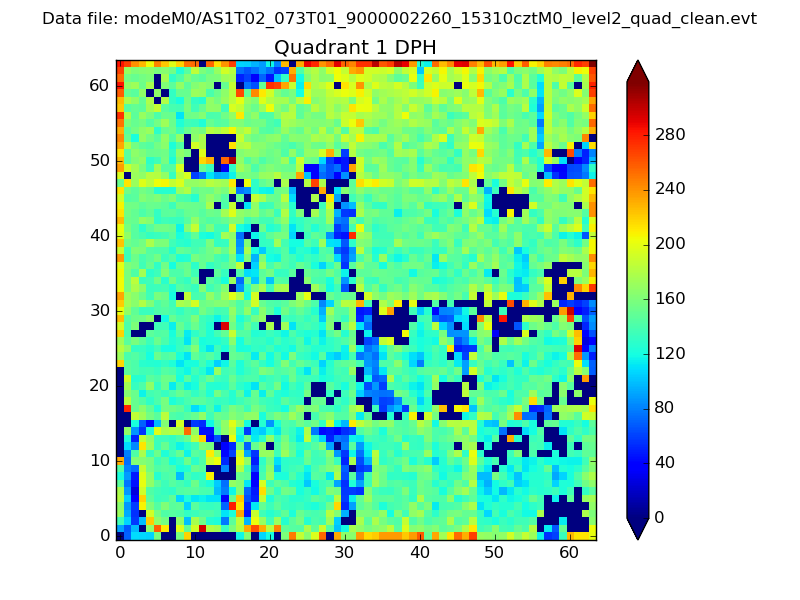 |
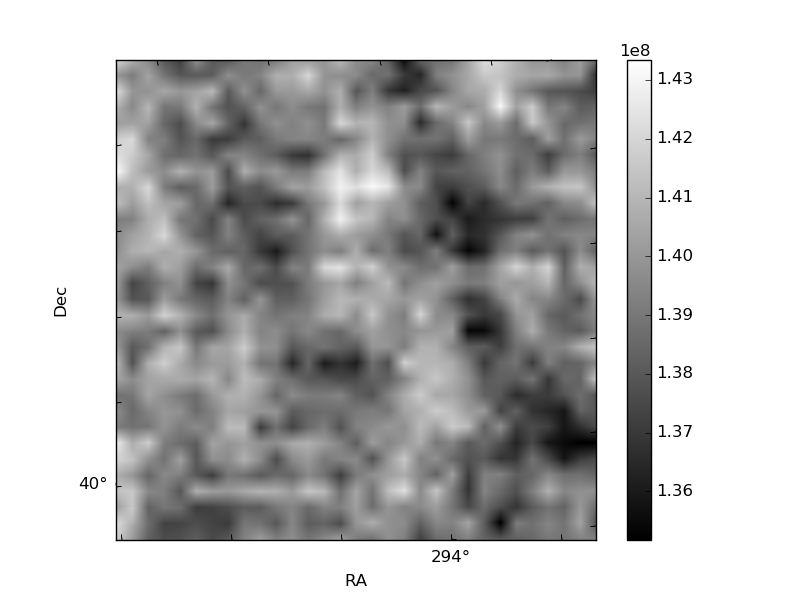
Quadrant B |
|---|---|---|---|
| Quadrant D | 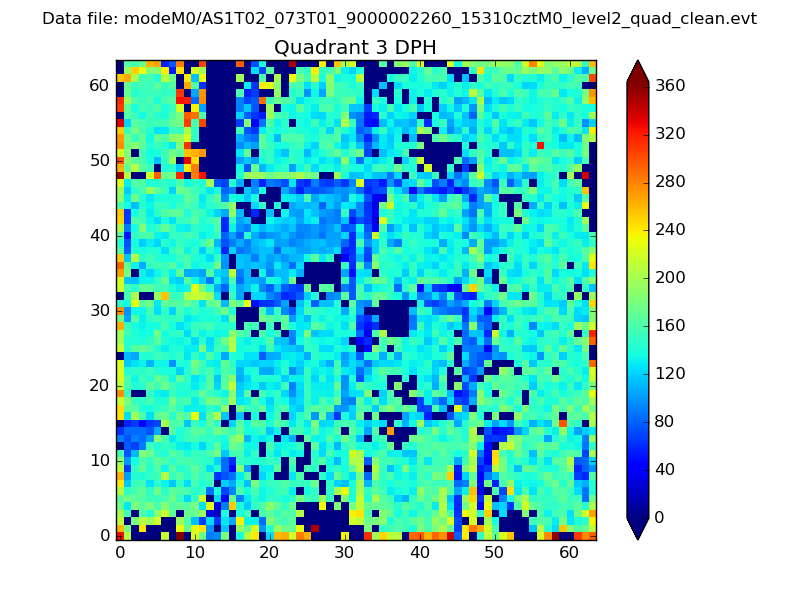 |
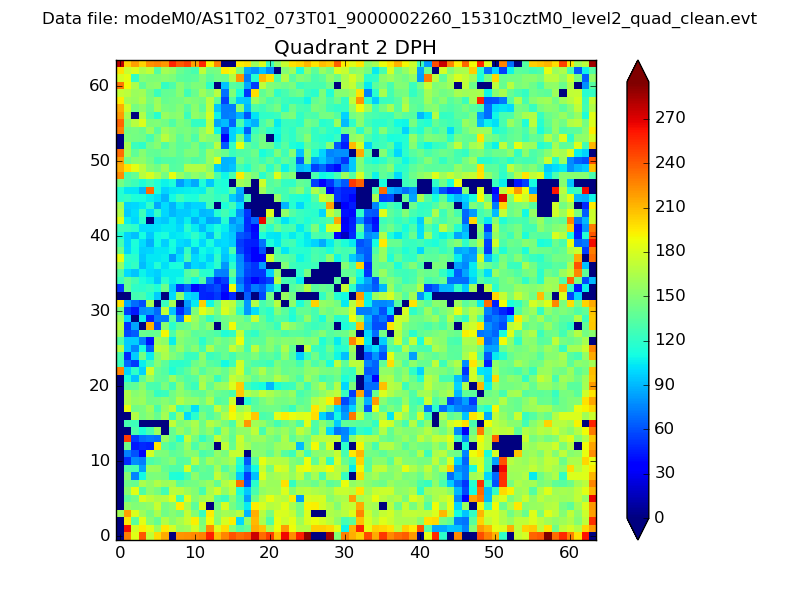 |
Quadrant C |
| Plot type | Count rate plots | Images |
|---|---|---|
| Comparison with Poisson distribution Blue bars denote a histogram of data divided into 1 sec bins. Red curve is a Poisson curve with rate = median count rate of data. |
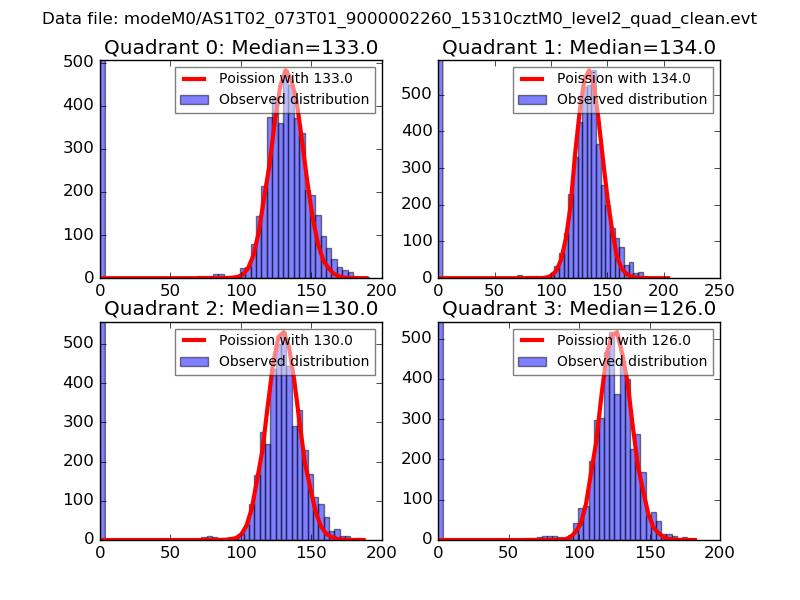 |
 |
| Quadrant-wise count rates Data is divided into 100 sec bins |
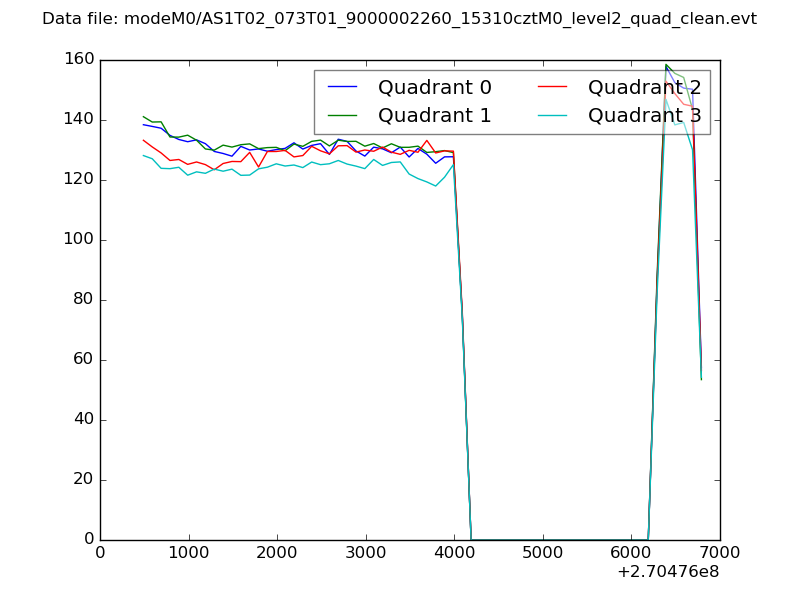 |
|
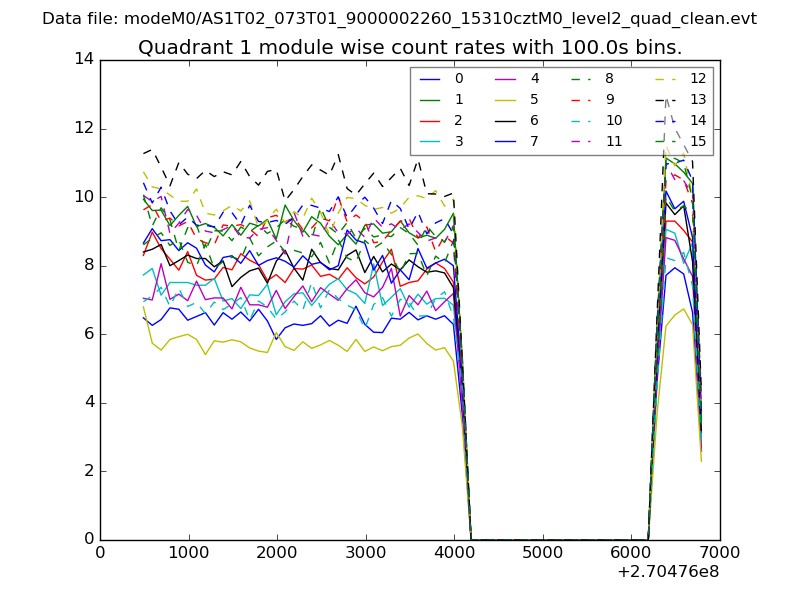
| Module-wise count rates for Quadrant A Data is divided into 100 sec bins |
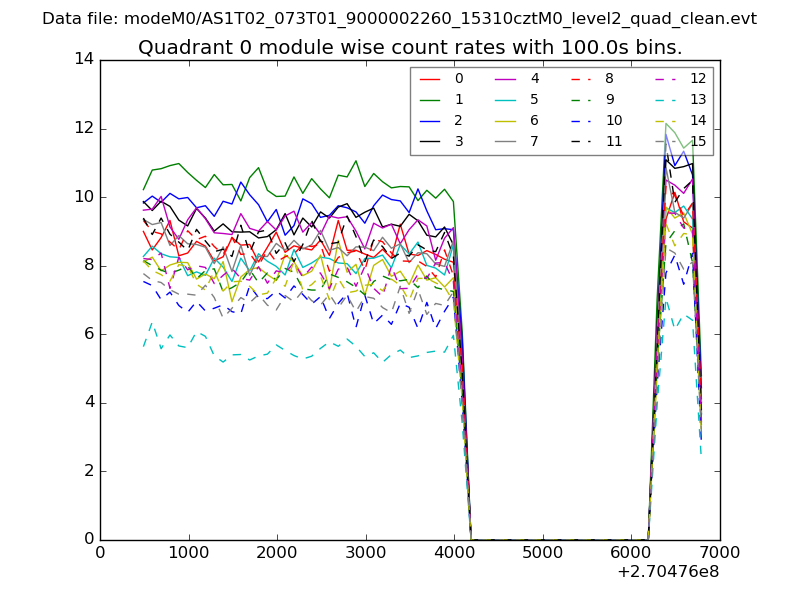 |
 |
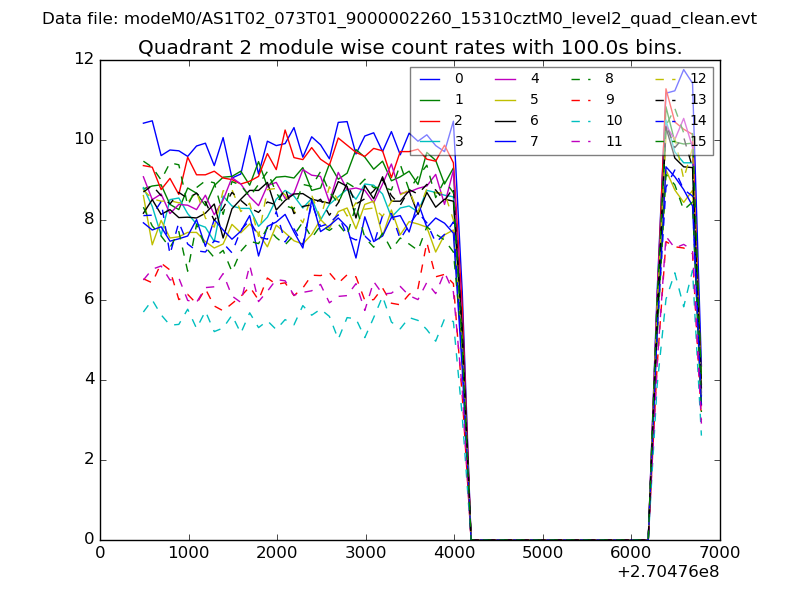
| Module-wise count rates for Quadrant B Data is divided into 100 sec bins |
 |
 |
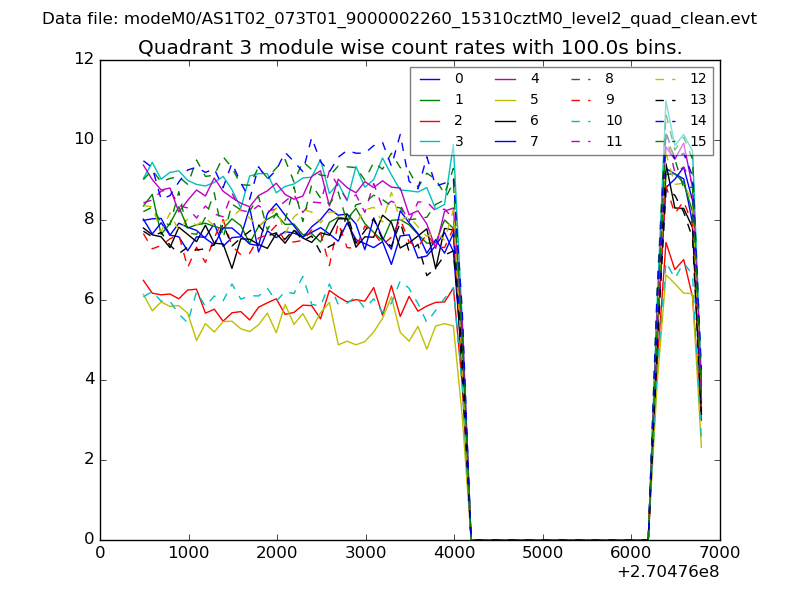
| Module-wise count rates for Quadrant C Data is divided into 100 sec bins |
 |
 |
| Module-wise count rates for Quadrant D Data is divided into 100 sec bins |
 |
 |
| Parameter | Plot |
|---|---|
| CZT HV Monitor | 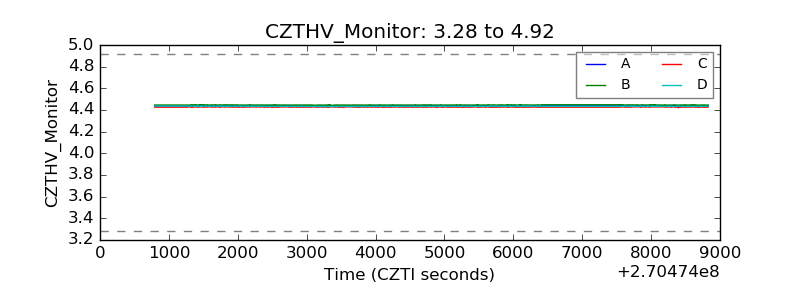 |
| D_VDD | 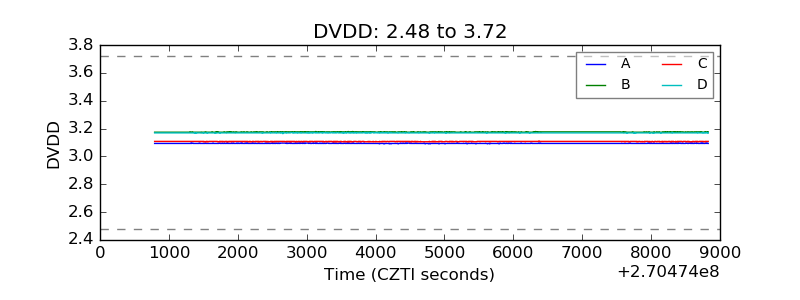 |
| Temperature 1 | 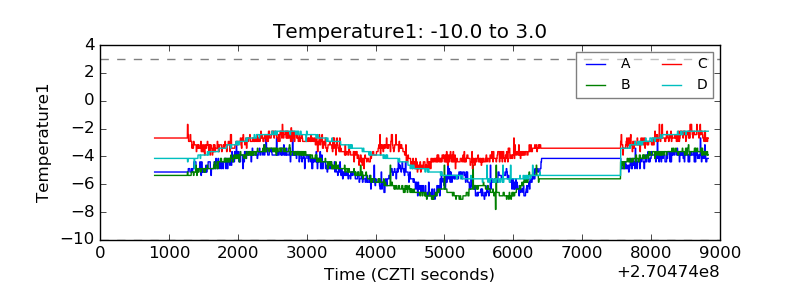 |
| Veto HV Monitor | 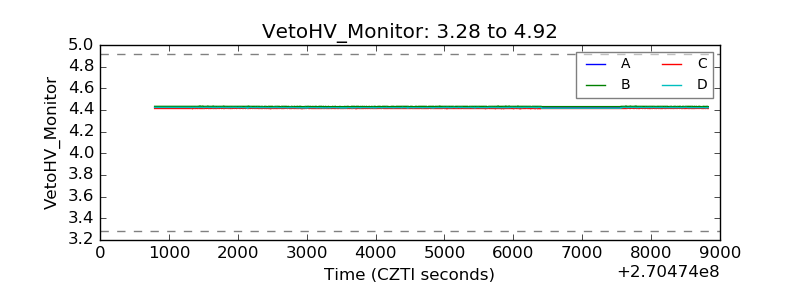 |
| Veto LLD |  |
| Alpha Counter | 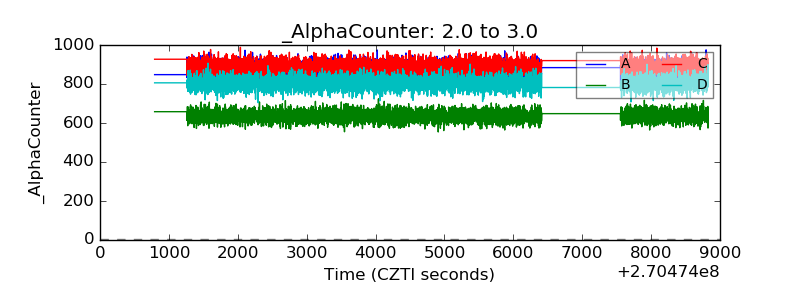 |
| _CPM_Rate | 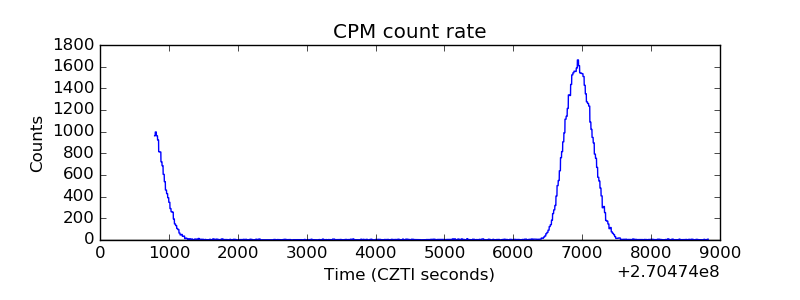 |
| CZT Counter | 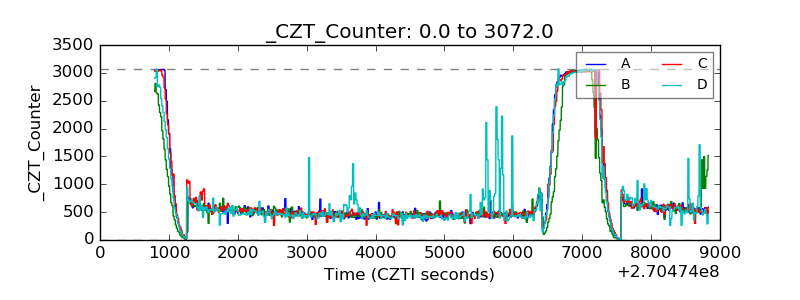 |
| +2.5 Volts monitor |  |
| +5 Volts monitor | 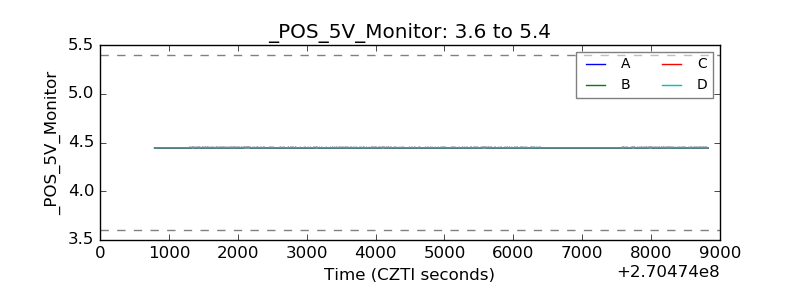 |
| _ROLL_ROT | 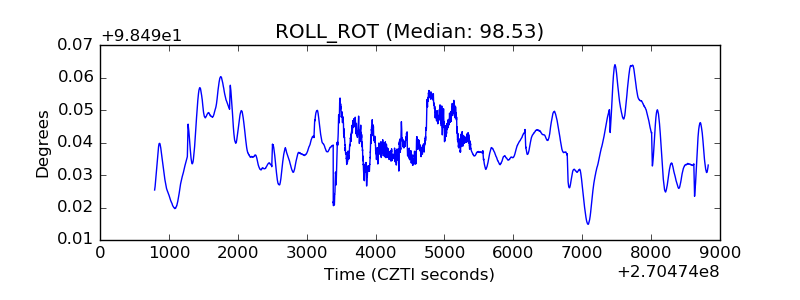 |
| _Roll_DEC | 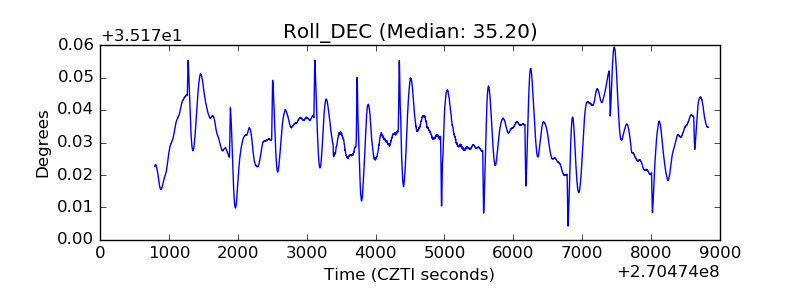 |
| _Roll_RA | 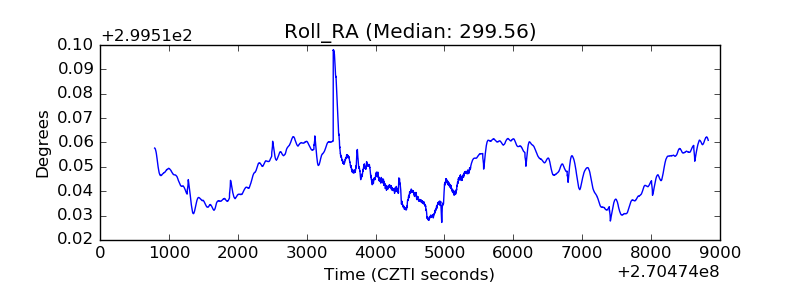 |
| Veto Counter | 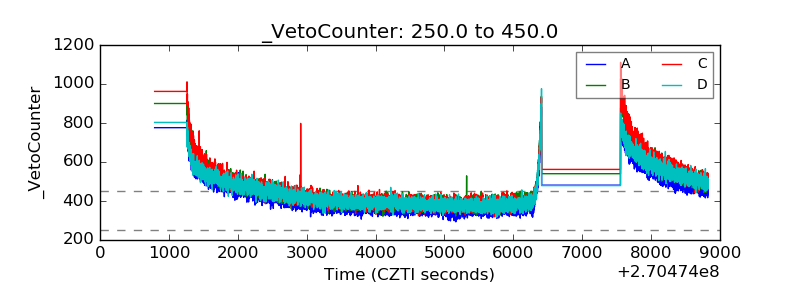 |