| Param | Original file | Final file |
|---|---|---|
| Filename | modeM0/AS1T02_073T01_9000002260_15313cztM0_level2.evt | modeM0/AS1T02_073T01_9000002260_15313cztM0_level2_quad_clean.evt |
| Size (bytes) | 523,195,200 | 110,430,720 |
| Size | 499.0 MB | 105.3 MB |
| Events in quadrant A | 3,218,888 | 739,131 |
| Events in quadrant B | 3,221,765 | 756,017 |
| Events in quadrant C | 3,424,069 | 742,296 |
| Events in quadrant D | 5,562,749 | 677,012 |
| Mode SS | |||
|---|---|---|---|
| Quadrant | BADHDUFLAG | Total packets | Discarded packets |
| A | 0 | 126 | 0 |
| B | 0 | 126 | 0 |
| C | 0 | 126 | 0 |
| D | 0 | 126 | 0 |
| Mode M0 | |||
|---|---|---|---|
| Quadrant | BADHDUFLAG | Total packets | Discarded packets |
| A | 0 | 13576 | 3 |
| B | 0 | 13566 | 2 |
| C | 0 | 14179 | 2 |
| D | 0 | 20621 | 2 |
| Mode M9 | |||
|---|---|---|---|
| Quadrant | BADHDUFLAG | Total packets | Discarded packets |
| A | 0 | 26 | 0 |
| B | 0 | 26 | 0 |
| C | 0 | 26 | 0 |
| D | 0 | 26 | 0 |
| Quadrant | Total seconds | Saturated seconds | Saturation percentage |
|---|---|---|---|
| A | 6164 | 100 | 1.622323% |
| B | 6164 | 108 | 1.752109% |
| C | 6164 | 93 | 1.508761% |
| D | 6164 | 595 | 9.652823% |
Noise dominated data is calculated using 1-second bins in cleaned event files. If a bin has >2000 counts, and if more than 50% of those come from <1% of pixels, then it is considered to be noise-dominated and hence unusable.
| Quadrant | # 1 sec bins | Bins with >0 counts | Bins with >2000 counts | High rate bins dominated by noise | Noise dominated (total time) | Noise dominated (detector-on time) | Marked lightcurve |
|---|---|---|---|---|---|---|---|
| A | 8730 | 6166 | 1 | 1 | 0.01% | 0.02% | 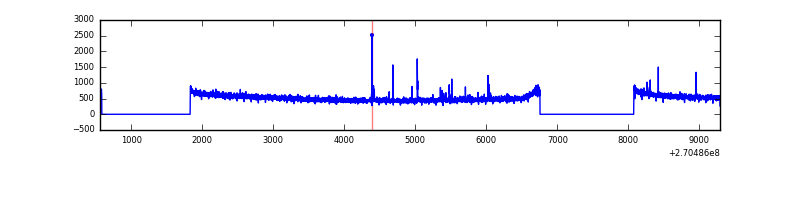 |
| B | 8730 | 6165 | 0 | 0 | 0.00% | 0.00% | 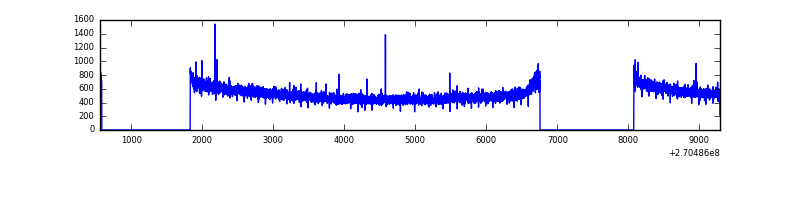 |
| C | 8730 | 6165 | 3 | 3 | 0.03% | 0.05% | 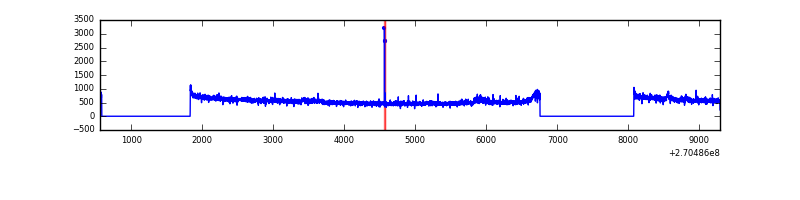 |
| D | 8730 | 6165 | 474 | 474 | 5.43% | 7.69% | 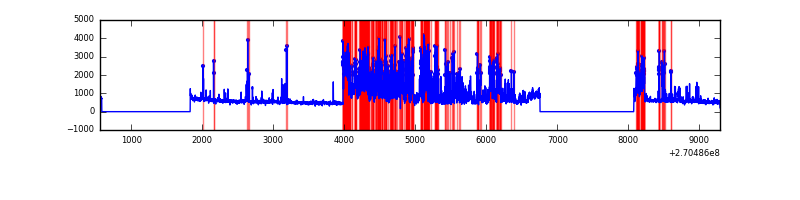 |
Top three noisy pixels from each quadrant. If the there are fewer than three noisy pixels in the level2.evt file, extra rows are filled as -1
| Pixel properties | Quadrant properties | ||||||
|---|---|---|---|---|---|---|---|
| Quadrant | DetID | PixID | Counts | Sigma | Mean | Median | Sigma |
| A | 9 | 143 | 23910 | 140.24 | 828 | 814 | 164.7 |
| A | 15 | 239 | 8934 | 49.31 | 828 | 814 | 164.7 |
| A | 0 | 226 | 7327 | 39.55 | 828 | 814 | 164.7 |
| B | 12 | 111 | 17845 | 110.38 | 825 | 803 | 154.4 |
| B | 11 | 111 | 15494 | 95.16 | 825 | 803 | 154.4 |
| B | 14 | 111 | 12885 | 78.26 | 825 | 803 | 154.4 |
| C | 3 | 233 | 220613 | 1178.56 | 819 | 825 | 186.5 |
| C | 14 | 234 | 10202 | 50.28 | 819 | 825 | 186.5 |
| C | 13 | 61 | 5641 | 25.82 | 819 | 825 | 186.5 |
| D | 13 | 122 | 2277424 | 11919.0 | 795 | 771 | 191.0 |
| D | 2 | 33 | 231798 | 1209.5 | 795 | 771 | 191.0 |
| D | 2 | 234 | 20787 | 104.79 | 795 | 771 | 191.0 |
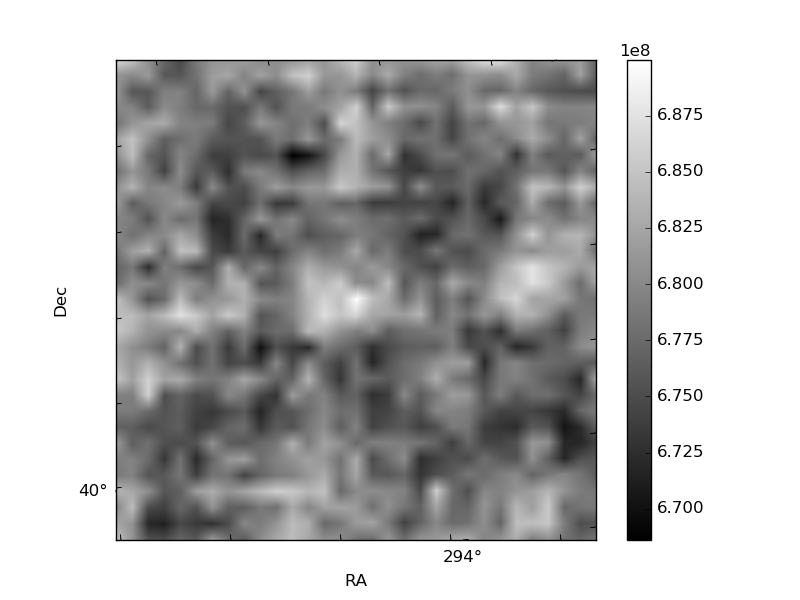
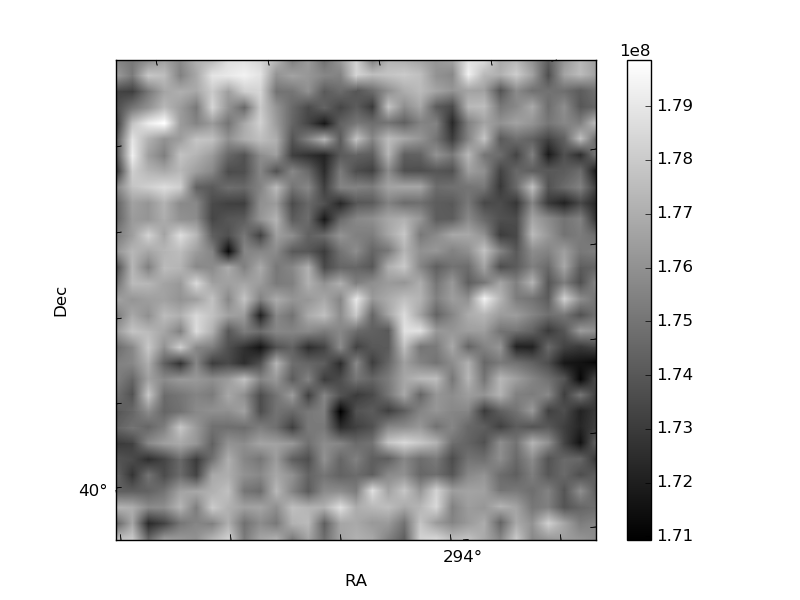
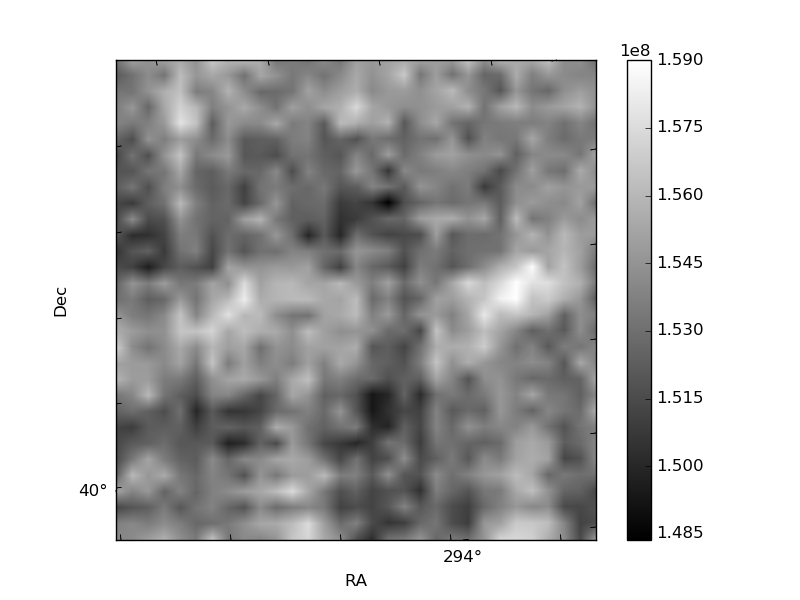
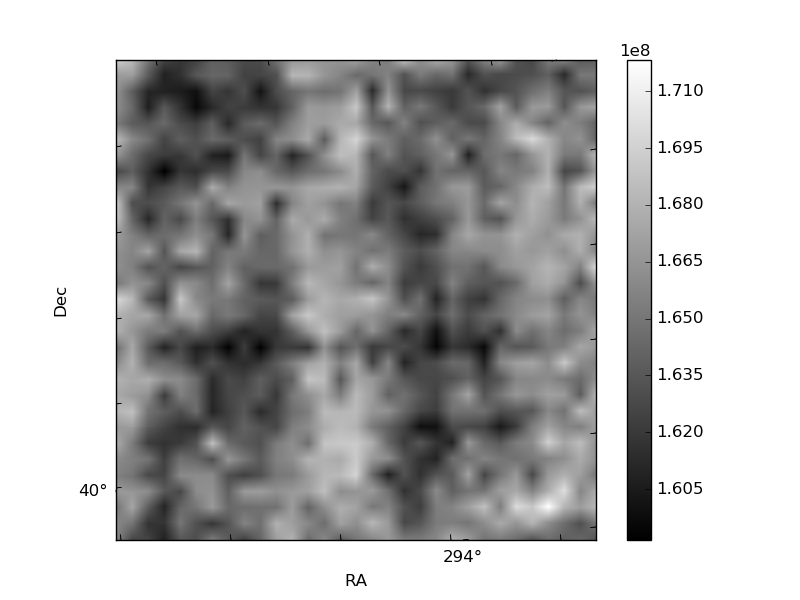
Histogram calculated using DETX and DETY for each event in the final _common_clean file
| Quadrant A | 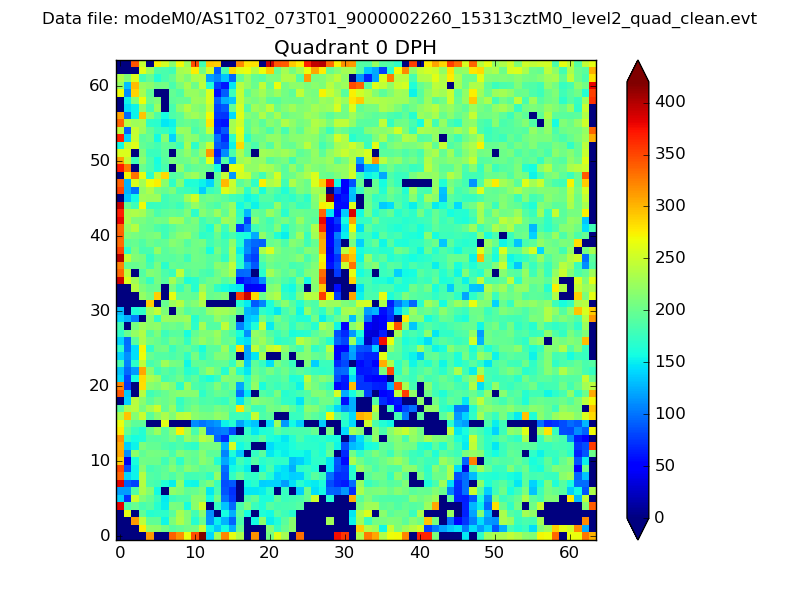 |
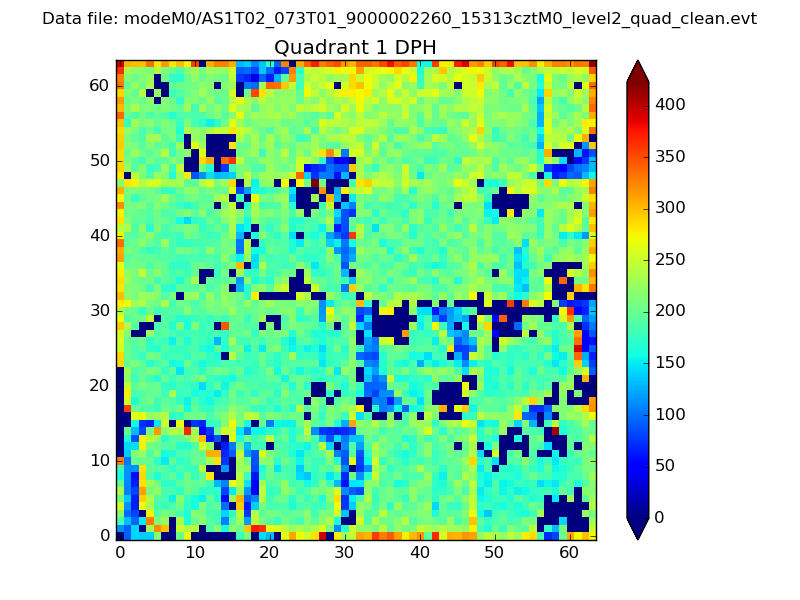 |
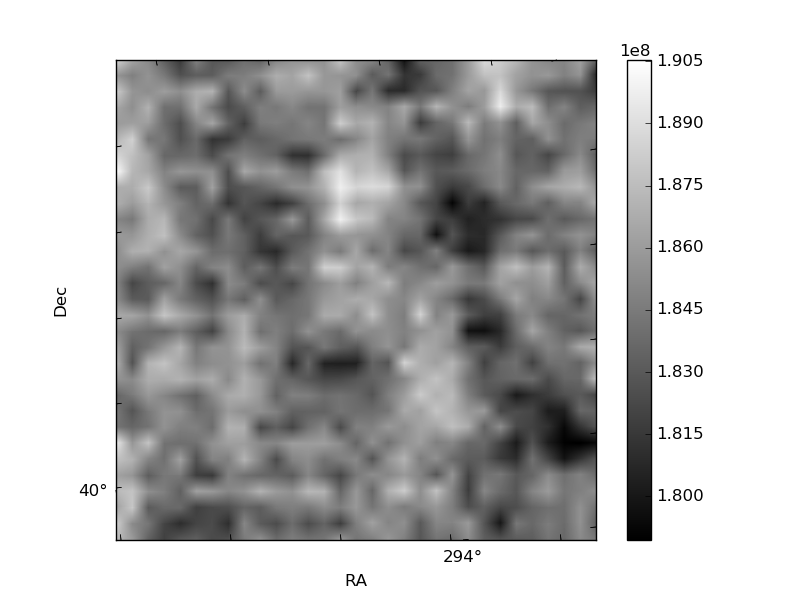
Quadrant B |
|---|---|---|---|
| Quadrant D | 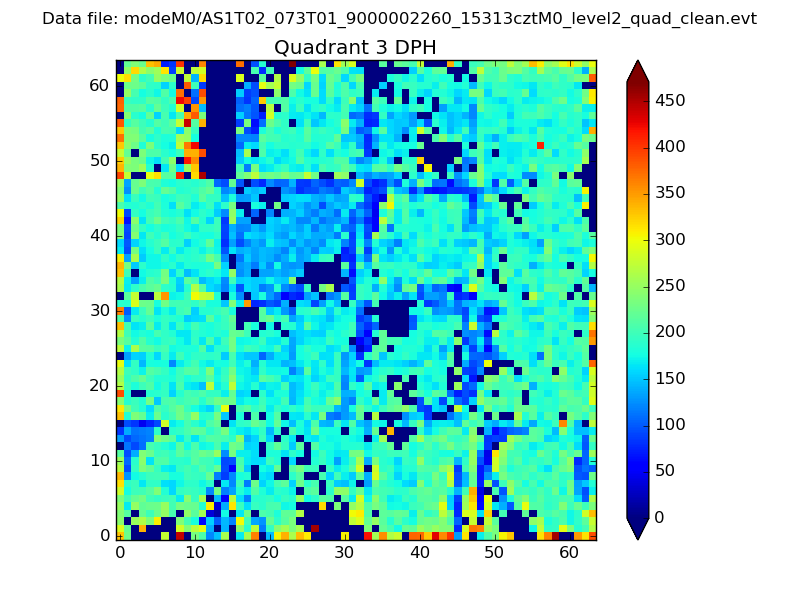 |
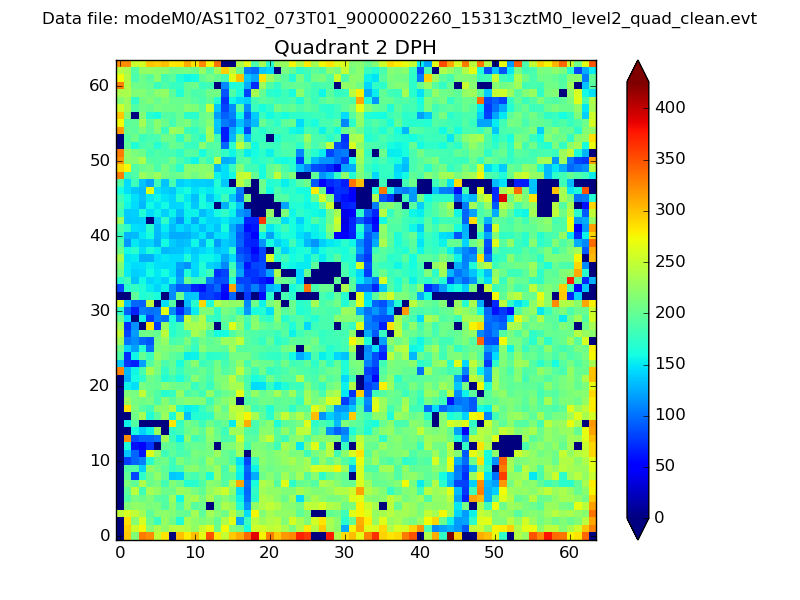 |
Quadrant C |
| Plot type | Count rate plots | Images |
|---|---|---|
| Comparison with Poisson distribution Blue bars denote a histogram of data divided into 1 sec bins. Red curve is a Poisson curve with rate = median count rate of data. |
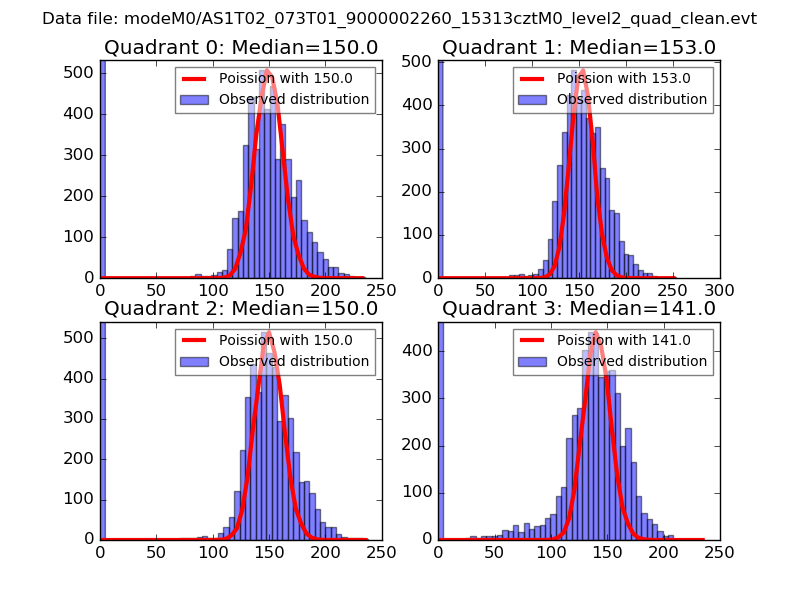 |
 |
| Quadrant-wise count rates Data is divided into 100 sec bins |
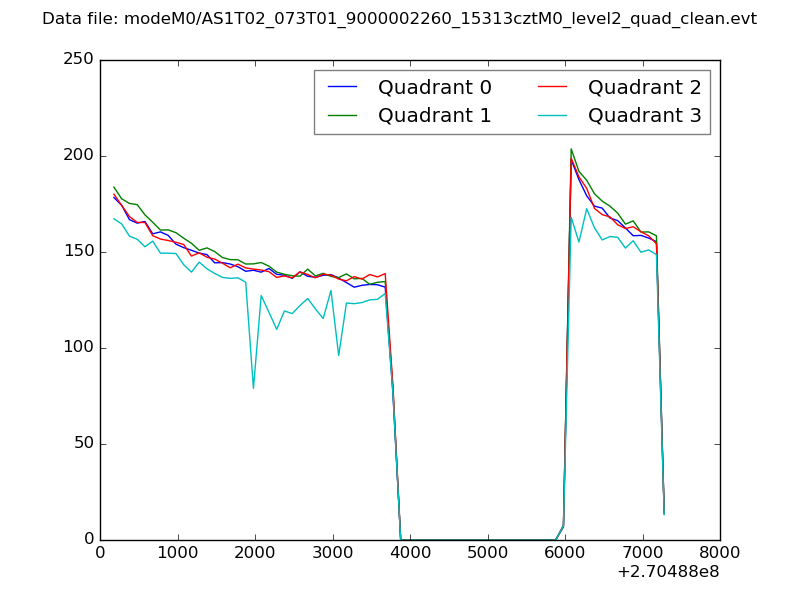 |
|
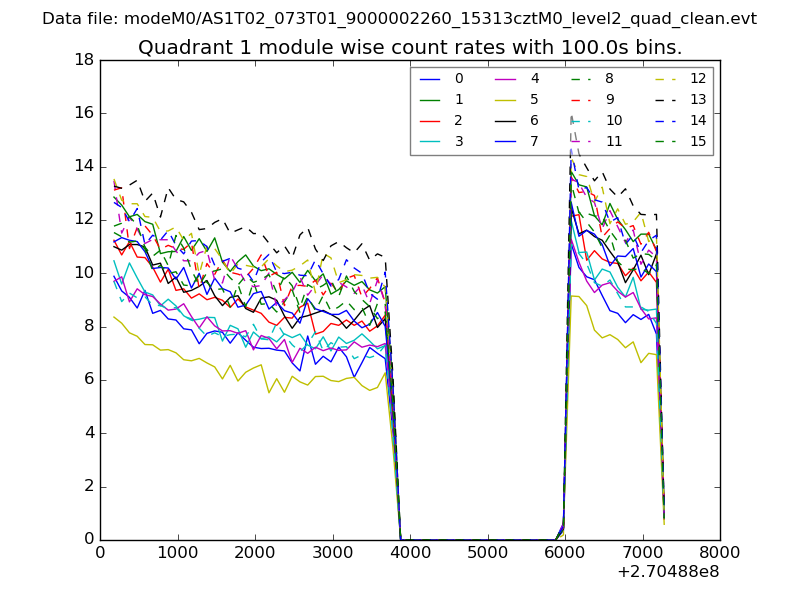
| Module-wise count rates for Quadrant A Data is divided into 100 sec bins |
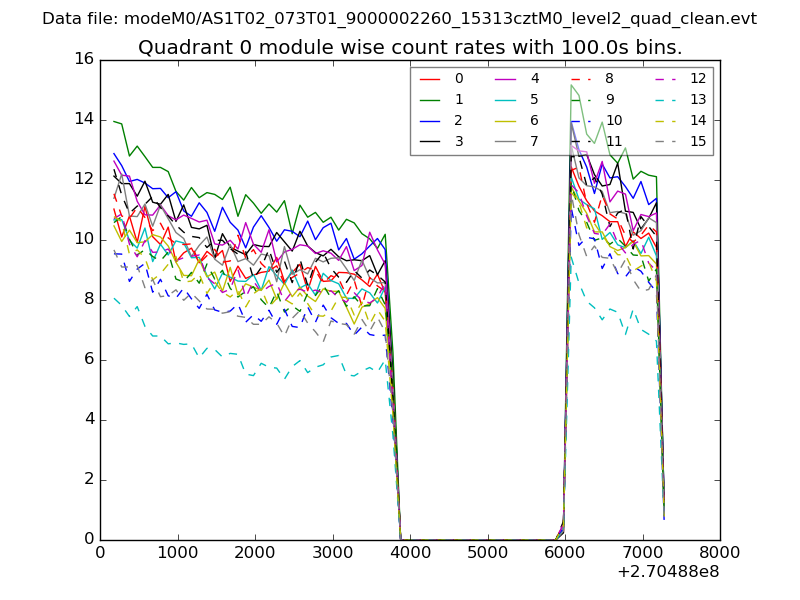 |
 |
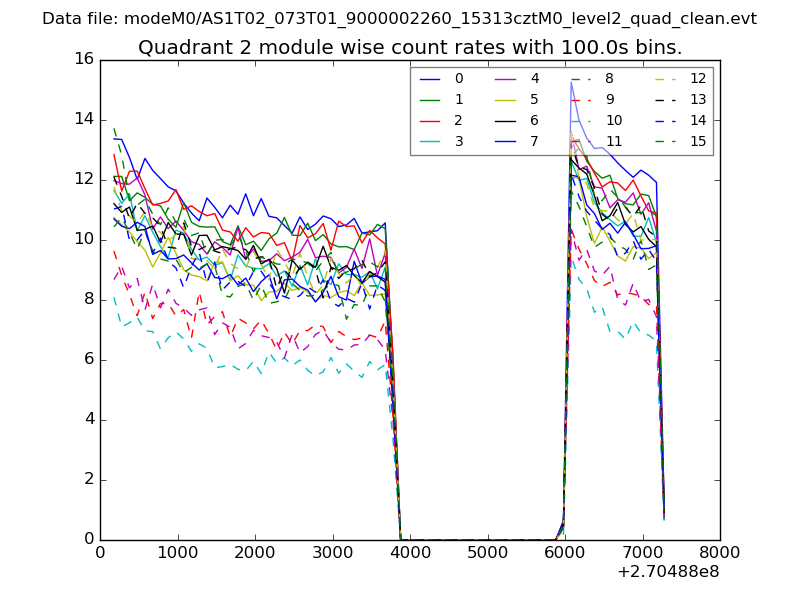
| Module-wise count rates for Quadrant B Data is divided into 100 sec bins |
 |
 |
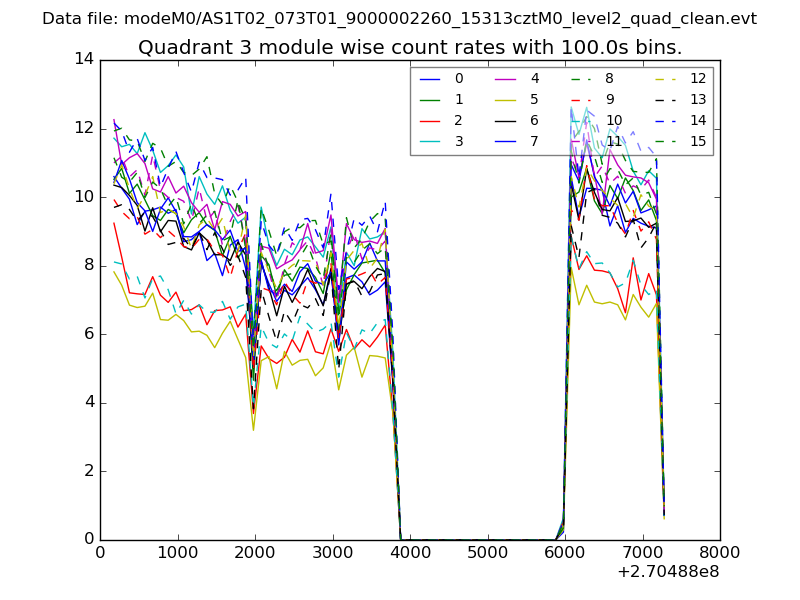
| Module-wise count rates for Quadrant C Data is divided into 100 sec bins |
 |
 |
| Module-wise count rates for Quadrant D Data is divided into 100 sec bins |
 |
 |
| Parameter | Plot |
|---|---|
| CZT HV Monitor | 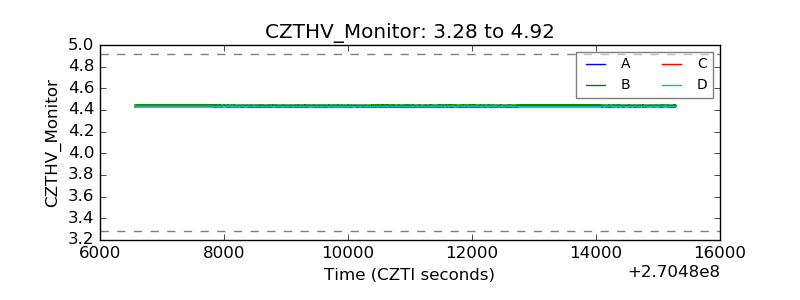 |
| D_VDD | 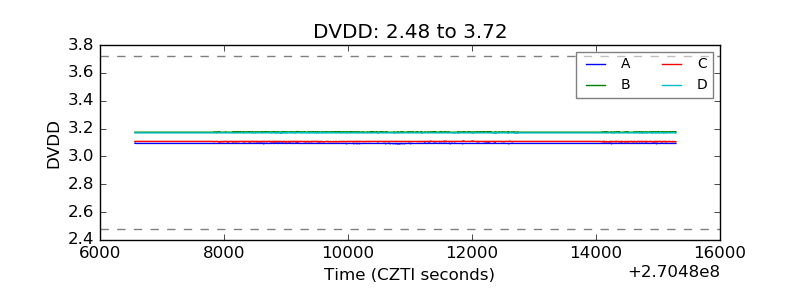 |
| Temperature 1 | 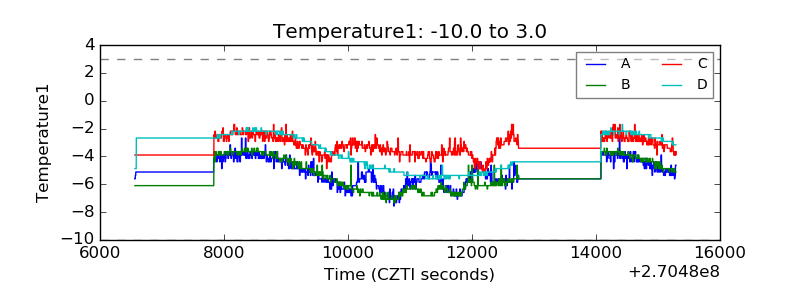 |
| Veto HV Monitor | 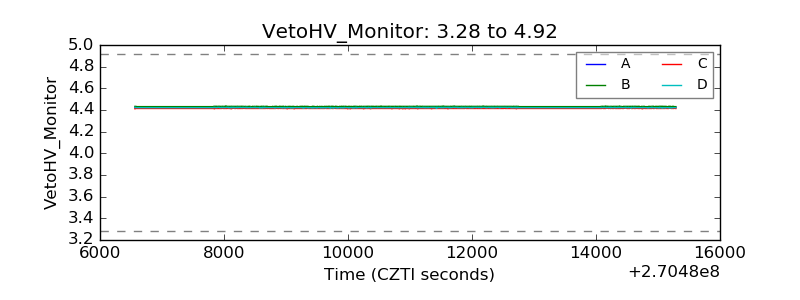 |
| Veto LLD | 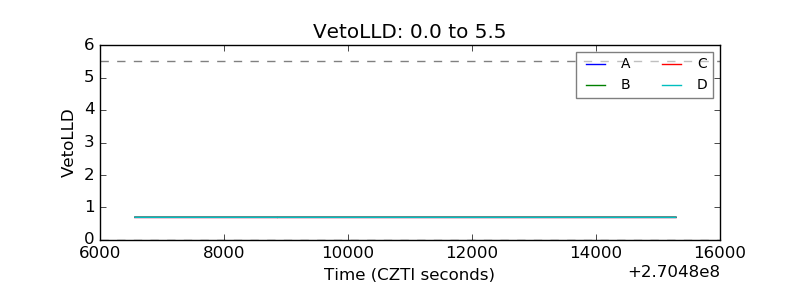 |
| Alpha Counter | 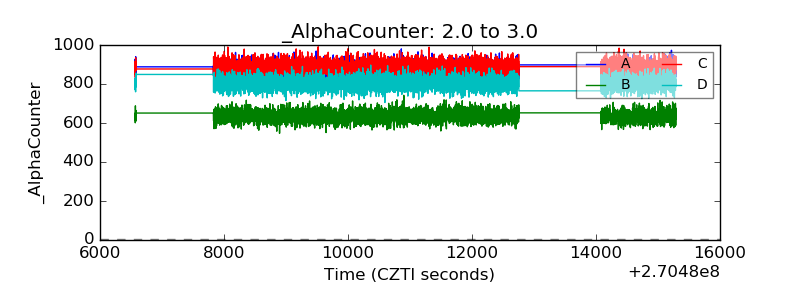 |
| _CPM_Rate | 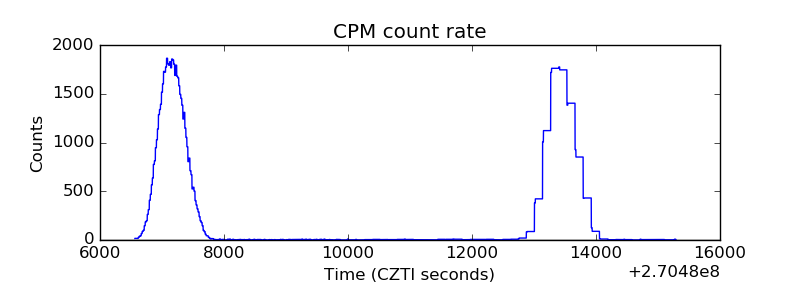 |
| CZT Counter | 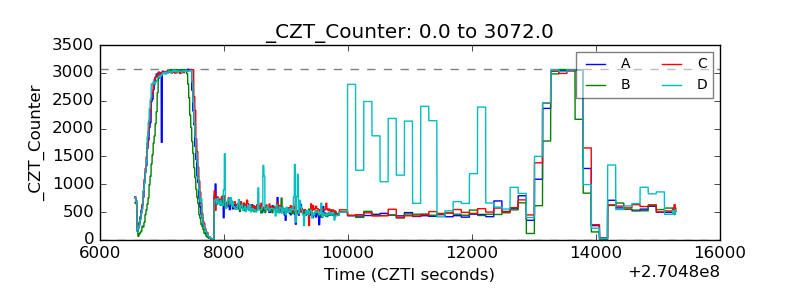 |
| +2.5 Volts monitor |  |
| +5 Volts monitor |  |
| _ROLL_ROT | 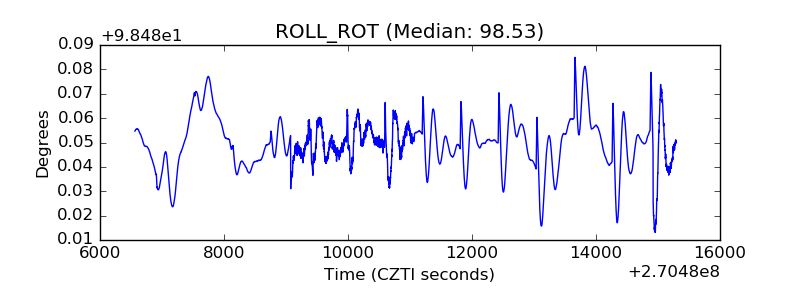 |
| _Roll_DEC | 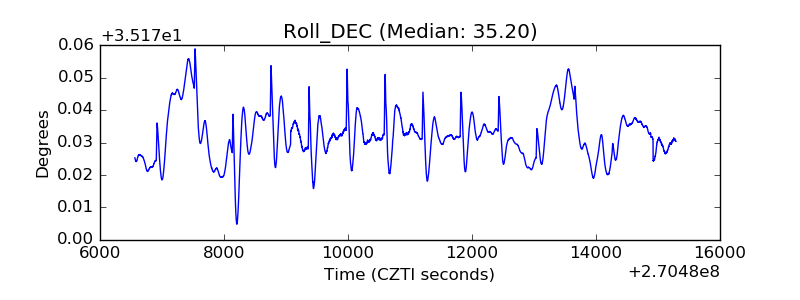 |
| _Roll_RA | 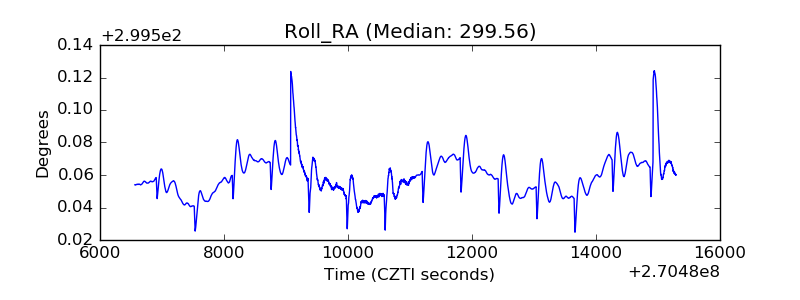 |
| Veto Counter | 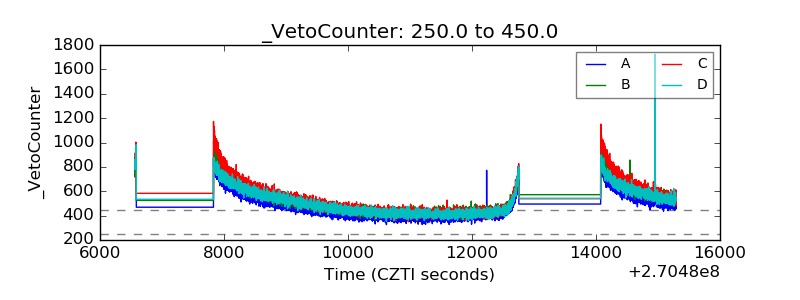 |