| Param | Original file | Final file |
|---|---|---|
| Filename | modeM0/AS1T02_073T01_9000002260_15315cztM0_level2.evt | modeM0/AS1T02_073T01_9000002260_15315cztM0_level2_quad_clean.evt |
| Size (bytes) | 453,283,200 | 97,090,560 |
| Size | 432.3 MB | 92.6 MB |
| Events in quadrant A | 3,202,046 | 622,940 |
| Events in quadrant B | 3,306,498 | 635,775 |
| Events in quadrant C | 3,455,343 | 627,139 |
| Events in quadrant D | 3,320,528 | 599,608 |
| Mode SS | |||
|---|---|---|---|
| Quadrant | BADHDUFLAG | Total packets | Discarded packets |
| A | 0 | 134 | 0 |
| B | 0 | 134 | 0 |
| C | 0 | 134 | 0 |
| D | 0 | 134 | 0 |
| Mode M0 | |||
|---|---|---|---|
| Quadrant | BADHDUFLAG | Total packets | Discarded packets |
| A | 0 | 13789 | 3 |
| B | 0 | 13945 | 2 |
| C | 0 | 14247 | 2 |
| D | 0 | 14359 | 2 |
| Mode M9 | |||
|---|---|---|---|
| Quadrant | BADHDUFLAG | Total packets | Discarded packets |
| A | 0 | 26 | 0 |
| B | 0 | 26 | 0 |
| C | 0 | 26 | 0 |
| D | 0 | 26 | 0 |
| Quadrant | Total seconds | Saturated seconds | Saturation percentage |
|---|---|---|---|
| A | 6525 | 69 | 1.057471% |
| B | 6525 | 102 | 1.563218% |
| C | 6525 | 75 | 1.149425% |
| D | 6525 | 79 | 1.210728% |
Noise dominated data is calculated using 1-second bins in cleaned event files. If a bin has >2000 counts, and if more than 50% of those come from <1% of pixels, then it is considered to be noise-dominated and hence unusable.
| Quadrant | # 1 sec bins | Bins with >0 counts | Bins with >2000 counts | High rate bins dominated by noise | Noise dominated (total time) | Noise dominated (detector-on time) | Marked lightcurve |
|---|---|---|---|---|---|---|---|
| A | 9136 | 6528 | 0 | 0 | 0.00% | 0.00% | 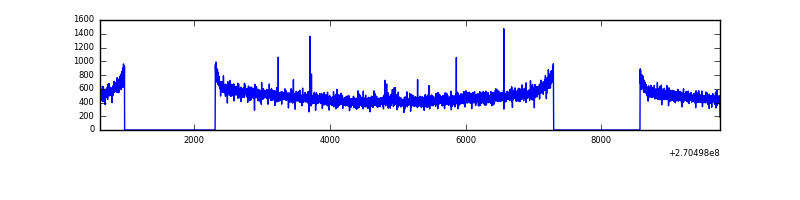 |
| B | 9136 | 6527 | 3 | 3 | 0.03% | 0.05% | 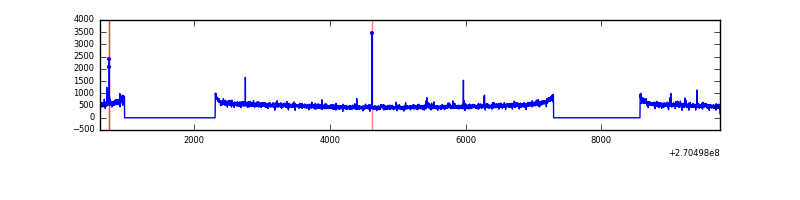 |
| C | 9136 | 6528 | 0 | 0 | 0.00% | 0.00% | 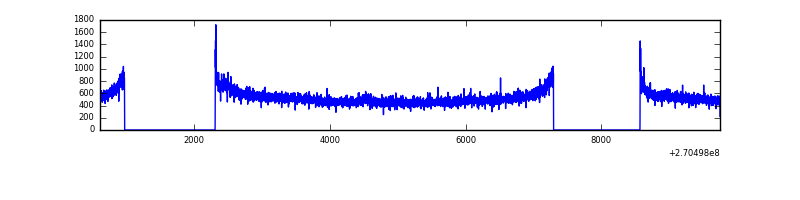 |
| D | 9136 | 6528 | 7 | 7 | 0.08% | 0.11% | 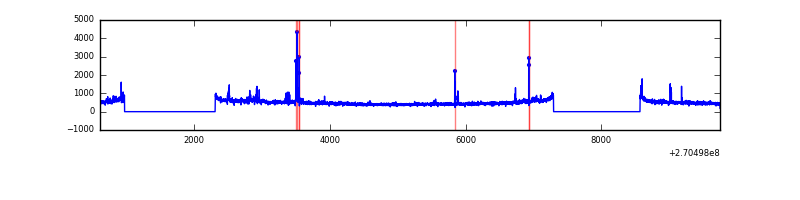 |
Top three noisy pixels from each quadrant. If the there are fewer than three noisy pixels in the level2.evt file, extra rows are filled as -1
| Pixel properties | Quadrant properties | ||||||
|---|---|---|---|---|---|---|---|
| Quadrant | DetID | PixID | Counts | Sigma | Mean | Median | Sigma |
| A | 9 | 143 | 7621 | 40.98 | 831 | 814 | 166.1 |
| A | 0 | 226 | 7332 | 39.24 | 831 | 814 | 166.1 |
| A | 12 | 194 | 6196 | 32.4 | 831 | 814 | 166.1 |
| B | 12 | 111 | 18961 | 115.34 | 832 | 812 | 157.4 |
| B | 11 | 111 | 16133 | 97.36 | 832 | 812 | 157.4 |
| B | 14 | 111 | 13417 | 80.1 | 832 | 812 | 157.4 |
| C | 3 | 233 | 239016 | 1264.22 | 825 | 831 | 188.4 |
| C | 13 | 61 | 5854 | 26.66 | 825 | 831 | 188.4 |
| C | 7 | 247 | 1898 | 5.66 | 825 | 831 | 188.4 |
| D | 13 | 122 | 123100 | 616.65 | 818 | 796 | 198.3 |
| D | 2 | 33 | 48528 | 240.66 | 818 | 796 | 198.3 |
| D | 12 | 110 | 27804 | 136.17 | 818 | 796 | 198.3 |
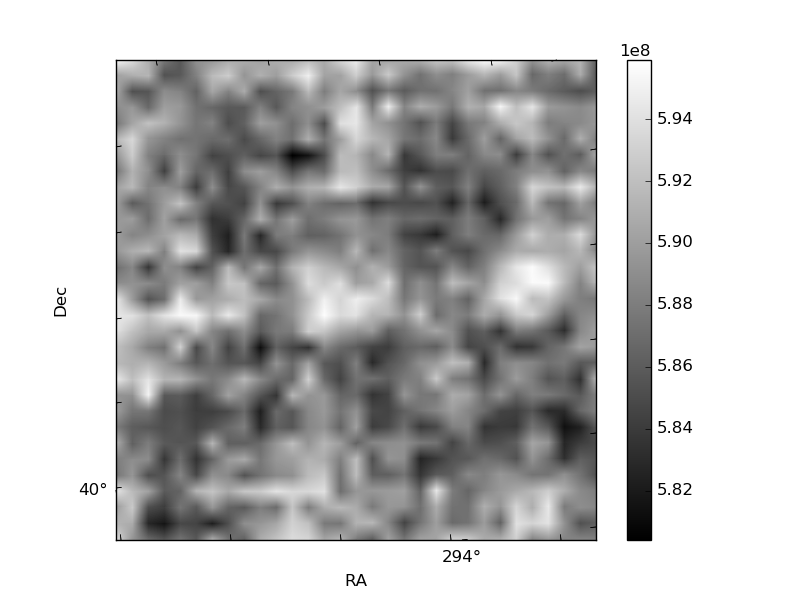
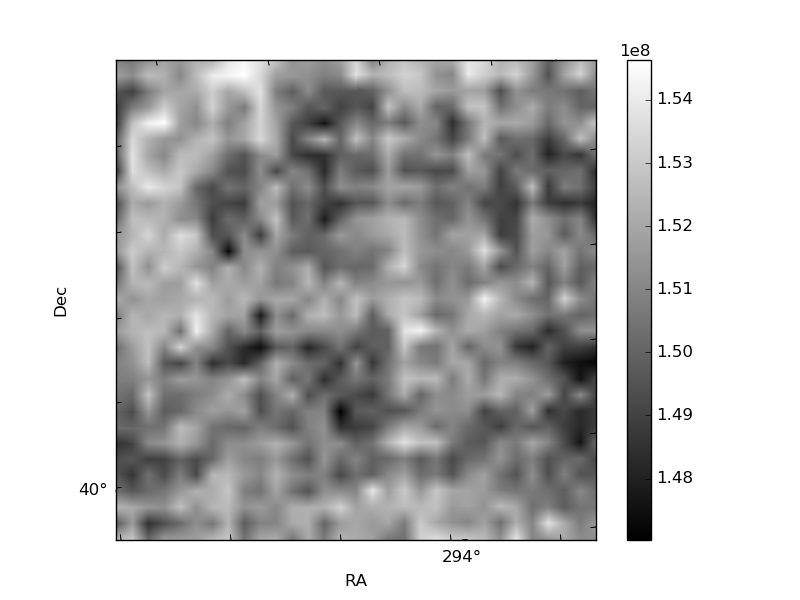
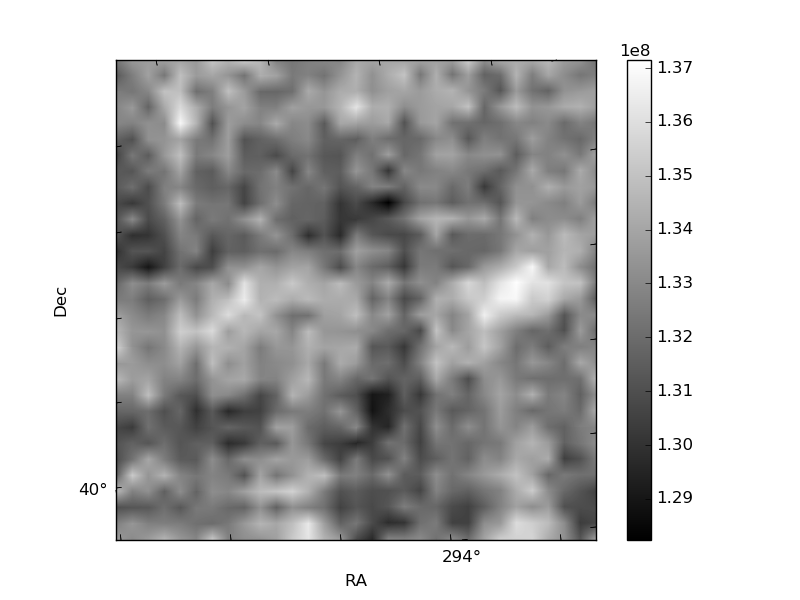
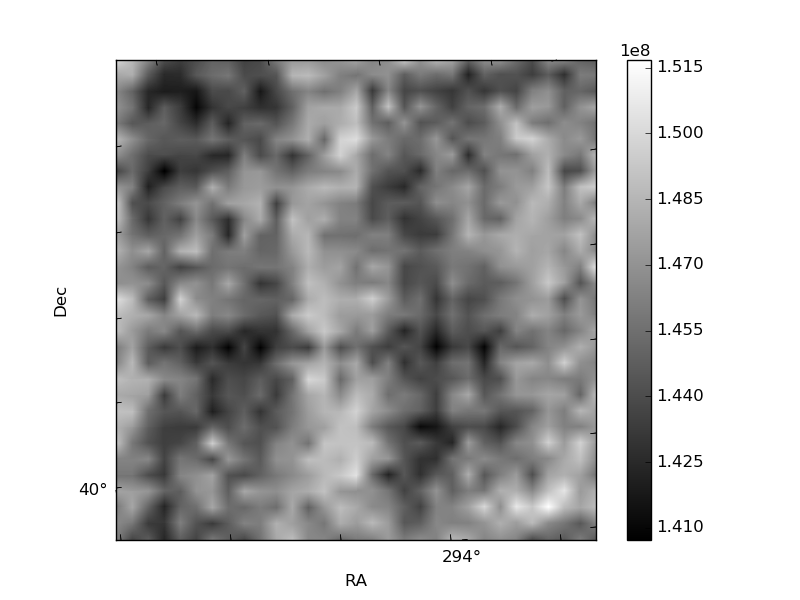
Histogram calculated using DETX and DETY for each event in the final _common_clean file
| Quadrant A | 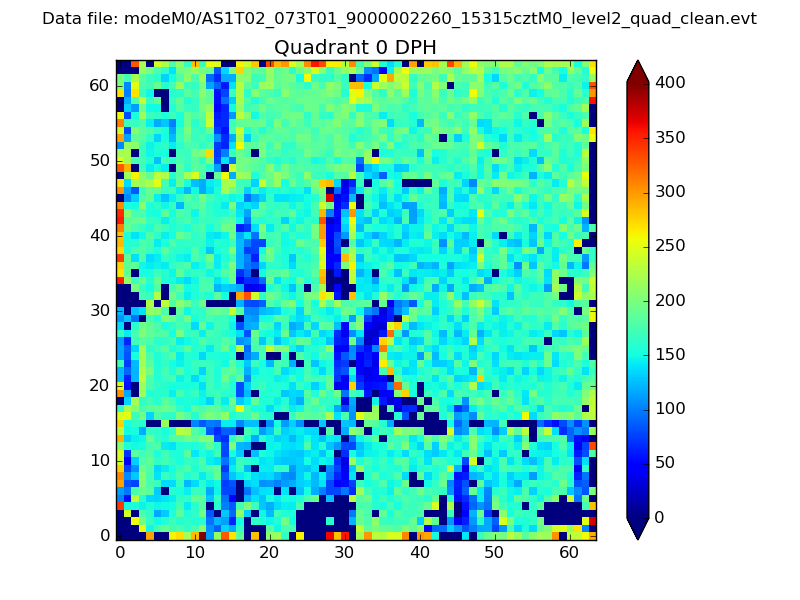 |
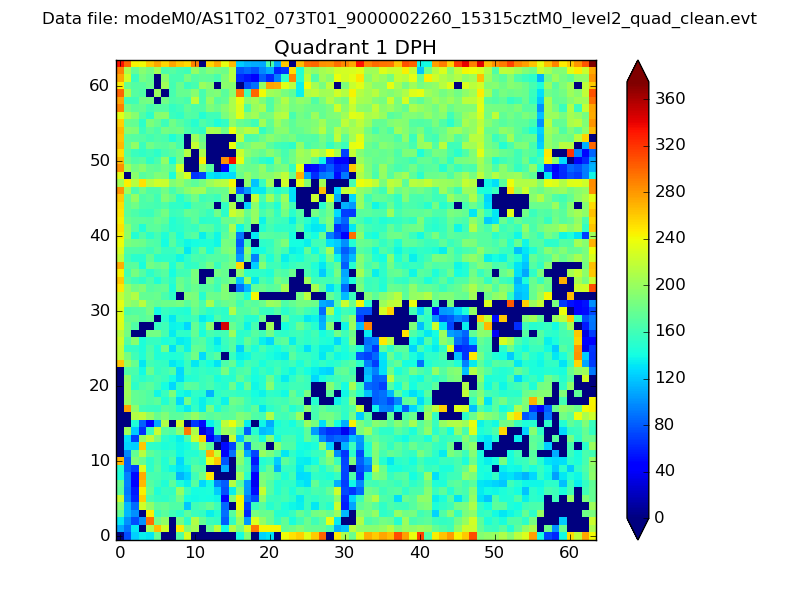 |
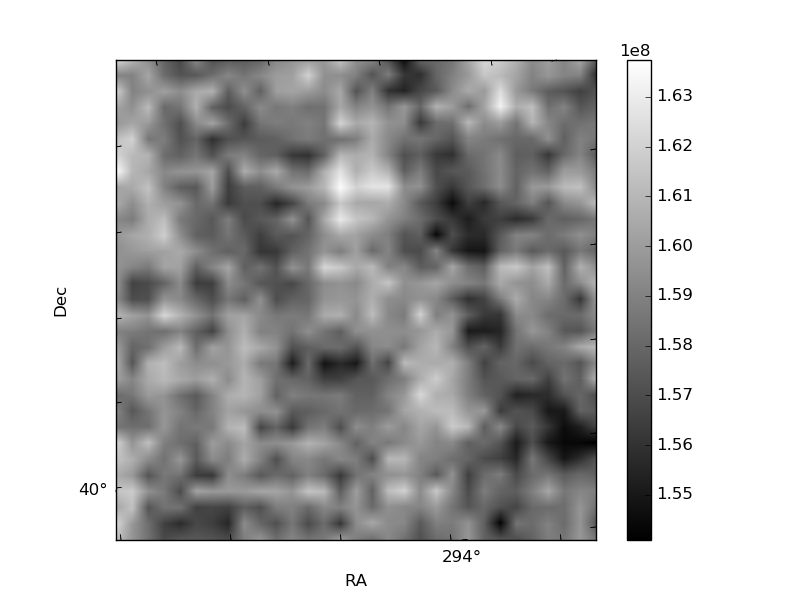
Quadrant B |
|---|---|---|---|
| Quadrant D | 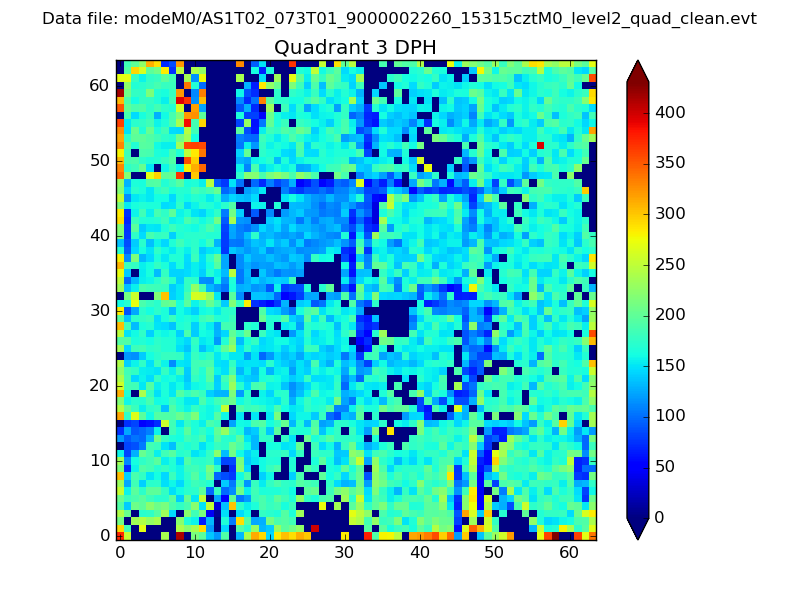 |
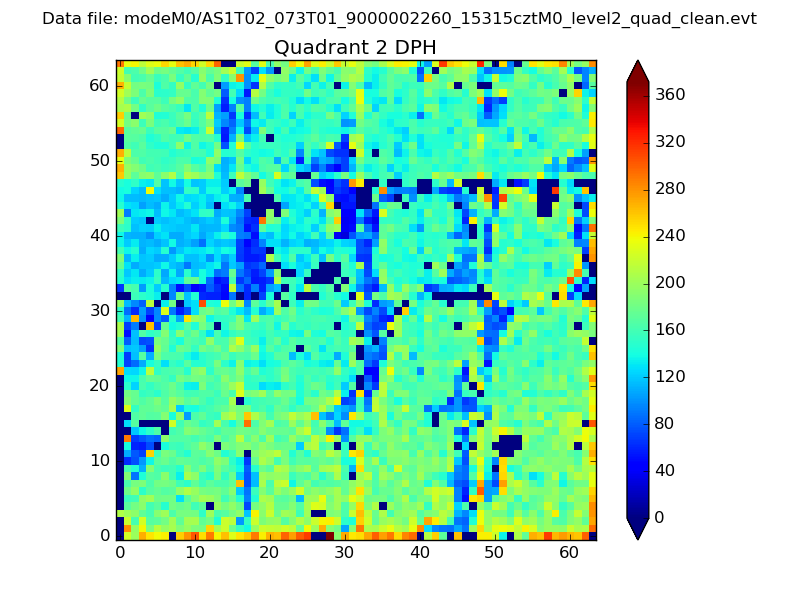 |
Quadrant C |
| Plot type | Count rate plots | Images |
|---|---|---|
| Comparison with Poisson distribution Blue bars denote a histogram of data divided into 1 sec bins. Red curve is a Poisson curve with rate = median count rate of data. |
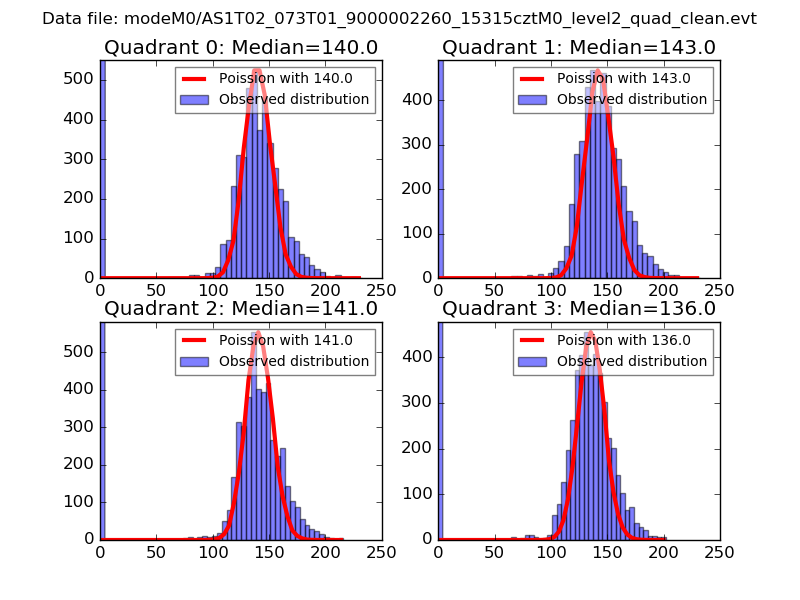 |
 |
| Quadrant-wise count rates Data is divided into 100 sec bins |
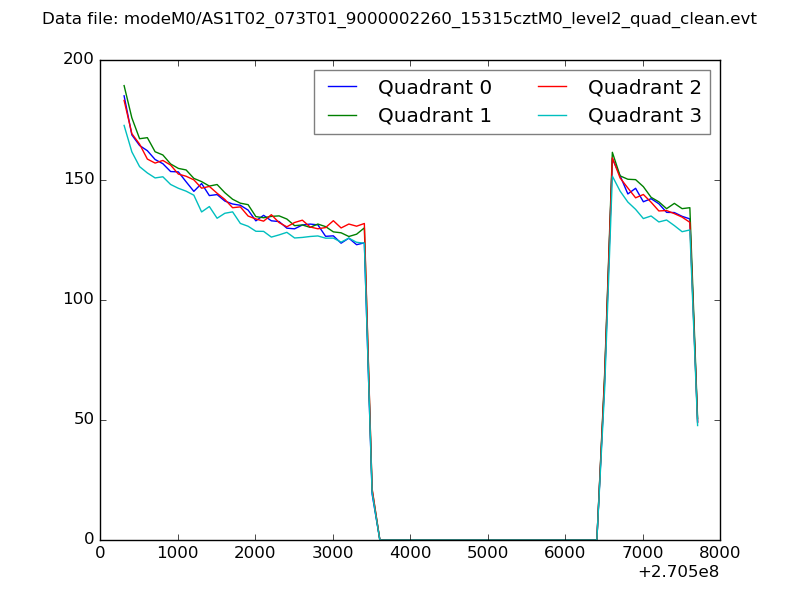 |
|
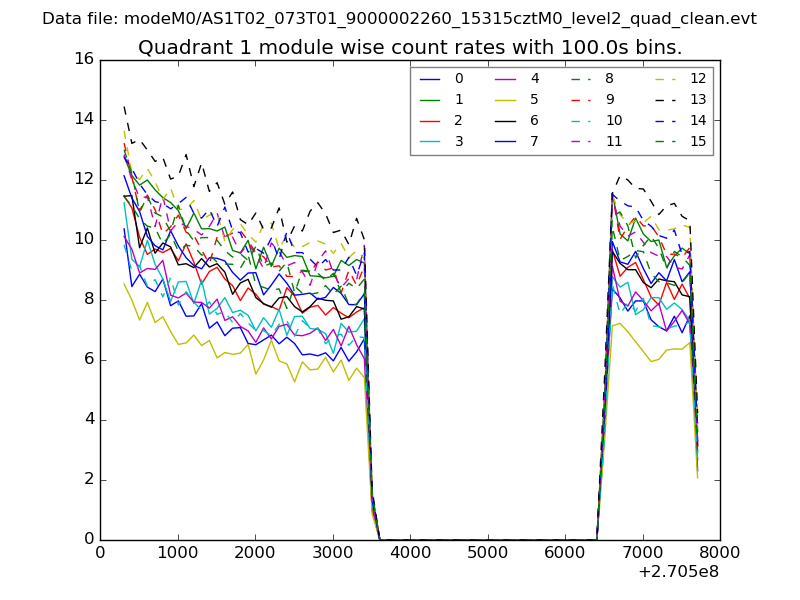
| Module-wise count rates for Quadrant A Data is divided into 100 sec bins |
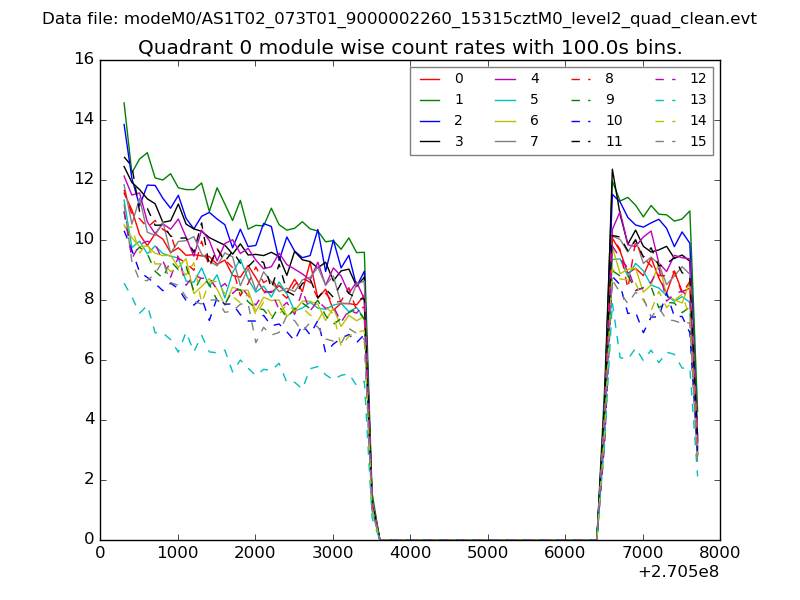 |
 |
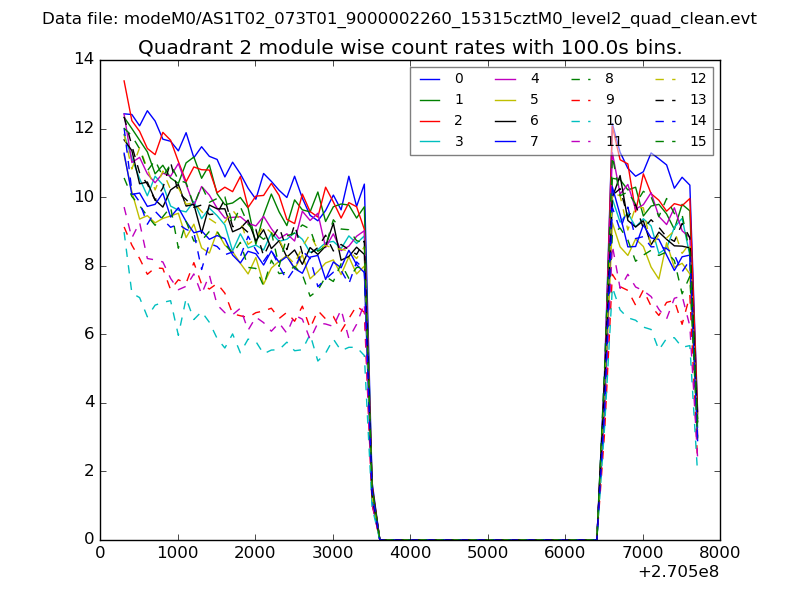
| Module-wise count rates for Quadrant B Data is divided into 100 sec bins |
 |
 |
| Module-wise count rates for Quadrant C Data is divided into 100 sec bins |
 |
 |
| Module-wise count rates for Quadrant D Data is divided into 100 sec bins |
 |
 |
| Parameter | Plot |
|---|---|
| CZT HV Monitor | 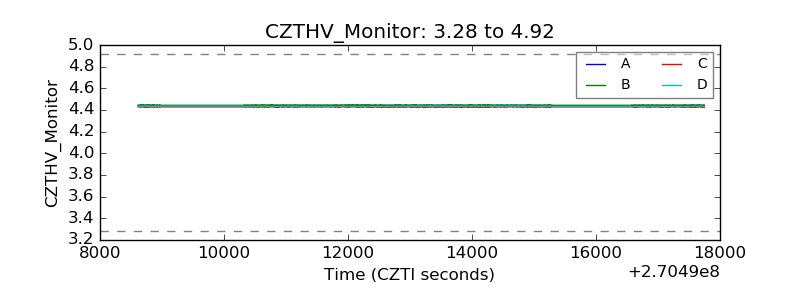 |
| D_VDD | 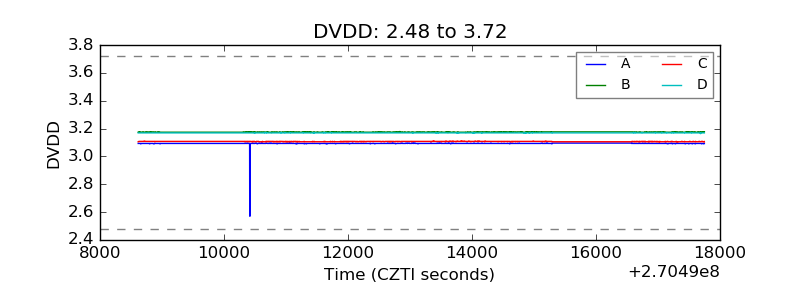 |
| Temperature 1 |  |
| Veto HV Monitor | 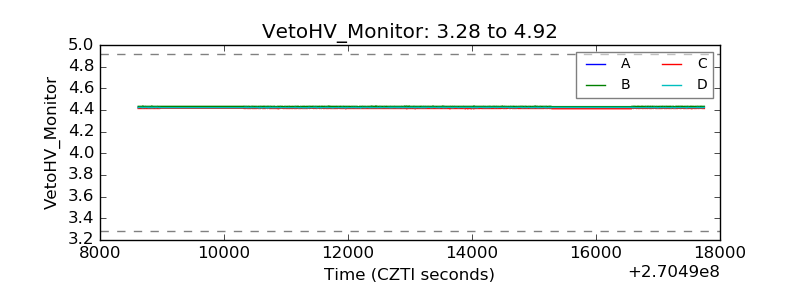 |
| Veto LLD | 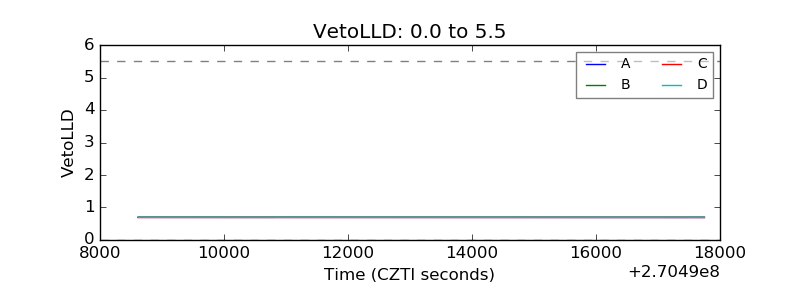 |
| Alpha Counter | 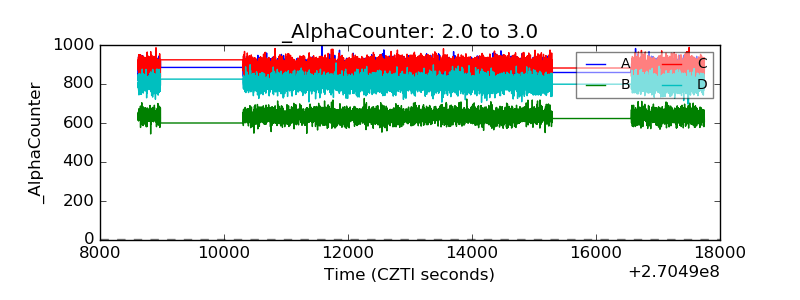 |
| _CPM_Rate | 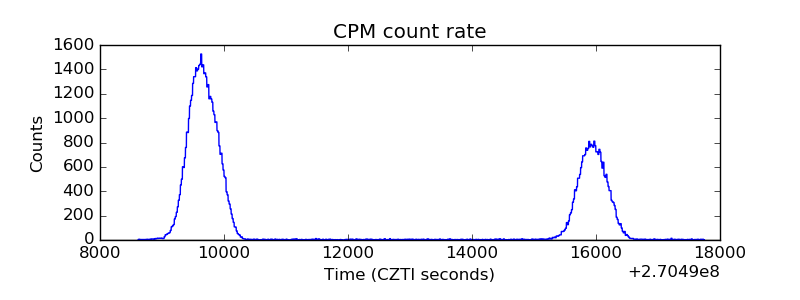 |
| CZT Counter | 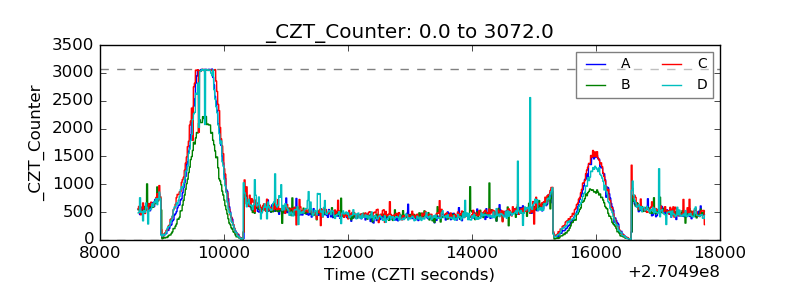 |
| +2.5 Volts monitor |  |
| +5 Volts monitor |  |
| _ROLL_ROT | 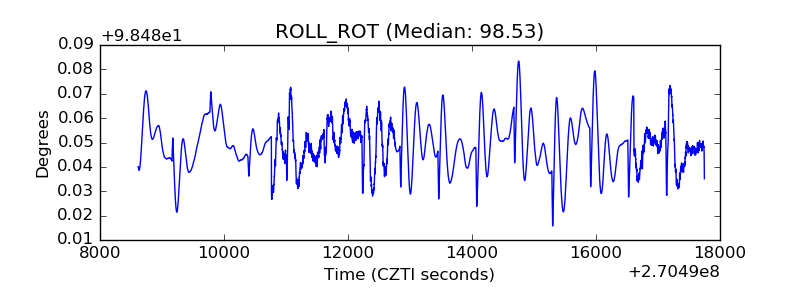 |
| _Roll_DEC |  |
| _Roll_RA | 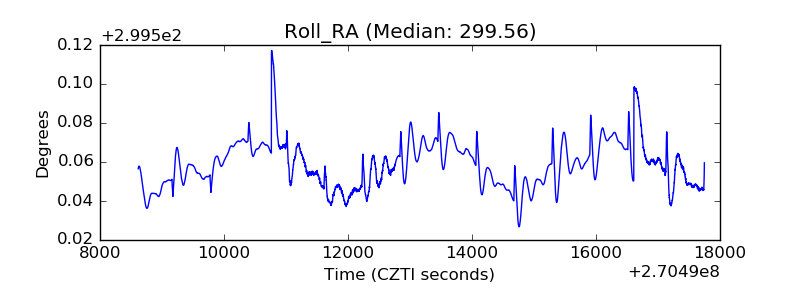 |
| Veto Counter | 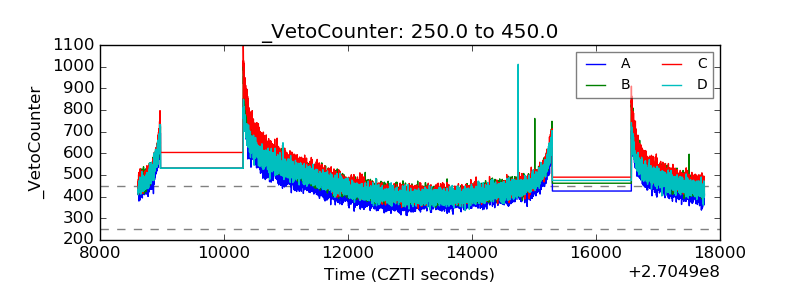 |