| Param | Original file | Final file |
|---|---|---|
| Filename | modeM0/AS1T02_073T01_9000002260_15318cztM0_level2.evt | modeM0/AS1T02_073T01_9000002260_15318cztM0_level2_quad_clean.evt |
| Size (bytes) | 593,012,160 | 113,909,760 |
| Size | 565.5 MB | 108.6 MB |
| Events in quadrant A | 5,454,404 | 705,104 |
| Events in quadrant B | 3,799,358 | 750,883 |
| Events in quadrant C | 4,025,433 | 737,414 |
| Events in quadrant D | 4,140,747 | 703,611 |
| Mode SS | |||
|---|---|---|---|
| Quadrant | BADHDUFLAG | Total packets | Discarded packets |
| A | 0 | 160 | 0 |
| B | 0 | 160 | 0 |
| C | 0 | 160 | 0 |
| D | 0 | 160 | 0 |
| Mode M0 | |||
|---|---|---|---|
| Quadrant | BADHDUFLAG | Total packets | Discarded packets |
| A | 0 | 21893 | 3 |
| B | 0 | 16621 | 2 |
| C | 0 | 17035 | 2 |
| D | 0 | 18064 | 2 |
| Mode M9 | |||
|---|---|---|---|
| Quadrant | BADHDUFLAG | Total packets | Discarded packets |
| A | 0 | 10 | 0 |
| B | 0 | 10 | 0 |
| C | 0 | 10 | 0 |
| D | 0 | 10 | 0 |
| Quadrant | Total seconds | Saturated seconds | Saturation percentage |
|---|---|---|---|
| A | 7957 | 919 | 11.549579% |
| B | 7957 | 109 | 1.369863% |
| C | 7957 | 46 | 0.578107% |
| D | 7957 | 125 | 1.570944% |
Noise dominated data is calculated using 1-second bins in cleaned event files. If a bin has >2000 counts, and if more than 50% of those come from <1% of pixels, then it is considered to be noise-dominated and hence unusable.
| Quadrant | # 1 sec bins | Bins with >0 counts | Bins with >2000 counts | High rate bins dominated by noise | Noise dominated (total time) | Noise dominated (detector-on time) | Marked lightcurve |
|---|---|---|---|---|---|---|---|
| A | 8858 | 7959 | 443 | 443 | 5.00% | 5.57% | 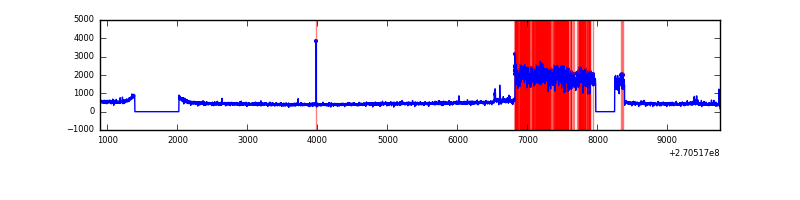 |
| B | 8858 | 7960 | 8 | 8 | 0.09% | 0.10% | 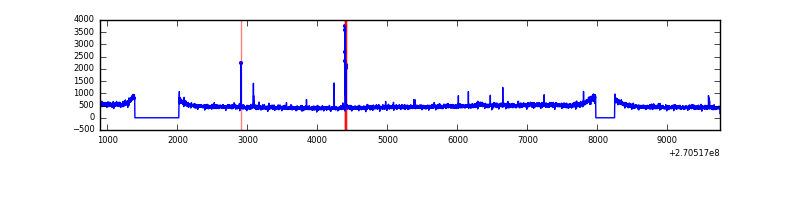 |
| C | 8858 | 7960 | 0 | 0 | 0.00% | 0.00% | 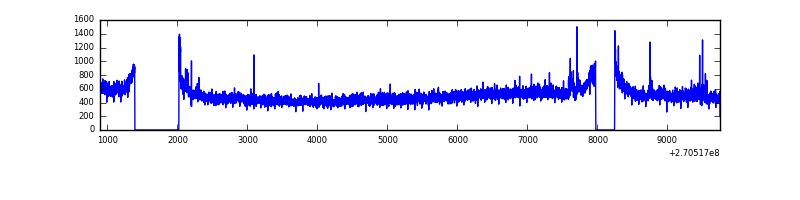 |
| D | 8858 | 7960 | 67 | 67 | 0.76% | 0.84% | 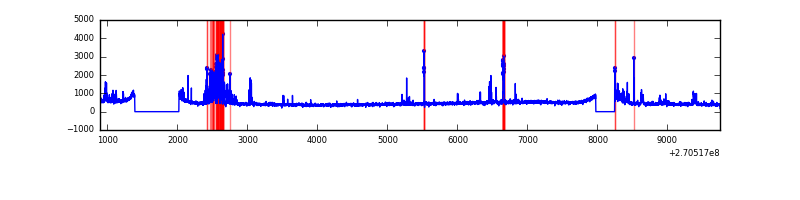 |
Top three noisy pixels from each quadrant. If the there are fewer than three noisy pixels in the level2.evt file, extra rows are filled as -1
| Pixel properties | Quadrant properties | ||||||
|---|---|---|---|---|---|---|---|
| Quadrant | DetID | PixID | Counts | Sigma | Mean | Median | Sigma |
| A | 15 | 239 | 1879063 | 10049.71 | 928 | 907 | 186.9 |
| A | 0 | 226 | 8129 | 38.64 | 928 | 907 | 186.9 |
| A | 9 | 143 | 7482 | 35.18 | 928 | 907 | 186.9 |
| B | 0 | 189 | 40361 | 212.91 | 958 | 934 | 185.2 |
| B | 12 | 111 | 22805 | 118.1 | 958 | 934 | 185.2 |
| B | 11 | 111 | 19351 | 99.45 | 958 | 934 | 185.2 |
| C | 3 | 233 | 369412 | 1696.84 | 936 | 941 | 217.2 |
| C | 13 | 61 | 6560 | 25.88 | 936 | 941 | 217.2 |
| C | 7 | 221 | 3843 | 13.36 | 936 | 941 | 217.2 |
| D | 13 | 122 | 412819 | 1806.67 | 929 | 899 | 228.0 |
| D | 2 | 33 | 143126 | 623.8 | 929 | 899 | 228.0 |
| D | 8 | 195 | 38907 | 166.7 | 929 | 899 | 228.0 |
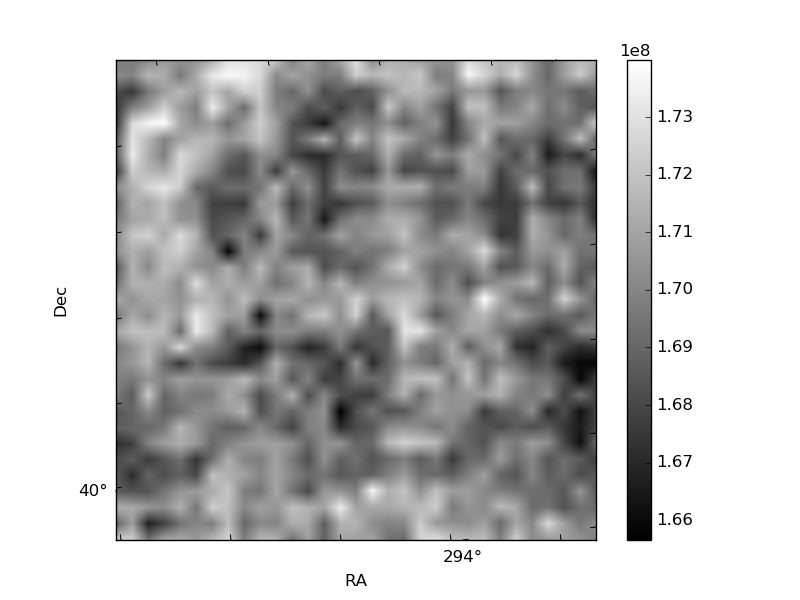
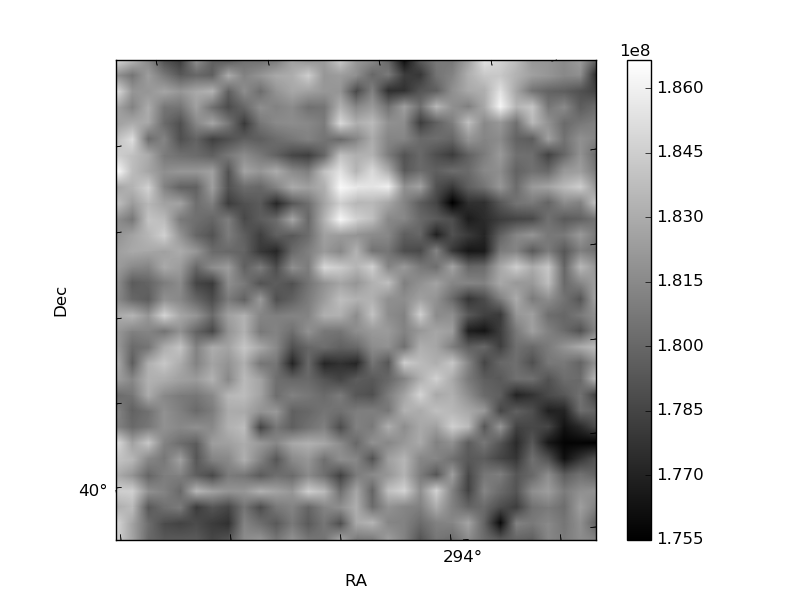
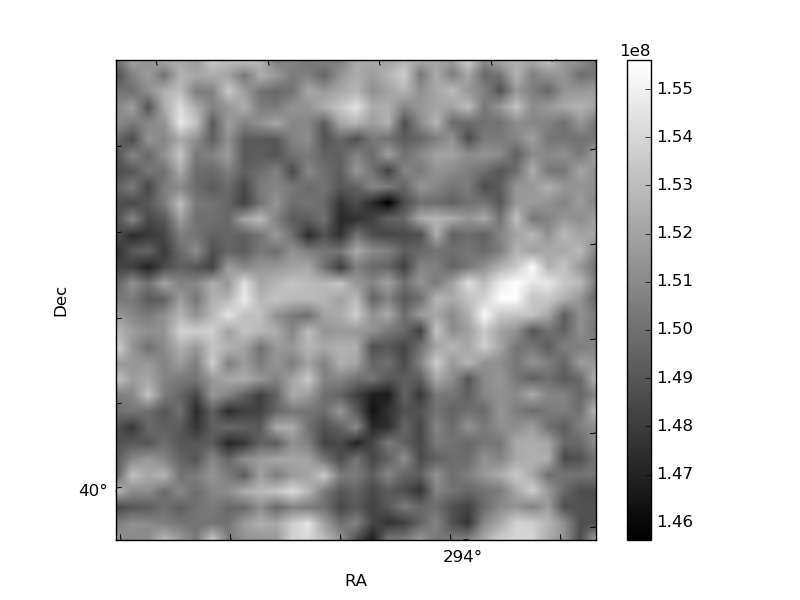
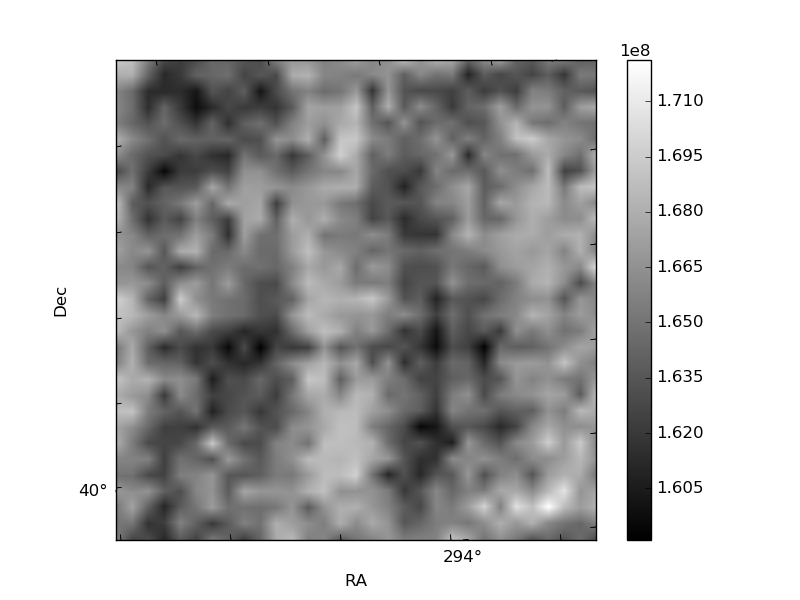
Histogram calculated using DETX and DETY for each event in the final _common_clean file
| Quadrant A | 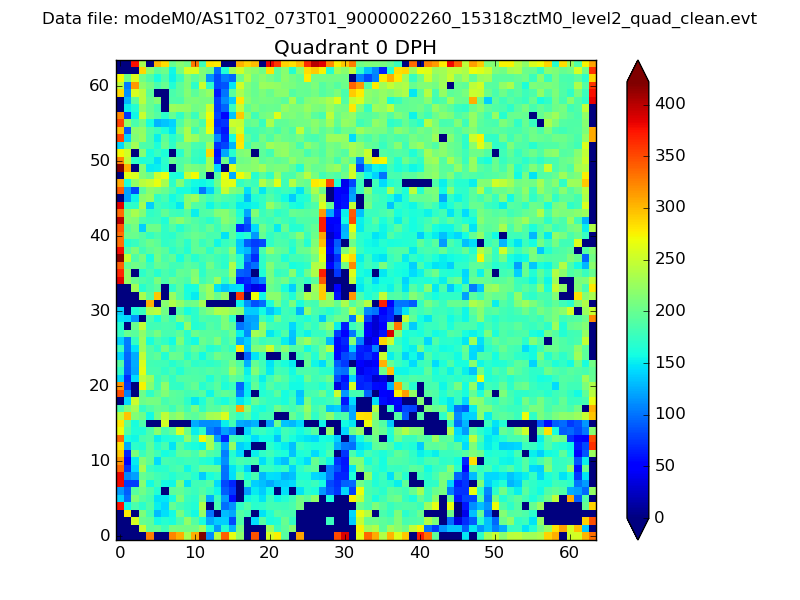 |
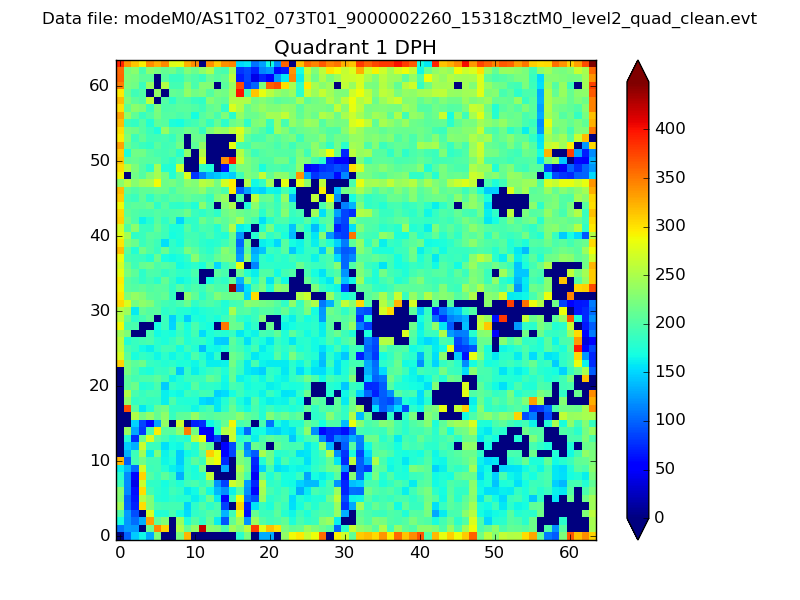 |
Quadrant B |
|---|---|---|---|
| Quadrant D |  |
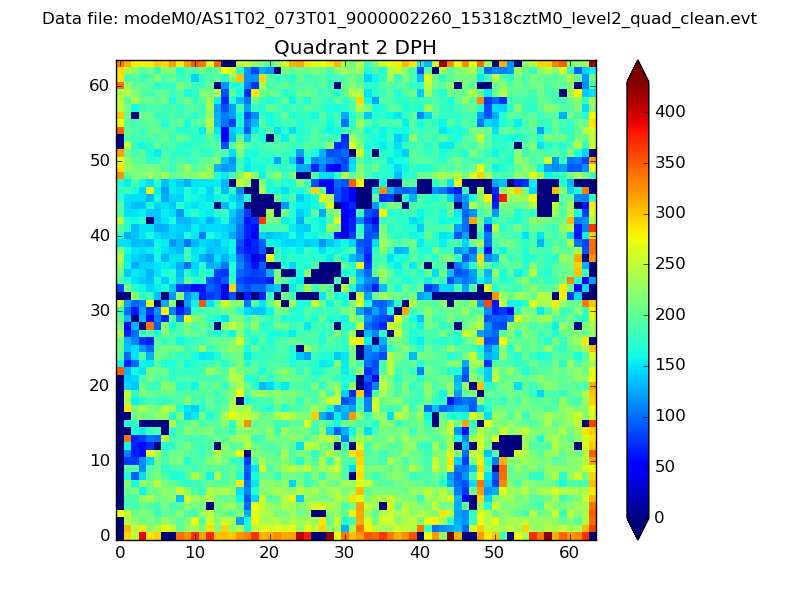 |
Quadrant C |
| Plot type | Count rate plots | Images |
|---|---|---|
| Comparison with Poisson distribution Blue bars denote a histogram of data divided into 1 sec bins. Red curve is a Poisson curve with rate = median count rate of data. |
 |
 |
| Quadrant-wise count rates Data is divided into 100 sec bins |
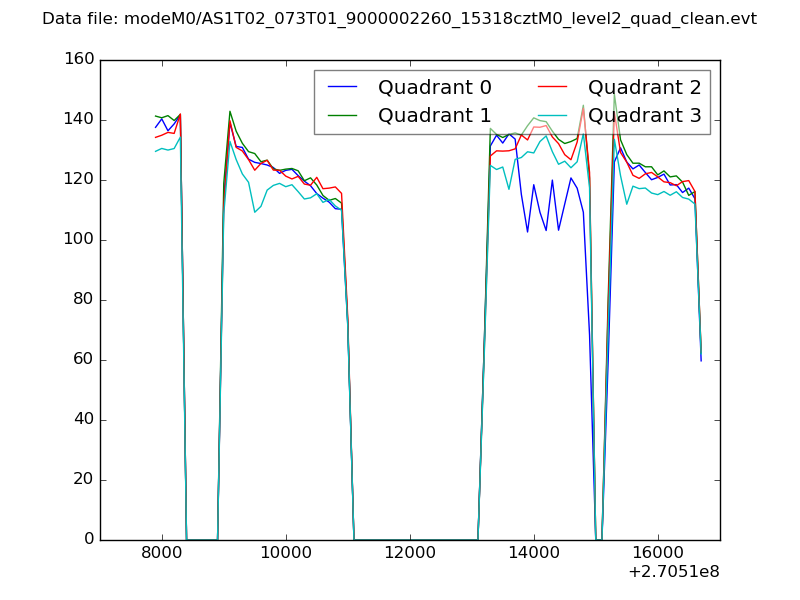 |
|
| Module-wise count rates for Quadrant A Data is divided into 100 sec bins |
 |
 |
| Module-wise count rates for Quadrant B Data is divided into 100 sec bins |
 |
 |
| Module-wise count rates for Quadrant C Data is divided into 100 sec bins |
 |
 |
| Module-wise count rates for Quadrant D Data is divided into 100 sec bins |
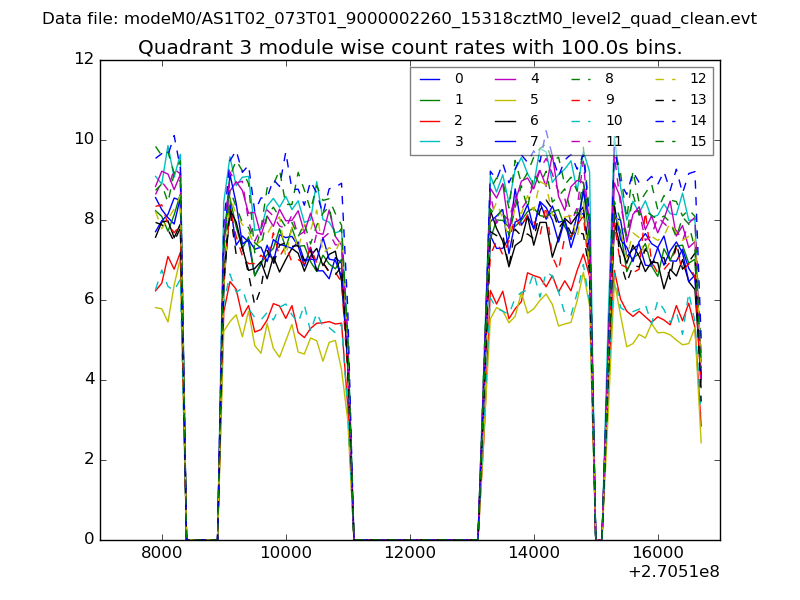 |
 |
| Parameter | Plot |
|---|---|
| CZT HV Monitor |  |
| D_VDD | 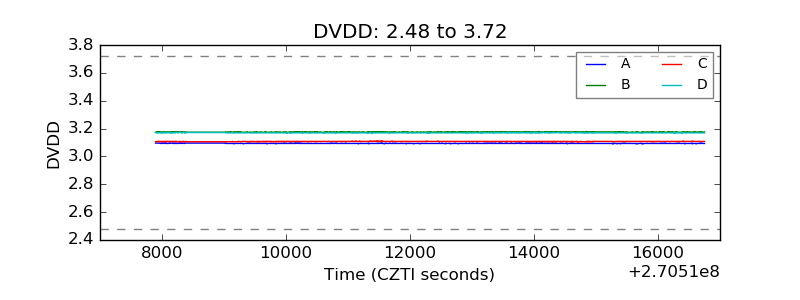 |
| Temperature 1 | 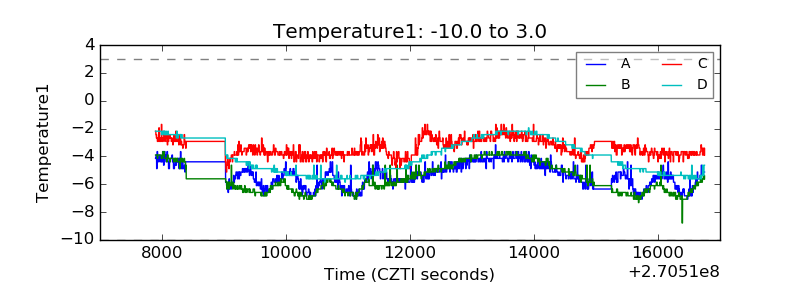 |
| Veto HV Monitor | 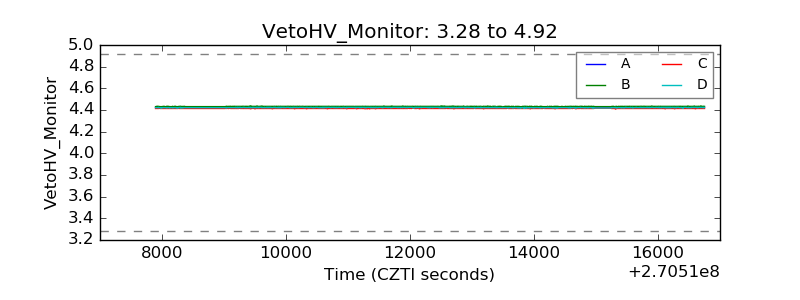 |
| Veto LLD | 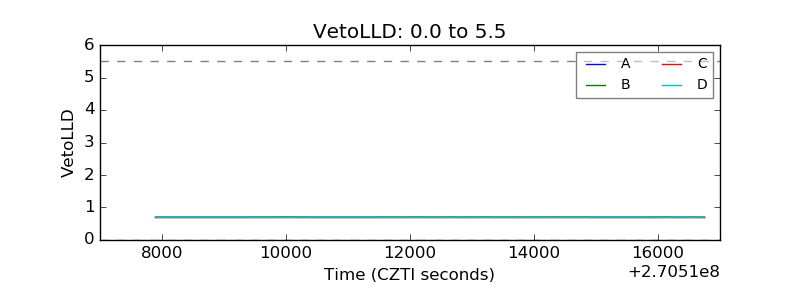 |
| Alpha Counter | 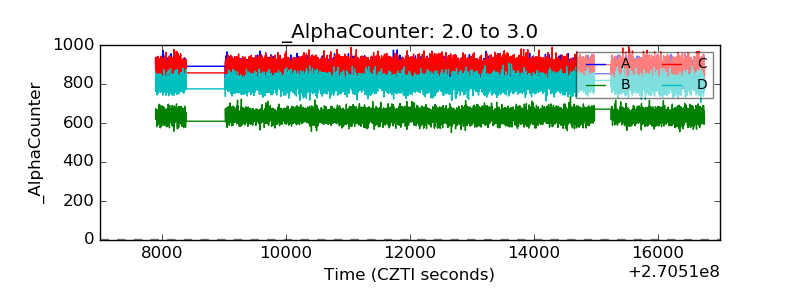 |
| _CPM_Rate | 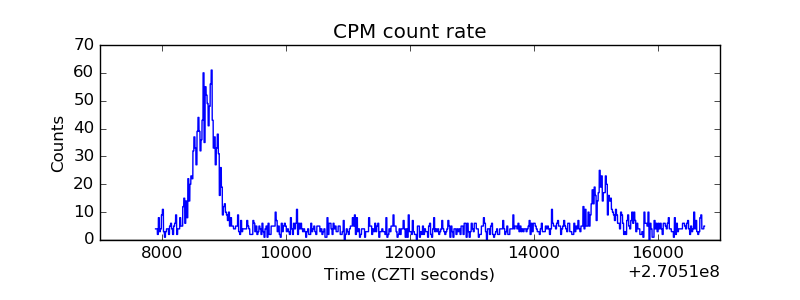 |
| CZT Counter | 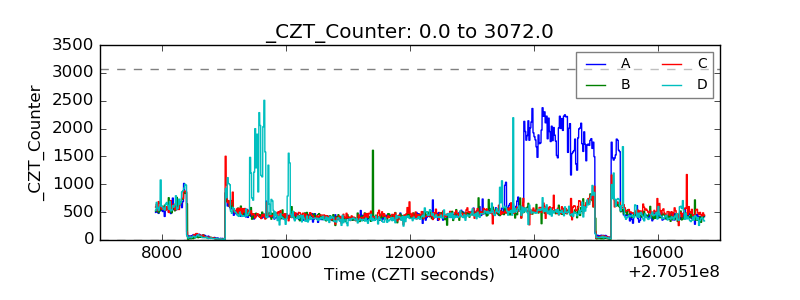 |
| +2.5 Volts monitor |  |
| +5 Volts monitor |  |
| _ROLL_ROT | 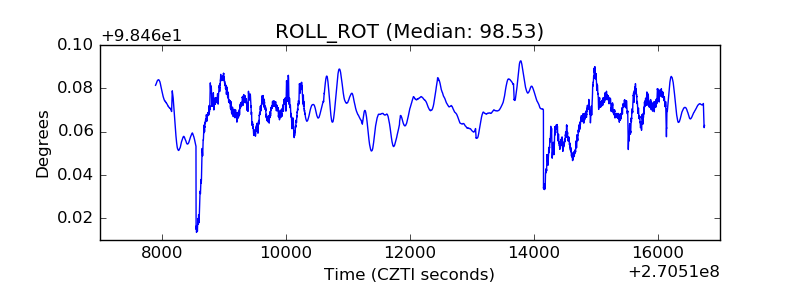 |
| _Roll_DEC | 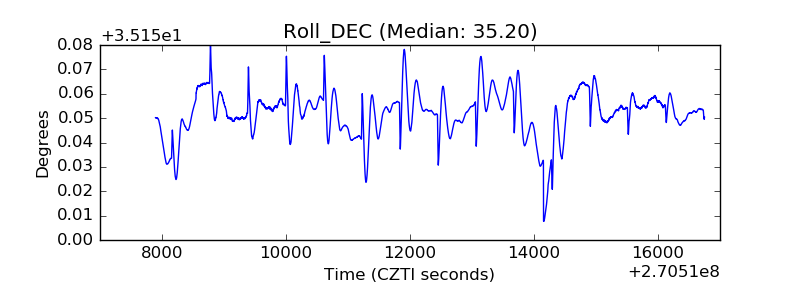 |
| _Roll_RA | 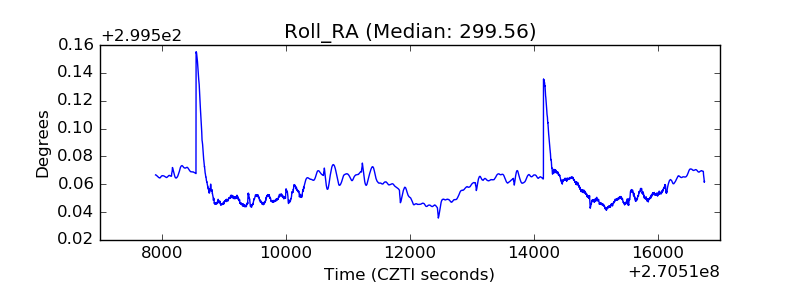 |
| Veto Counter |  |