| Param | Original file | Final file |
|---|---|---|
| Filename | modeM0/AS1T02_073T01_9000002260_15319cztM0_level2.evt | modeM0/AS1T02_073T01_9000002260_15319cztM0_level2_quad_clean.evt |
| Size (bytes) | 551,471,040 | 109,327,680 |
| Size | 525.9 MB | 104.3 MB |
| Events in quadrant A | 4,395,167 | 681,931 |
| Events in quadrant B | 3,748,437 | 709,297 |
| Events in quadrant C | 4,192,374 | 698,395 |
| Events in quadrant D | 3,826,709 | 669,788 |
| Mode SS | |||
|---|---|---|---|
| Quadrant | BADHDUFLAG | Total packets | Discarded packets |
| A | 0 | 162 | 0 |
| B | 0 | 162 | 0 |
| C | 0 | 162 | 0 |
| D | 0 | 162 | 0 |
| Mode M0 | |||
|---|---|---|---|
| Quadrant | BADHDUFLAG | Total packets | Discarded packets |
| A | 0 | 18541 | 3 |
| B | 0 | 16505 | 2 |
| C | 0 | 17387 | 2 |
| D | 0 | 17080 | 2 |
| Mode M9 | |||
|---|---|---|---|
| Quadrant | BADHDUFLAG | Total packets | Discarded packets |
| A | 0 | 6 | 0 |
| B | 0 | 6 | 0 |
| C | 0 | 6 | 0 |
| D | 0 | 6 | 0 |
| Quadrant | Total seconds | Saturated seconds | Saturation percentage |
|---|---|---|---|
| A | 7934 | 480 | 6.049912% |
| B | 7934 | 193 | 2.432569% |
| C | 7934 | 94 | 1.184774% |
| D | 7934 | 112 | 1.411646% |
Noise dominated data is calculated using 1-second bins in cleaned event files. If a bin has >2000 counts, and if more than 50% of those come from <1% of pixels, then it is considered to be noise-dominated and hence unusable.
| Quadrant | # 1 sec bins | Bins with >0 counts | Bins with >2000 counts | High rate bins dominated by noise | Noise dominated (total time) | Noise dominated (detector-on time) | Marked lightcurve |
|---|---|---|---|---|---|---|---|
| A | 8490 | 7936 | 119 | 119 | 1.40% | 1.50% | 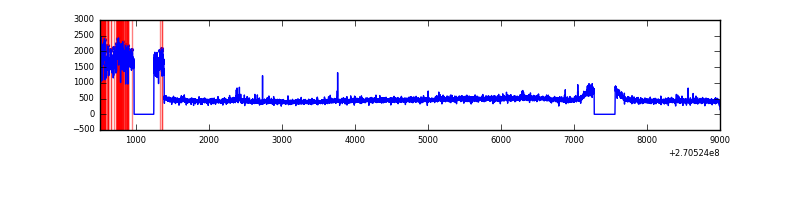 |
| B | 8490 | 7936 | 1 | 1 | 0.01% | 0.01% | 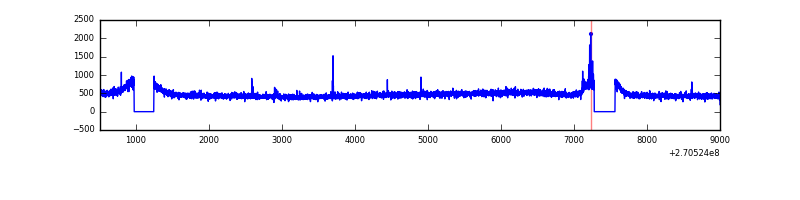 |
| C | 8490 | 7937 | 0 | 0 | 0.00% | 0.00% | 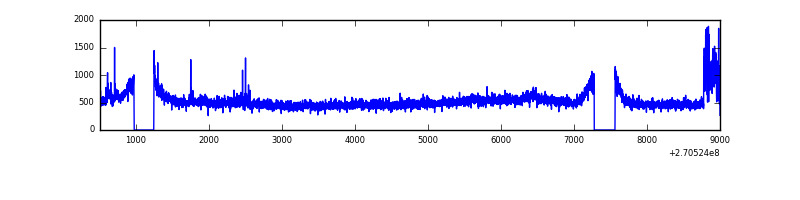 |
| D | 8490 | 7937 | 8 | 8 | 0.09% | 0.10% | 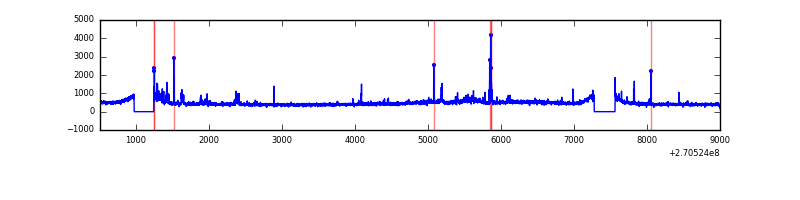 |
Top three noisy pixels from each quadrant. If the there are fewer than three noisy pixels in the level2.evt file, extra rows are filled as -1
| Pixel properties | Quadrant properties | ||||||
|---|---|---|---|---|---|---|---|
| Quadrant | DetID | PixID | Counts | Sigma | Mean | Median | Sigma |
| A | 15 | 239 | 787724 | 4140.81 | 935 | 913 | 190.0 |
| A | 9 | 143 | 14432 | 71.15 | 935 | 913 | 190.0 |
| A | 0 | 226 | 8044 | 37.53 | 935 | 913 | 190.0 |
| B | 3 | 64 | 27031 | 143.04 | 949 | 922 | 182.5 |
| B | 12 | 111 | 22792 | 119.81 | 949 | 922 | 182.5 |
| B | 11 | 111 | 19666 | 102.69 | 949 | 922 | 182.5 |
| C | 3 | 233 | 556705 | 2585.59 | 930 | 934 | 214.9 |
| C | 7 | 221 | 6922 | 27.86 | 930 | 934 | 214.9 |
| C | 13 | 61 | 6706 | 26.85 | 930 | 934 | 214.9 |
| D | 2 | 33 | 101910 | 452.97 | 924 | 896 | 223.0 |
| D | 13 | 122 | 88270 | 391.8 | 924 | 896 | 223.0 |
| D | 12 | 110 | 86017 | 381.7 | 924 | 896 | 223.0 |
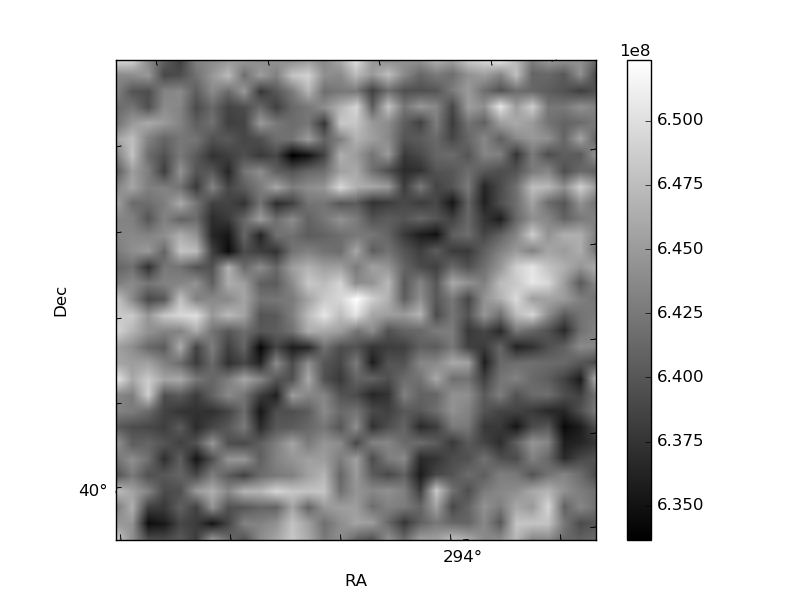
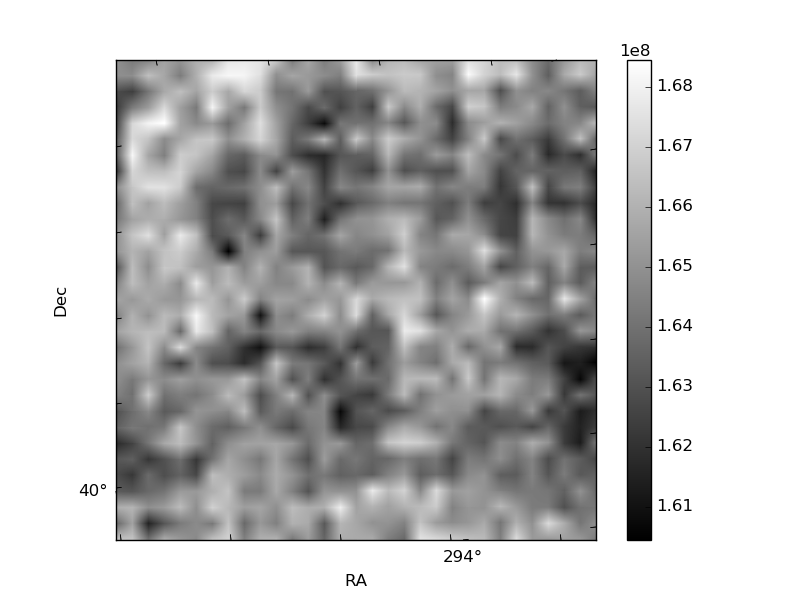
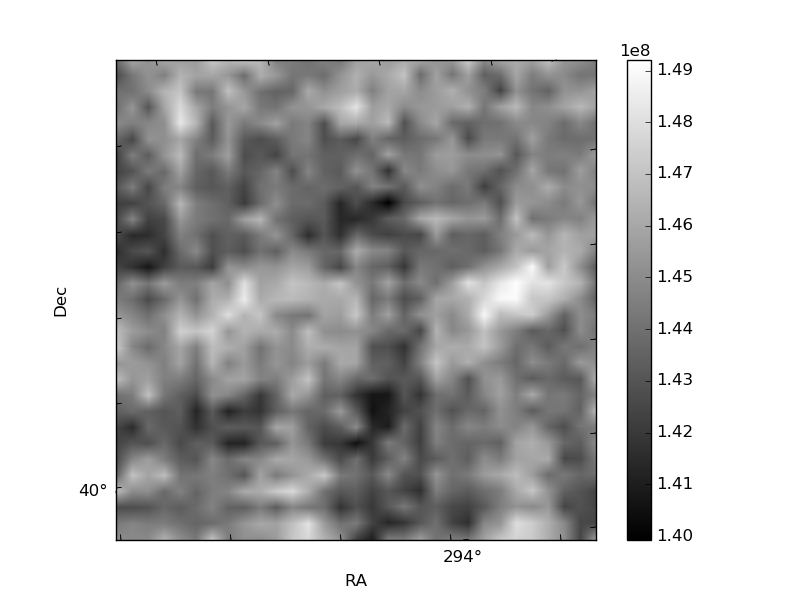
Histogram calculated using DETX and DETY for each event in the final _common_clean file
| Quadrant A | 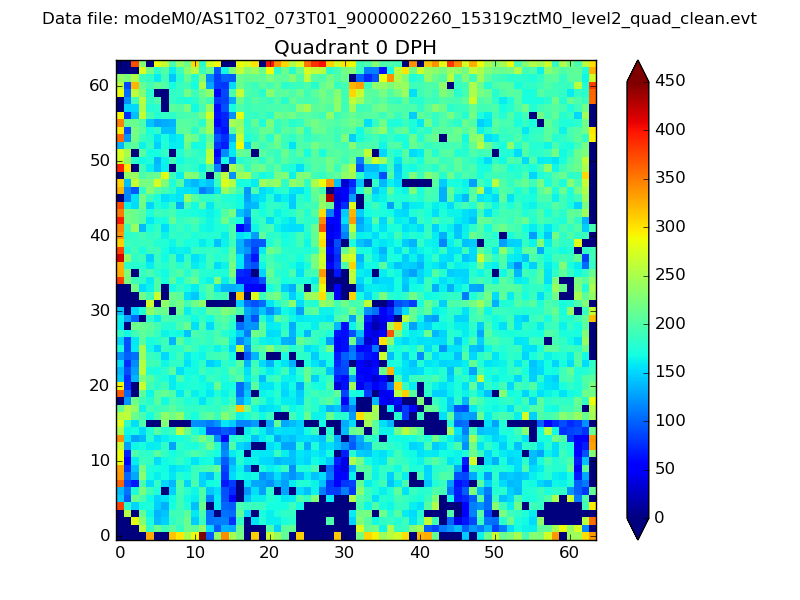 |
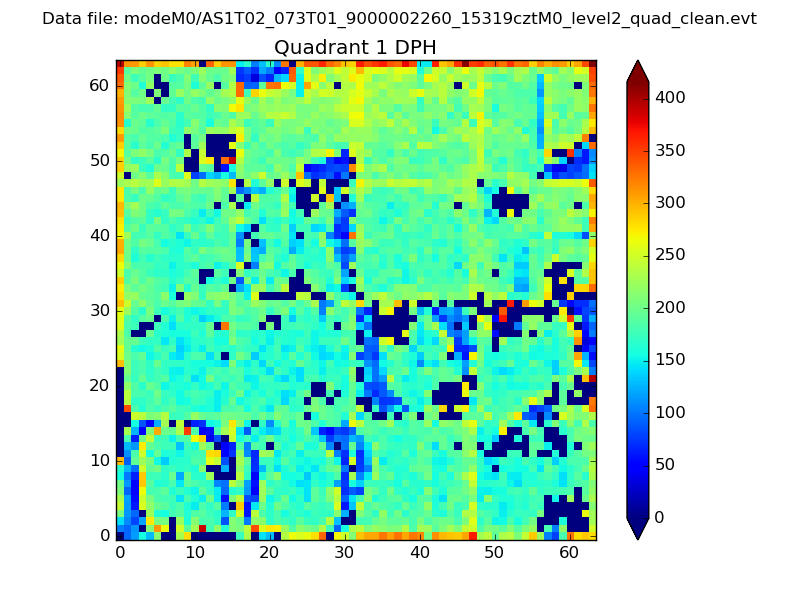 |
Quadrant B |
|---|---|---|---|
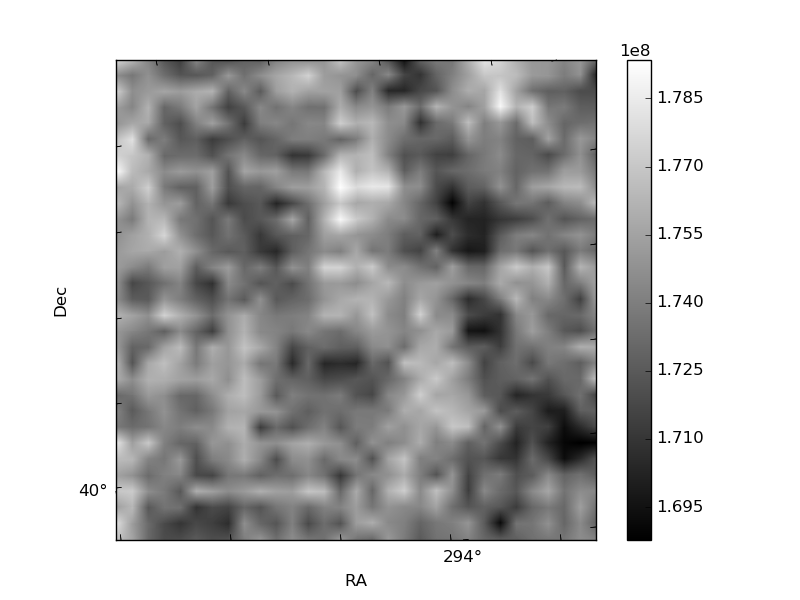
| Quadrant D | 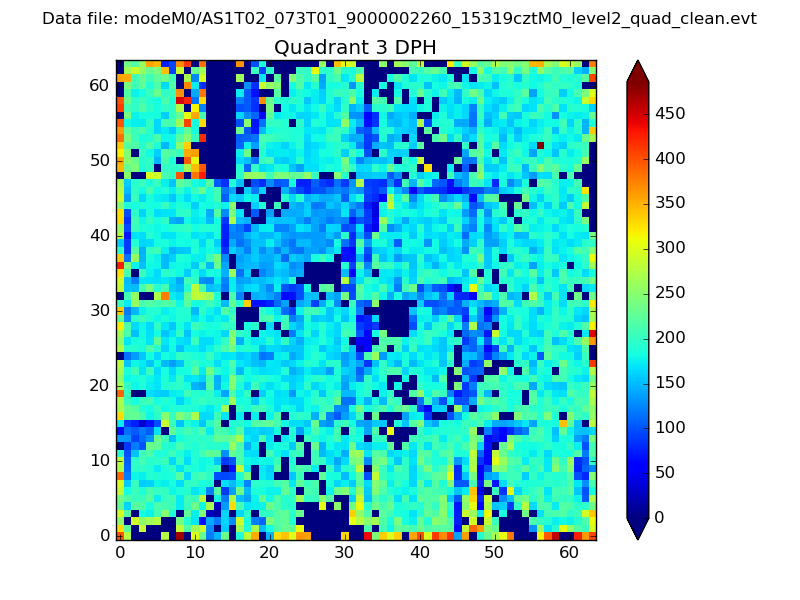 |
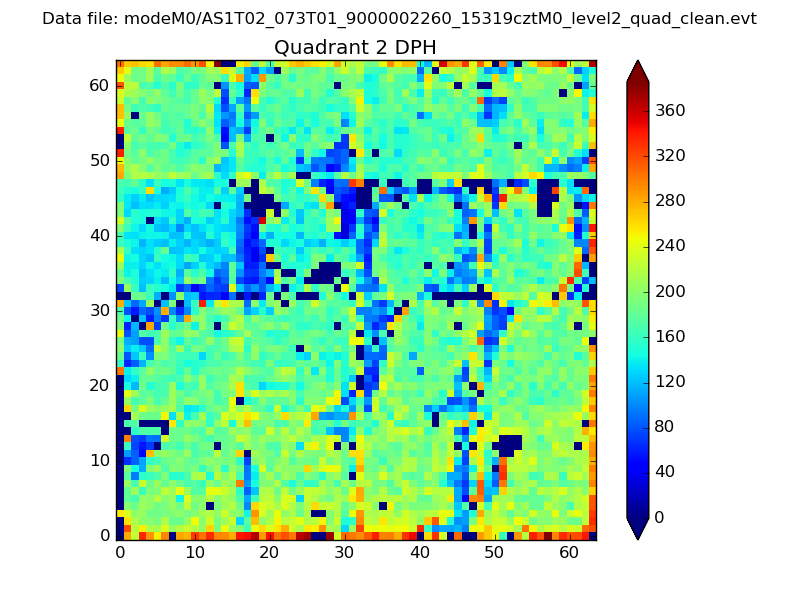 |
Quadrant C |
| Plot type | Count rate plots | Images |
|---|---|---|
| Comparison with Poisson distribution Blue bars denote a histogram of data divided into 1 sec bins. Red curve is a Poisson curve with rate = median count rate of data. |
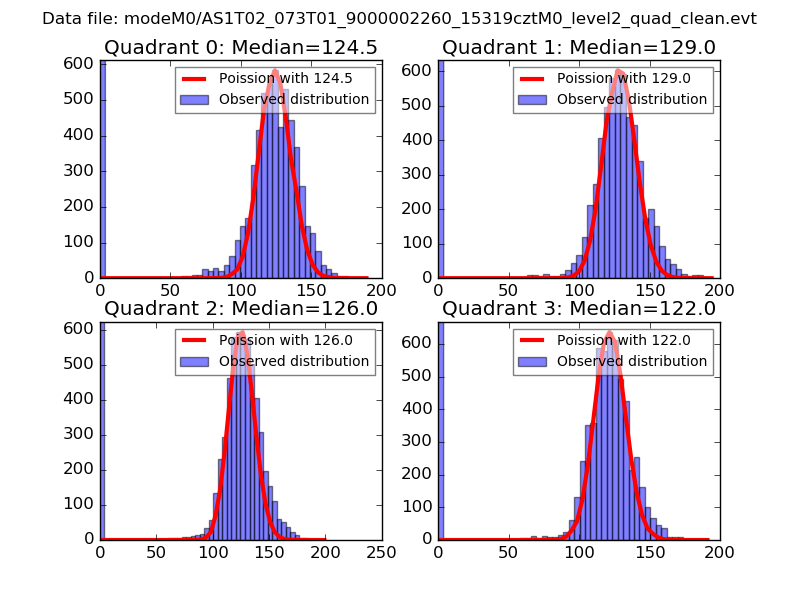 |
 |
| Quadrant-wise count rates Data is divided into 100 sec bins |
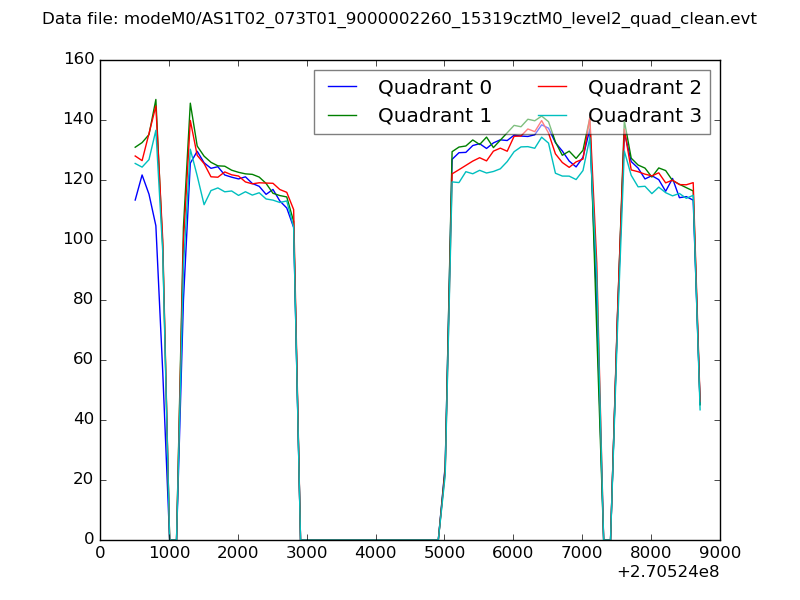 |
|
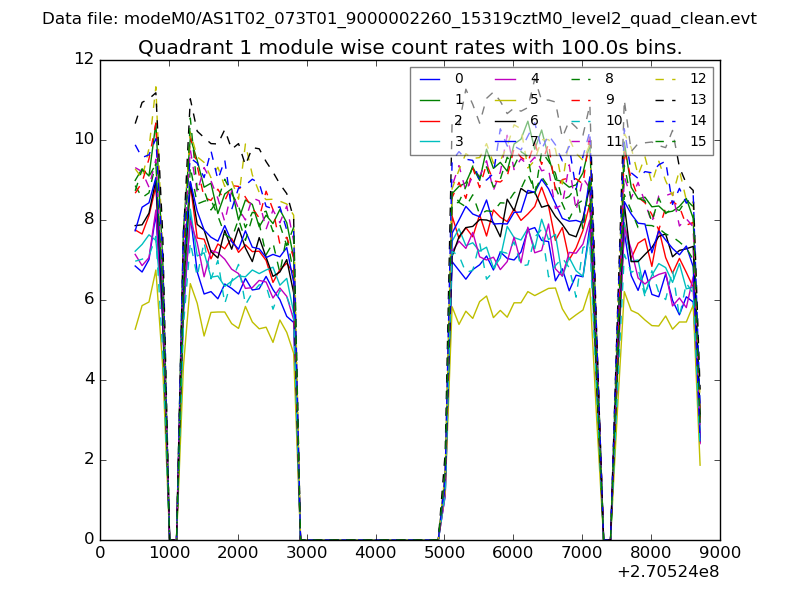
| Module-wise count rates for Quadrant A Data is divided into 100 sec bins |
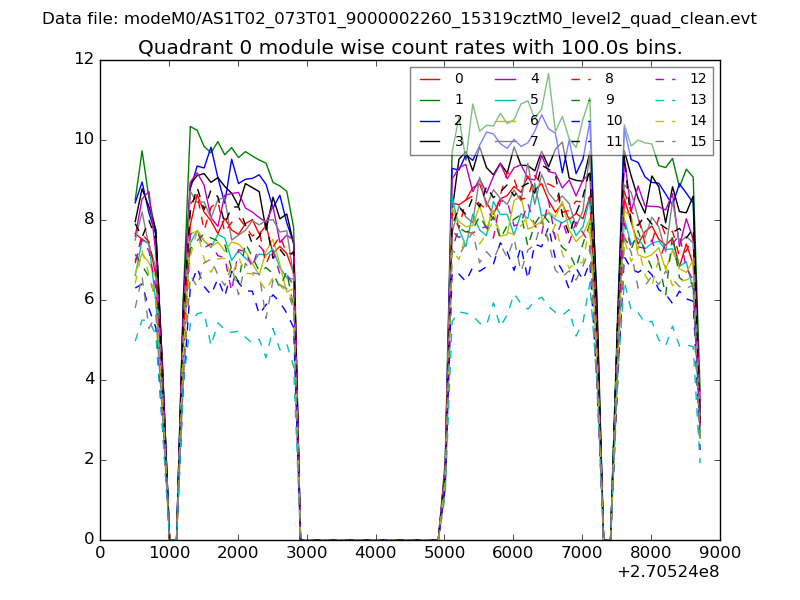 |
 |
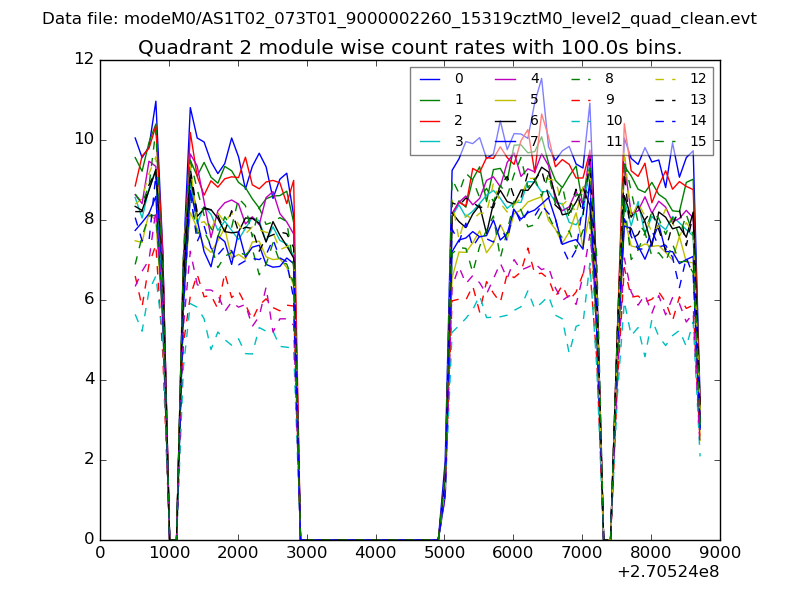
| Module-wise count rates for Quadrant B Data is divided into 100 sec bins |
 |
 |
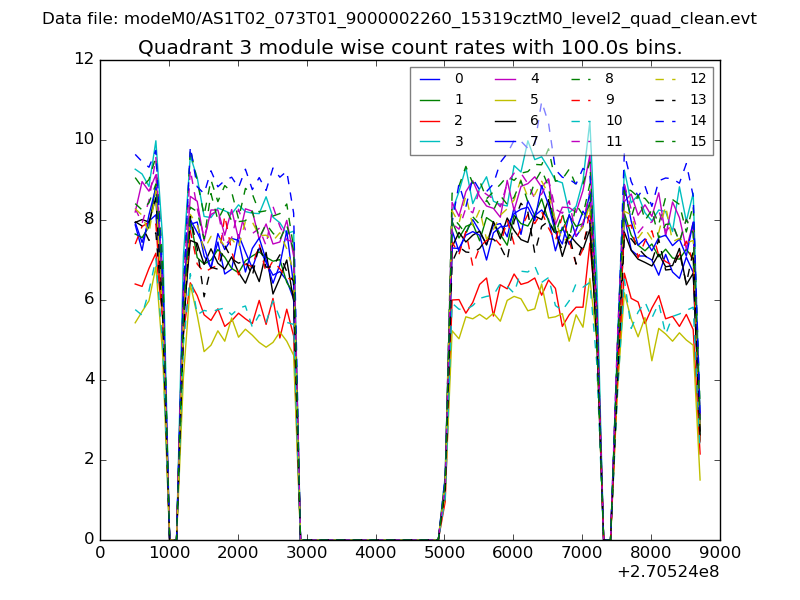
| Module-wise count rates for Quadrant C Data is divided into 100 sec bins |
 |
 |
| Module-wise count rates for Quadrant D Data is divided into 100 sec bins |
 |
 |
| Parameter | Plot |
|---|---|
| CZT HV Monitor |  |
| D_VDD | 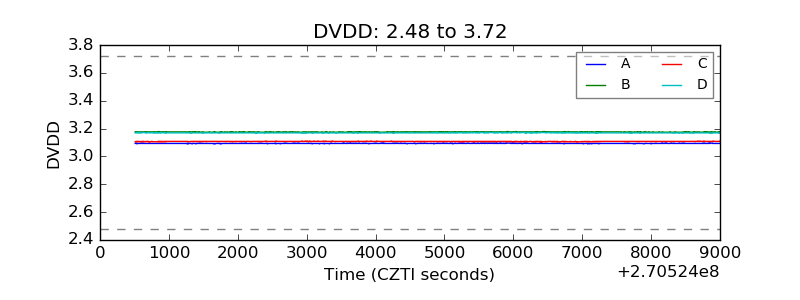 |
| Temperature 1 | 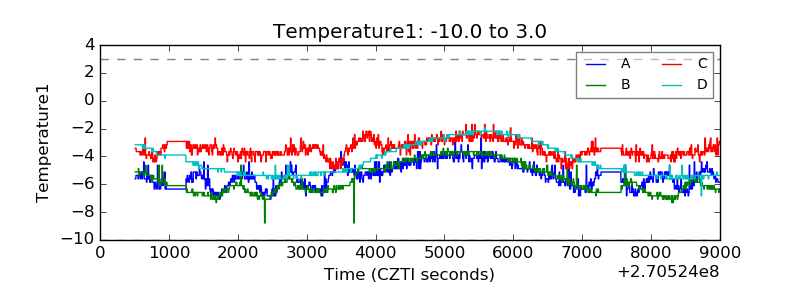 |
| Veto HV Monitor | 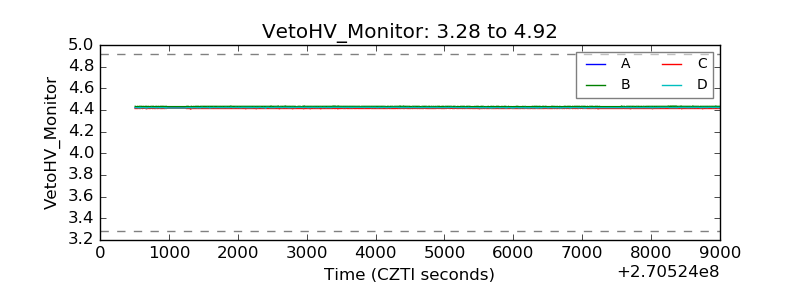 |
| Veto LLD | 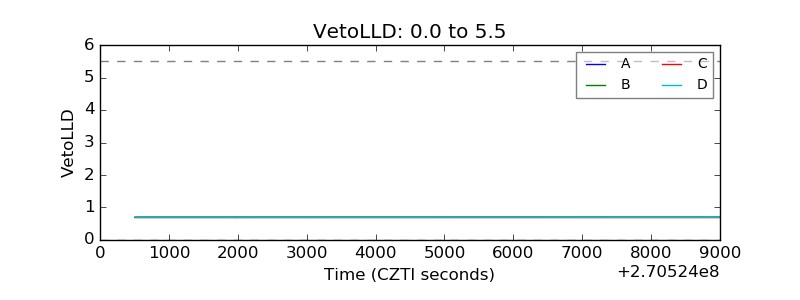 |
| Alpha Counter | 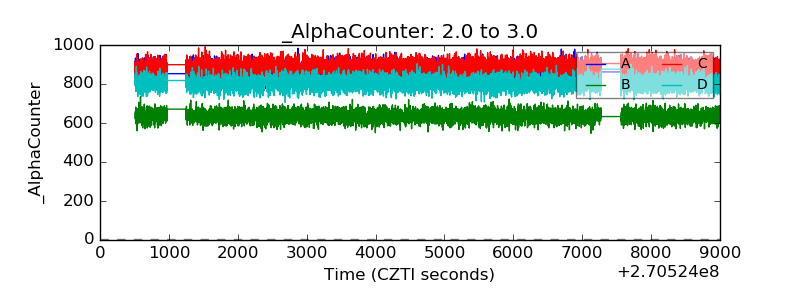 |
| _CPM_Rate | 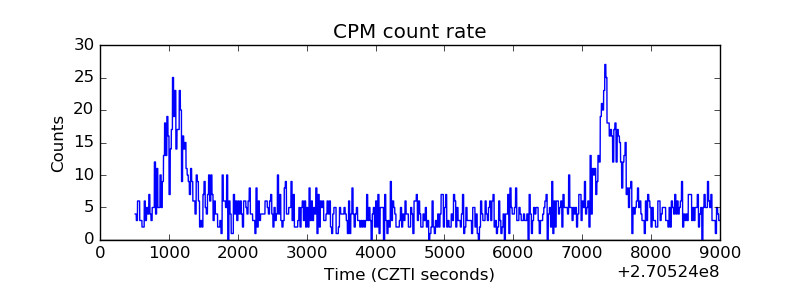 |
| CZT Counter | 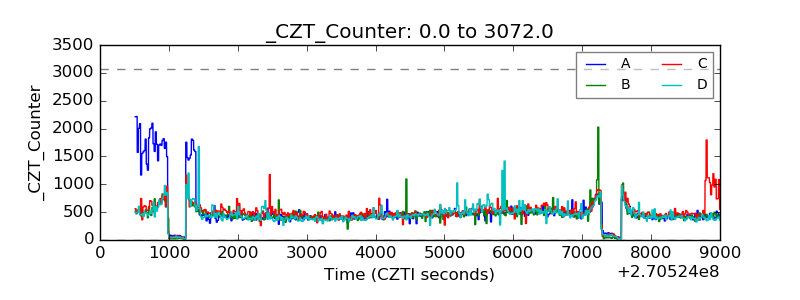 |
| +2.5 Volts monitor |  |
| +5 Volts monitor |  |
| _ROLL_ROT | 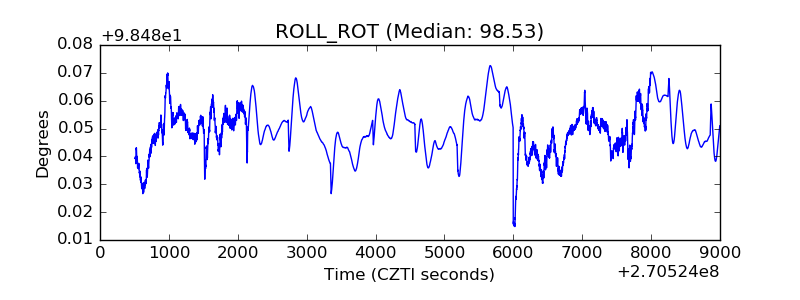 |
| _Roll_DEC | 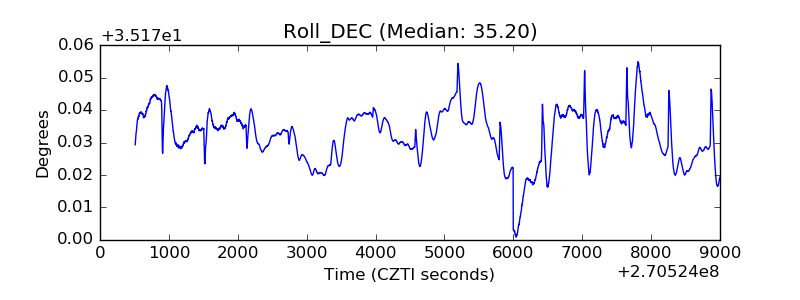 |
| _Roll_RA | 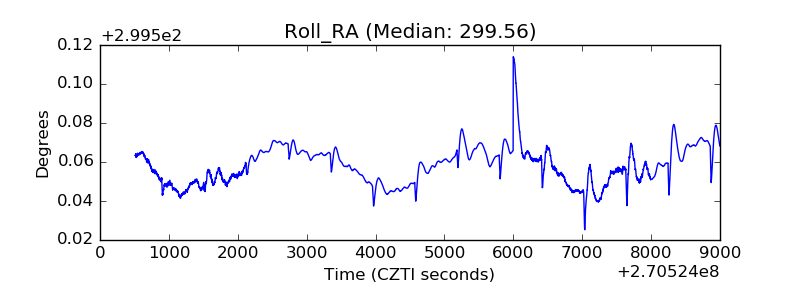 |
| Veto Counter | 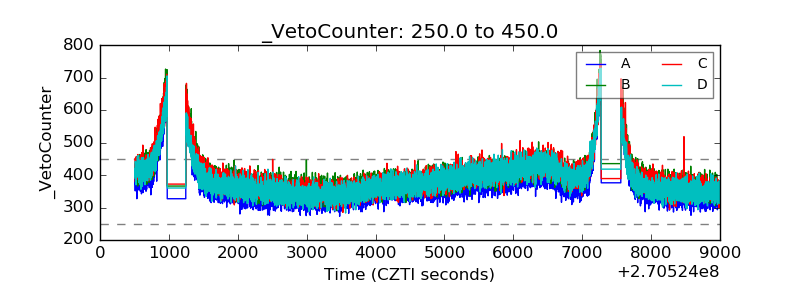 |