| Param | Original file | Final file |
|---|---|---|
| Filename | modeM0/AS1T02_073T01_9000002260_15322cztM0_level2.evt | modeM0/AS1T02_073T01_9000002260_15322cztM0_level2_quad_clean.evt |
| Size (bytes) | 1,237,890,240 | 218,759,040 |
| Size | 1.2 GB | 208.6 MB |
| Events in quadrant A | 8,627,360 | 1,346,986 |
| Events in quadrant B | 8,840,227 | 1,364,986 |
| Events in quadrant C | 10,315,519 | 1,334,663 |
| Events in quadrant D | 8,444,133 | 1,292,985 |
| Mode SS | |||
|---|---|---|---|
| Quadrant | BADHDUFLAG | Total packets | Discarded packets |
| A | 0 | 382 | 0 |
| B | 0 | 382 | 0 |
| C | 0 | 382 | 0 |
| D | 0 | 382 | 0 |
| Mode M0 | |||
|---|---|---|---|
| Quadrant | BADHDUFLAG | Total packets | Discarded packets |
| A | 0 | 38118 | 5 |
| B | 0 | 38427 | 4 |
| C | 0 | 41936 | 4 |
| D | 0 | 38367 | 4 |
| Mode M9 | |||
|---|---|---|---|
| Quadrant | BADHDUFLAG | Total packets | Discarded packets |
| A | 0 | 21 | 0 |
| B | 0 | 21 | 0 |
| C | 0 | 21 | 0 |
| D | 0 | 21 | 0 |
| Quadrant | Total seconds | Saturated seconds | Saturation percentage |
|---|---|---|---|
| A | 18653 | 298 | 1.597598% |
| B | 18653 | 365 | 1.956790% |
| C | 18653 | 334 | 1.790597% |
| D | 18653 | 235 | 1.259851% |
Noise dominated data is calculated using 1-second bins in cleaned event files. If a bin has >2000 counts, and if more than 50% of those come from <1% of pixels, then it is considered to be noise-dominated and hence unusable.
| Quadrant | # 1 sec bins | Bins with >0 counts | Bins with >2000 counts | High rate bins dominated by noise | Noise dominated (total time) | Noise dominated (detector-on time) | Marked lightcurve |
|---|---|---|---|---|---|---|---|
| A | 20799 | 18655 | 1 | 1 | 0.00% | 0.01% | 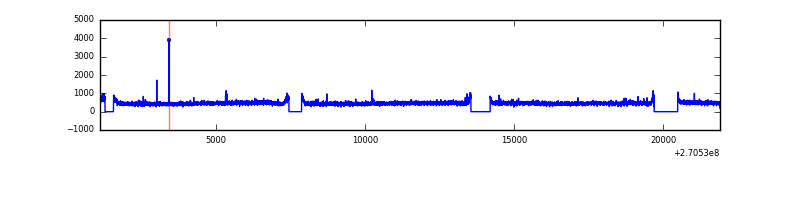 |
| B | 20799 | 18655 | 19 | 19 | 0.09% | 0.10% | 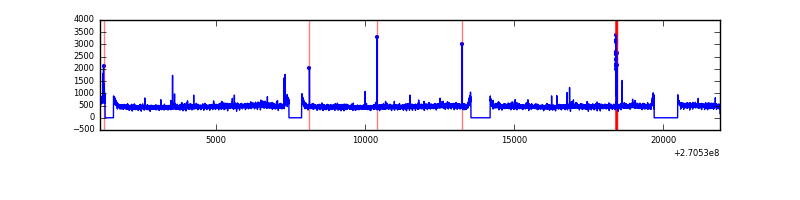 |
| C | 20799 | 18655 | 62 | 62 | 0.30% | 0.33% | 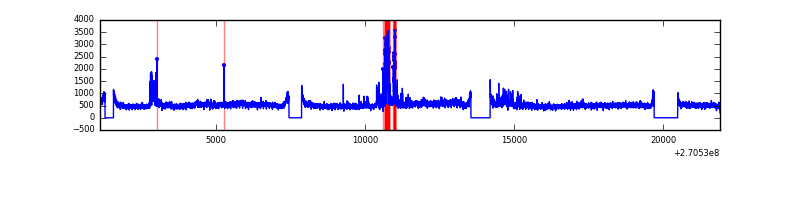 |
| D | 20799 | 18656 | 15 | 15 | 0.07% | 0.08% | 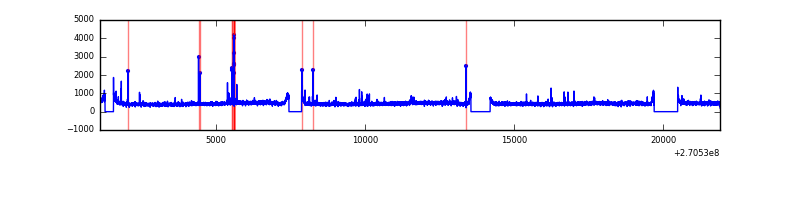 |
Top three noisy pixels from each quadrant. If the there are fewer than three noisy pixels in the level2.evt file, extra rows are filled as -1
| Pixel properties | Quadrant properties | ||||||
|---|---|---|---|---|---|---|---|
| Quadrant | DetID | PixID | Counts | Sigma | Mean | Median | Sigma |
| A | 9 | 143 | 27783 | 56.89 | 2230 | 2176 | 450.1 |
| A | 0 | 253 | 19456 | 38.39 | 2230 | 2176 | 450.1 |
| A | 0 | 226 | 19267 | 37.97 | 2230 | 2176 | 450.1 |
| B | 0 | 189 | 79376 | 180.74 | 2223 | 2160 | 427.2 |
| B | 12 | 111 | 53229 | 119.54 | 2223 | 2160 | 427.2 |
| B | 11 | 111 | 45939 | 102.47 | 2223 | 2160 | 427.2 |
| C | 3 | 233 | 1858923 | 3731.3 | 2160 | 2172 | 497.6 |
| C | 8 | 128 | 15798 | 27.38 | 2160 | 2172 | 497.6 |
| C | 13 | 61 | 15287 | 26.36 | 2160 | 2172 | 497.6 |
| D | 8 | 195 | 73672 | 134.89 | 2172 | 2104 | 530.6 |
| D | 2 | 234 | 63803 | 116.29 | 2172 | 2104 | 530.6 |
| D | 10 | 70 | 58996 | 107.23 | 2172 | 2104 | 530.6 |
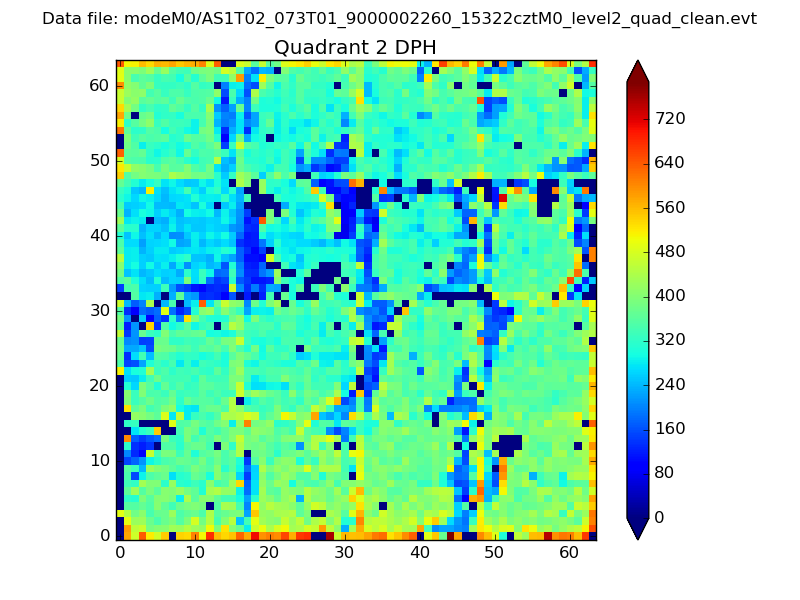
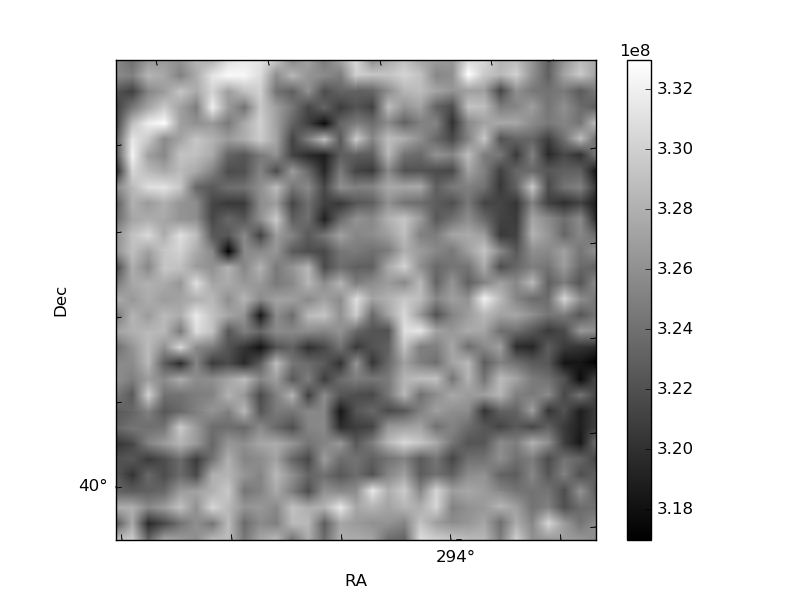
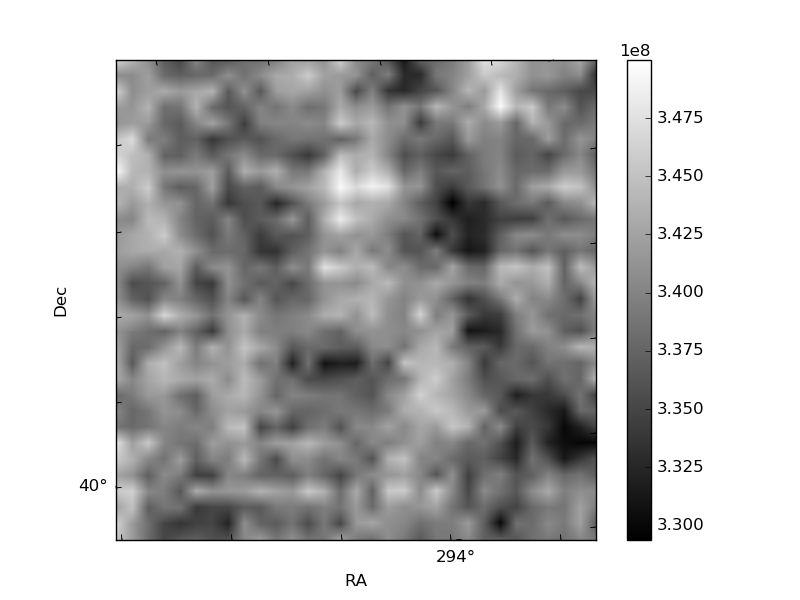
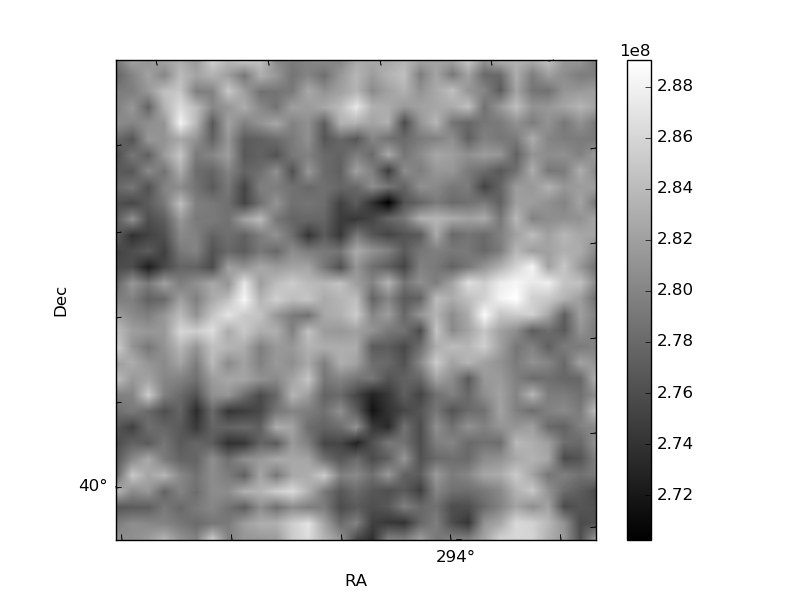
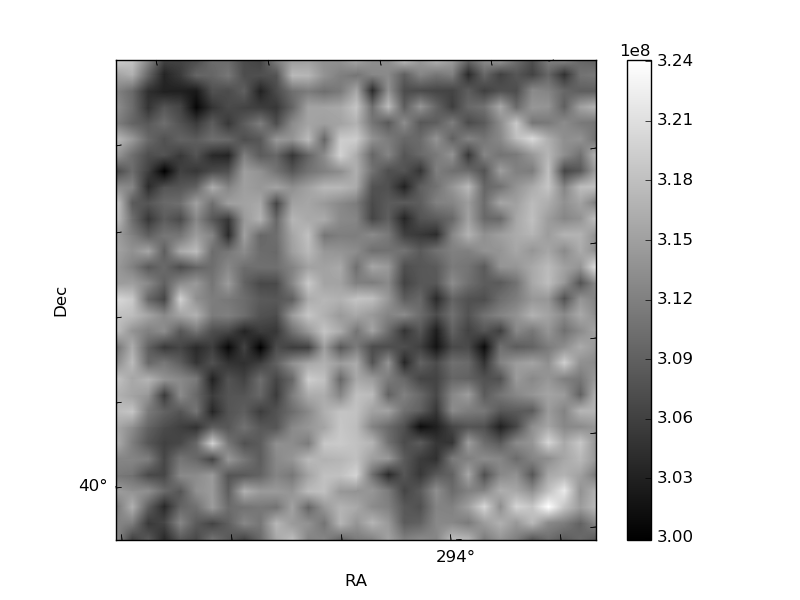
Histogram calculated using DETX and DETY for each event in the final _common_clean file
| Quadrant A |  |
 |
Quadrant B |
|---|---|---|---|
| Quadrant D | 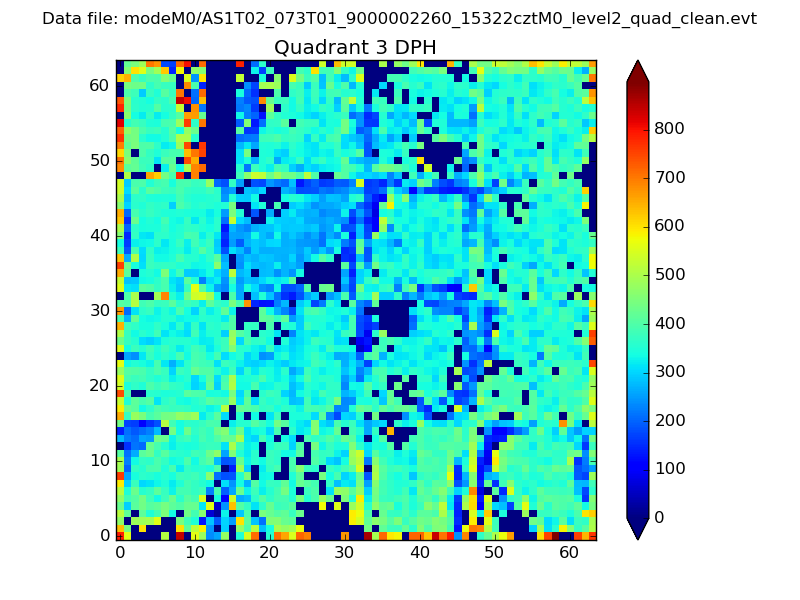 |
 |
Quadrant C |
| Plot type | Count rate plots | Images |
|---|---|---|
| Comparison with Poisson distribution Blue bars denote a histogram of data divided into 1 sec bins. Red curve is a Poisson curve with rate = median count rate of data. |
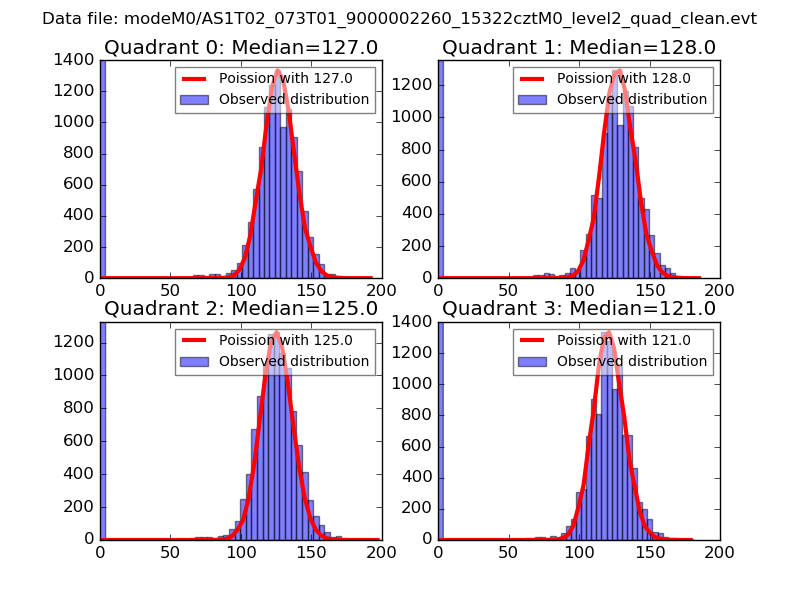 |
 |
| Quadrant-wise count rates Data is divided into 100 sec bins |
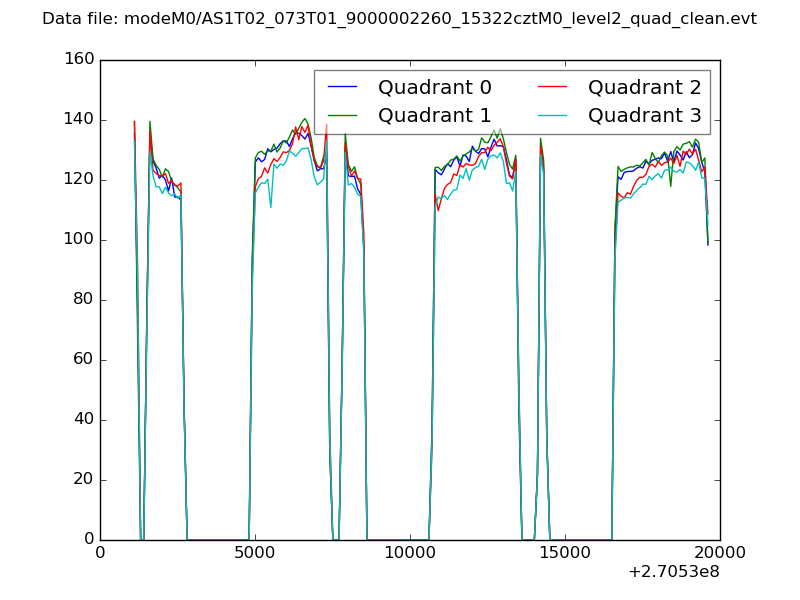 |
|
| Module-wise count rates for Quadrant A Data is divided into 100 sec bins |
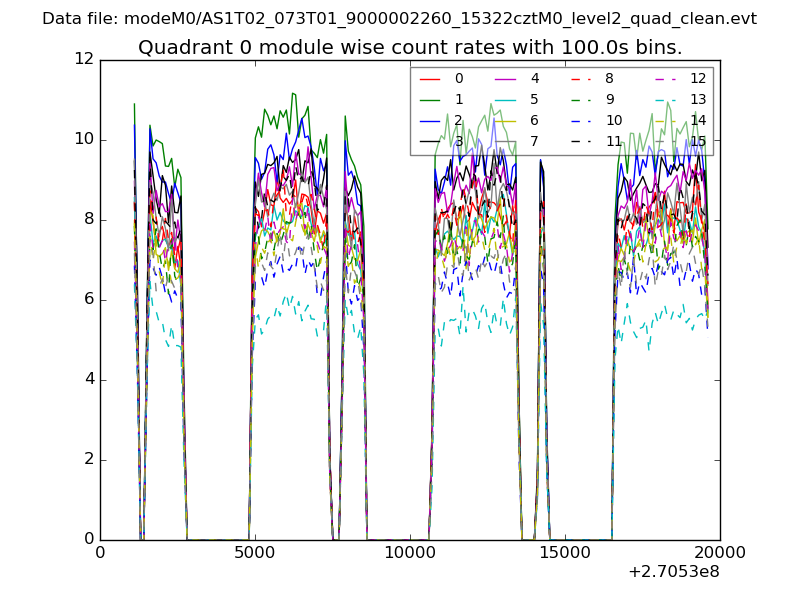 |
 |
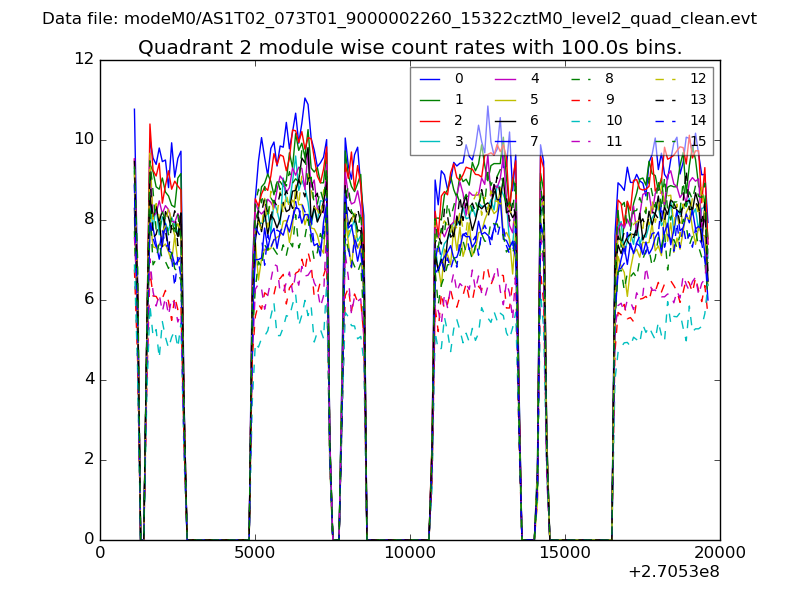
| Module-wise count rates for Quadrant B Data is divided into 100 sec bins |
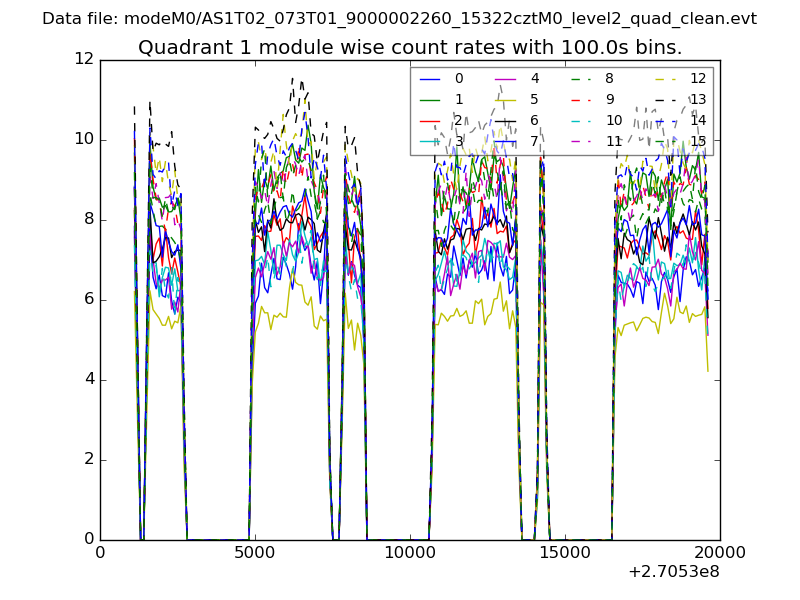 |
 |
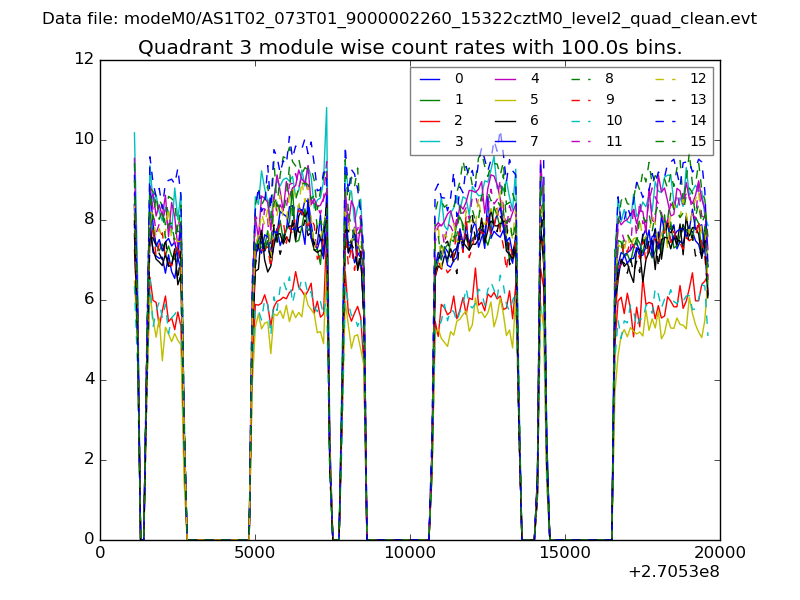
| Module-wise count rates for Quadrant C Data is divided into 100 sec bins |
 |
 |
| Module-wise count rates for Quadrant D Data is divided into 100 sec bins |
 |
 |
| Parameter | Plot |
|---|---|
| CZT HV Monitor | 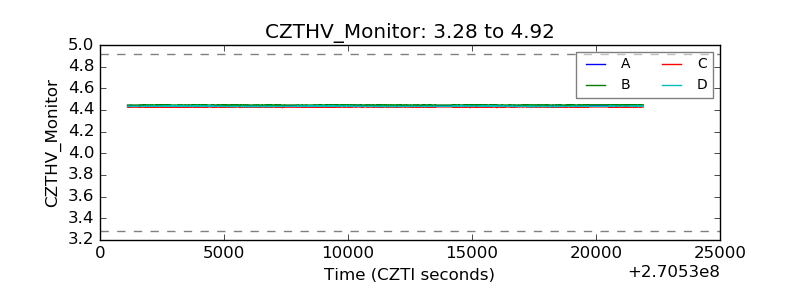 |
| D_VDD | 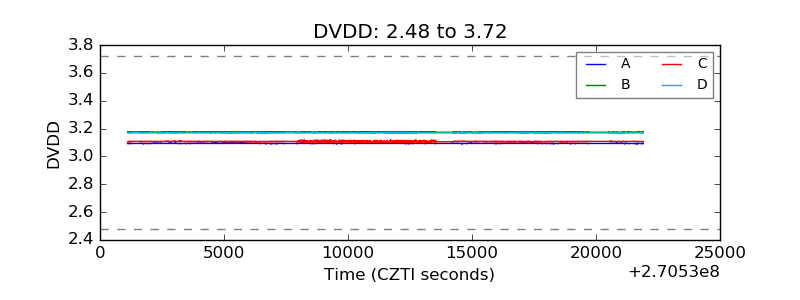 |
| Temperature 1 | 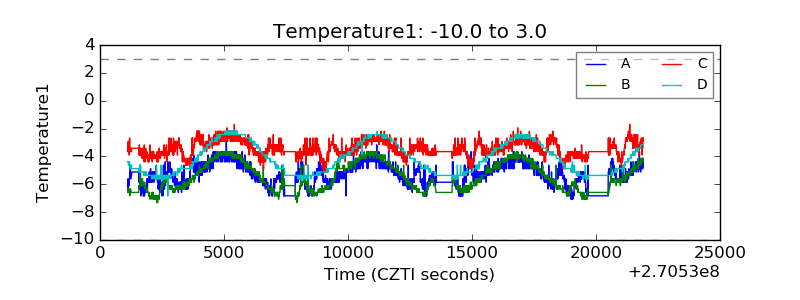 |
| Veto HV Monitor | 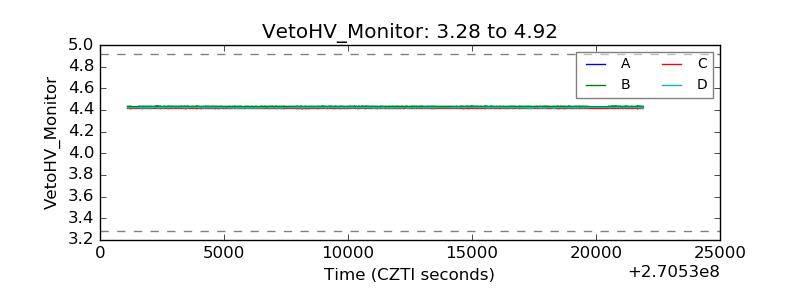 |
| Veto LLD |  |
| Alpha Counter | 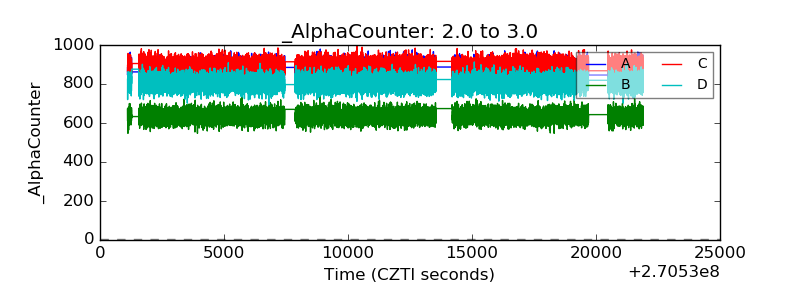 |
| _CPM_Rate | 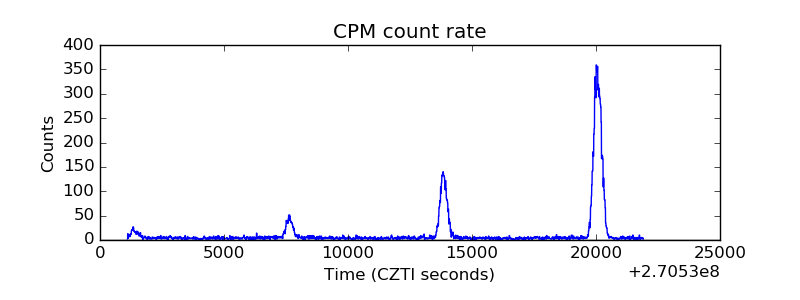 |
| CZT Counter | 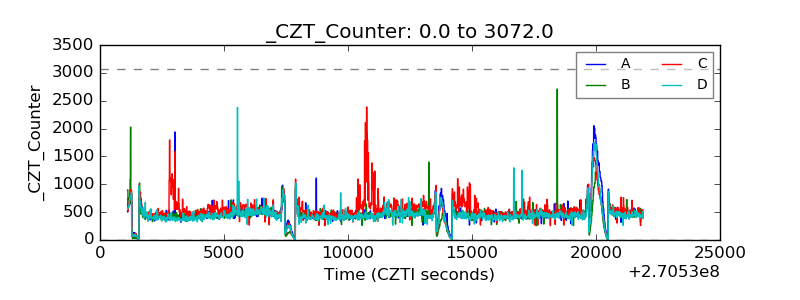 |
| +2.5 Volts monitor |  |
| +5 Volts monitor | 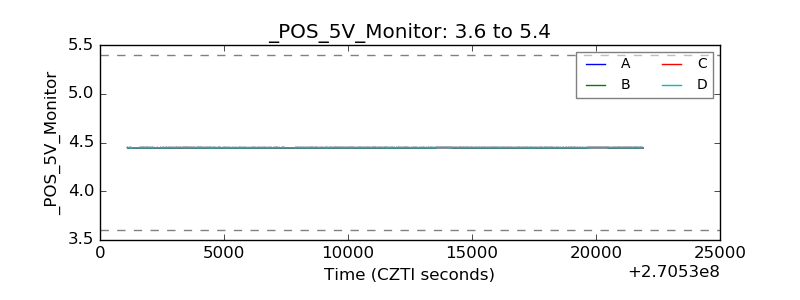 |
| _ROLL_ROT | 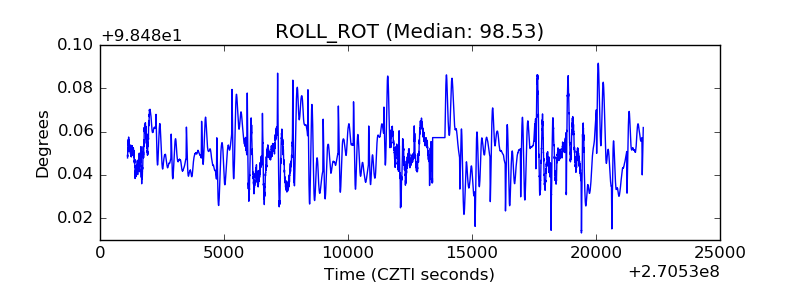 |
| _Roll_DEC | 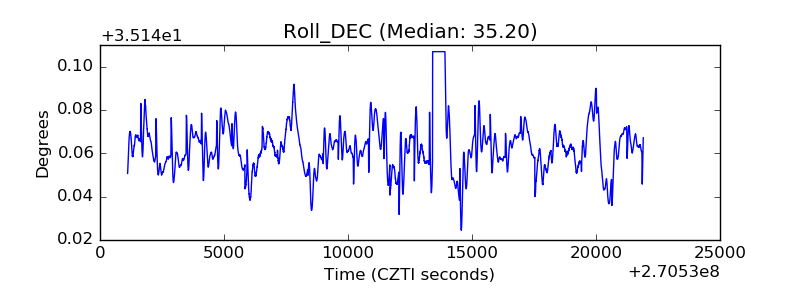 |
| _Roll_RA | 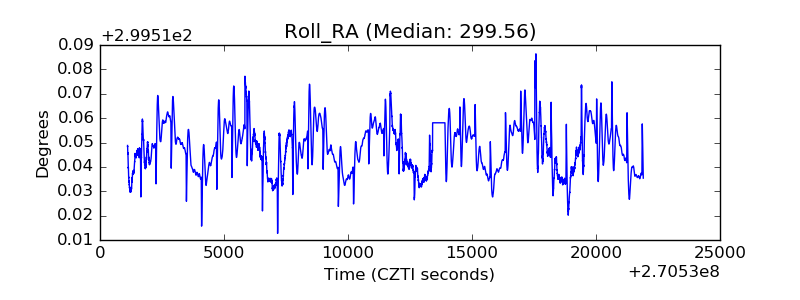 |
| Veto Counter | 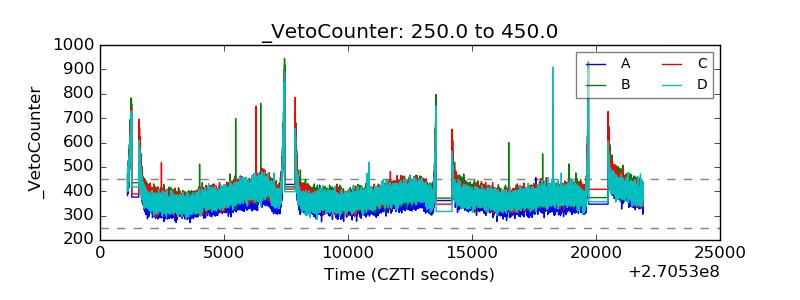 |